1
Application of Machine Learning to Financial
Time Series Analysis
Martin Victor Sewell
Thesis submitted for the degree of Doctor of Philosophy
of UCL
Department of Computer Science University College London
University of London
I, Martin Victor Sewell, confirm that the work presented in this thesis is my own. Where information has been derived from other sources, I confirm that this has been indicated in the thesis.
Abstract 3
Abstract
This multidisciplinary thesis investigates the application of machine learning to financial time series analysis. The research is motivated by the following thesis question: ‘Can one improve upon the state of the art in financial time series analysis through the application of machine learning?’ The work is split according to the following time series trichotomy: 1)characterization — determine the fundamental properties of the time series; 2)modelling— find a description that accurately captures features of the long-term behaviour of the system; and 3)forecasting— accurately predict the short-term evolution of the system.
Characterization
The research oncharacterizationto determine fundamental properties comprises five experiments. They all relate to implementing algorithms that test the cornerstone of modern financial theory, the efficient market hypothesis. In tests for dependence, tests for autocorrelation and two runs tests are applied to US stock market returns and six foreign exchange currency pairs. Results showed that daily DJIA, USD/DEM, USD/JPY, GBP/USD, USD/CHF and GBP/CHF returns each exhibit a surprising number of sequences of decreasing returns. In a test for long memory, my implementation of Hurst’s rescaled range (R/S) analysis (in C++) found little evidence of long memory in US stock market returns. In a test of market efficiency, the performance of investment newsletters is analysed, evidencing weak-form efficiency. All five experiments (potentially) have implications apropos market efficiency, and impart domain knowledge vis-`a-vis financial time series for the work on forecasting.
Modelling
The work onmodellingto capture long-term behaviour utilizes behavioural finance to 1) model market action and 2) model investors’ risk preferences. For the former, in order to model as accurately as possible, minimal assumptions are made and a bottom-up approach is used. The evolved heuristics and biases exhibited by fundamental analysts and technical analysts are used to build an agent-based artificial stock market (in Excel). The proportion of technical analysts is varied and the statistics of the time series generated by the artificial market analysed. In the second part, in order to accurately model decision making under uncertainty in practice I adopt the seminal psychological (descriptive), rather
than economic (normative), formulation, prospect theory. I devise and implement (in PHP and VB) an investment performance measurement metric, cumulative prospect theory certainty equivalent (CPTCE).
Forecasting
The research onforecastingconcerns the prediction of financial markets. First domain knowledge gained via the runs test is used to build a DJIA trading system. I then use kernel methods, a recent, successful and computationally efficient class of algorithms used for pattern analysis. A hidden Markov model (HMM) is trained on foreign exchange data to derive a Fisher kernel (which I implement in C++) for a support vector machine (SVM), and the (difference of convex functions) DC algorithm and the Bayes point machine are also used to create kernels. Furthermore, the DC algorithm is used to learn the parameters of the HMM in the Fisher kernel. I ported two implementations of SVMs to Windows and also added semi-automated parameter selection. SVMdark is written in C for Win32, and winSVM in C++ for Win32.
Contributions to Science
The thesis is believed to make several novel contributions to science, it is multidisciplinary with con-tributions to both computer science and finance. In the work oncharacterizationI wrote software for performing the runs test and testing for long-memory. I then reconcile the fact that daily stock mar-ket and foreign exchange log returns pass linear statistical tests of efficiency, yet non-linear forecasting methods can still make above-average risk-adjusted returns, and the nature of the inefficiencies are iden-tified. In the research onmodellingthe agent-based artificial stock market generated a time series that provides a novel insight into the effect of the proportion of technical analysts relative to fundamental analysts. Whilst the novel investment performance measurement metric, cumulative prospect theory certainty equivalent (CPTCE), models investors’ empirically-observed risk preferences, whilst no other performance metric does this effectively. The experiments onforecastingincluded using the DC algo-rithm to learn the parameters of the hidden Markov model in the Fisher kernel, this is a novel algoalgo-rithm. Two Windows implementations of SVMs with semi-automated parameter selection were built, for some time they were the only Windows applications dedicated to support vector machines.
Acknowledgements 5
Acknowledgements
Firstly, I wish to thank my supervisor Philip Treleaven for providing me with the opportunity to embark upon a PhD in the first place. Thanks also to David Corney for acting as a mentor. Thanks to John Campbell for sparking my interest in multiagent systems. For general help within the department I thank Chris Clack, and for friendship and collaboration Wei Yan. Thanks to Hurst Consulting and INLECOM for sponsorship. Thanks to Salus Alpha, Fortress Investment Group, Anova Fund, Global Advisors and eStats Capital for providing data. Thanks to Brian McIntosh and Paul Jeffrey of The School of Water Sciences at Cranfield University for employment, and thanks to Christopher Lucas for work with Cirrus Capital.
Thanks to my UCL drinking companions Robert, David, Emma B., Miles, Michael, Dirk, Gordon, Bill, Tim and Emma T for many great evenings, and thanks to Robert and Nancy for helping me stop. Thanks to Julie D., Philippa, Emma, Michael, Nancy, John & Zo¨e, Vanessa, Petya, Christophe, Valerie, Sauminh, Bill, Carol, Amy, Monica, Wei, Niklas, Lai Nee, Tristan, Tom, Jon, Vicki, Julie Z., Qi, Flo-rence, Julie K., Kiri, Jas, Maya, Lucia and my parents for feeding me at various times. Many thanks to Nancy for always being there. Thanks to Carol for accompanying me on several trips to the cinema in Bedford. Thanks to Vicki for many pleasant days out. Eternal thanks to Zac Harland for sharing his un-bridled enthusiasm and extensive knowledge of trading over numerous and regular coffees in the Gower Street bookshop. Thanks to my clubbing friends Dave, Amanda, Jim, Rose, Rosie, et al. for festivals, fun and keeping me young.
Thank you to Robert Dodier for convincing me of the superiority of probability right from the start. Thanks to David Wolpert for quick and helpful replies to my queries on the no free lunch theorems, to Andrew Lo for clarifying the EMH and to Eugene Fama for a historical correction. Thanks to our ex-Head of Department, Anthony Finkelstein, for having faith in me. For comments on drafts of this thesis, I thank David Corney, Monica Diekmann-Kotzee, Anthony Finkelstein, John Shawe-Taylor, Christophe Cuny, Niklas Traub, Bill Langdon, Zac Harland, Miles Hansard, Robin Hankin, Professor Treleaven and my parents. A special thanks are due to Professor Shawe-Taylor for algorithmic suggestions and thanks to Professor Treleaven for guidance on the home straight and helping me turn a book into a thesis. Thanks also to David Barber, Edward Tsang, Christoph Schommer, Ricardo Silva and anonymous reviewers for various corrections and suggestions. With a view to future work, thanks to Adam Johansen for help regarding particle filters and thanks for communications with Frank Lad, surely the purest subjectivist Bayesian since de Finetti. Thanks to Wei Si for spotting an error.
I would also like to thank Chris Neely for numerous emails patiently detailing the methodology used in his work with Paul Weller. In Cambridge, thanks to the directors of 4CMR Terry Barker and Doug Crawford-Brown for their generous and patient support, thanks to Robin Hankin for his rigorous approach to science. Thanks also to Mair´ead, Annela, Svetlana, Paul, Mark, Jun Li, Yongfu and the rest of 4CMR for putting up with me. Thanks to Stephen Stretton, a work colleague and friend, for his intelligent insight. Thanks also to Richard Schuhmertl from Quant Capital for recognising my potential and providing me with a great opportunity. A special mention to Julie Kim, whose texts and company make me smile. Thanks to Jas for her eternal cheekiness. Thanks to Anouska and Freddie for being there. Naturally, eternal thanks go to my parents for their life-long support. Thanks to luck for my ability to select the unique model Talisa Qi, the only model that was right. Finally, thank god I’ve finished.
Contents 7
Contents
Abstract 3 Publications 15 1 Introduction 17 1.1 Motivations . . . 17 1.2 Research Objectives . . . 19 1.3 Research Methodology . . . 19 1.3.1 Characterization . . . 19 1.3.2 Modelling . . . 20 1.3.3 Forecasting . . . 21 1.4 Contributions to Science . . . 22 1.5 Chapters . . . 242 Background and Literature Review 27 2.1 Introduction . . . 27
2.2 Efficient Market Hypothesis . . . 28
2.3 Characterization . . . 29
2.3.1 Markets . . . 30
2.3.2 Time Series . . . 30
2.3.3 Stochastic Processes in Financial Markets . . . 30
2.3.4 Stylized Facts . . . 32
2.3.5 Dependence in Market Returns . . . 32
2.3.6 Long Memory in Market Returns . . . 34
2.3.7 Investment Newsletters . . . 37 2.4 Modelling . . . 39 2.4.1 Behavioural Finance . . . 39 2.4.2 Technical Analysis . . . 41 2.4.3 Multiagent Systems . . . 44 2.4.4 Prospect Theory . . . 44
2.5 Forecasting . . . 47
2.5.1 No Free Lunch Theorem for Supervised Machine Learning . . . 47
2.5.2 Data Snooping . . . 48
2.5.3 Kernel Methods . . . 48
2.5.4 Support Vector Machines . . . 49
2.5.5 Genetic Programming . . . 52
3 Characterization 55 3.1 Data . . . 55
3.2 Autocorrelation . . . 56
3.3 Runs Test . . . 57
3.3.1 First Runs Test . . . 58
3.3.2 Second Runs Test . . . 58
3.4 Long Memory . . . 60
3.5 Investment Newsletters . . . 61
3.6 Conclusion and Summary . . . 63
4 Modelling 65 4.1 An Artificial Stock Market . . . 65
4.1.1 Design . . . 65
4.1.2 Implementation . . . 66
4.1.3 Testing . . . 72
4.2 Investment Performance Measurement . . . 76
4.2.1 Design . . . 76
4.2.2 Implementation . . . 78
4.2.3 Testing . . . 80
4.3 Conclusion and Summary . . . 81
5 Forecasting 83 5.1 Forecasting DJIA Daily Returns . . . 83
5.2 Kernel Methods . . . 84
5.3 Design . . . 85
5.4 Implementation . . . 99
5.5 Testing . . . 104
5.6 Conclusion and Summary . . . 108
6 Assessment 109 6.1 Hypothesis . . . 109
6.2 Precision . . . 110
Contents 9 6.4 Contributions . . . 116 6.5 Comparison with Similar Work of Others . . . 118 6.6 Conclusion and Summary . . . 122
7 Conclusion and Future Work 123
7.1 Conclusion . . . 123 7.2 Further Work . . . 126
A ISO 4217 Currency Codes 135
B Exchanges and Stock Market Indices 137
B.1 Exchanges . . . 137 B.2 Stock Market Indices . . . 139
C Time Series Glossary 141
D Runs Tests Source Code 143
E Runs Tests on DJIA Returns 153
F Runs Tests on Foreign Exchange Returns 159
G Rescaled Range Analysis Source Code 167
H Technical Analysis Taxonomy 171
I Cumulative Prospect Theory Certainty Equivalent Source Code 173
J Kernel Methods/Support Vector Machines 183
J.1 Gram Matrix . . . 183 J.2 Hilbert Space . . . 183
K Fisher Kernel Source Code 185
L Similar Publications 189
List of Figures 11
List of Figures
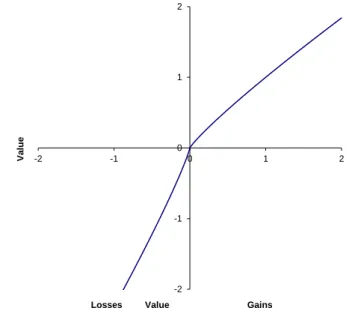
2.1 A hypothetical value function in prospect theory . . . 45
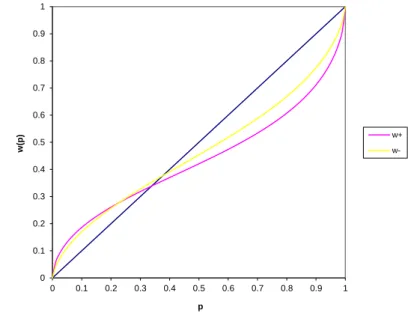
2.2 Weighting functions for gains and losses in cumulative prospect theory . . . 46
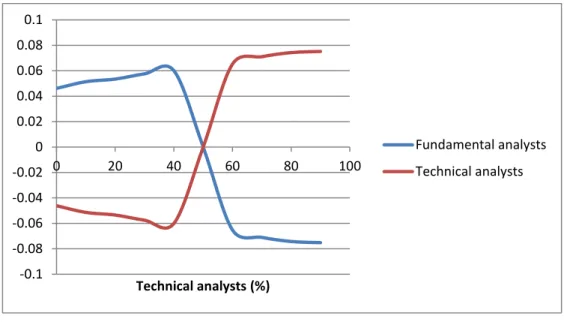
4.1 Mean log return (P&L) per analyst . . . 73
4.2 Mean Sharpe ratio per analyst . . . 74
4.3 Statistics of price log returns . . . 74
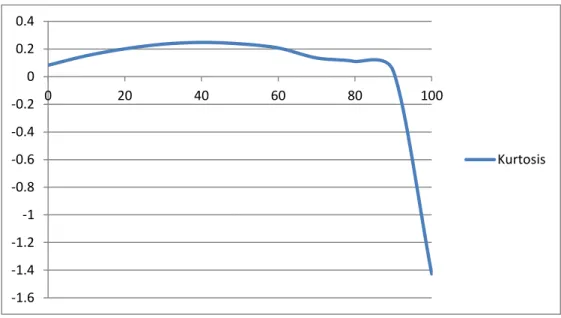
4.4 Kurtosis of price log returns . . . 75
4.5 Autocorrelations of price log returns . . . 75
4.6 Maximal Sharpe ratio . . . 78
5.1 Forecasting DJIA daily returns equity curve . . . 84
5.2 SVMdark. . . 88
5.3 winSVM . . . 89
5.4 Rolling window data sets . . . 101
List of Tables 13
List of Tables
2.1 Stochastic processes and their applicability to markets . . . 31
3.1 Autocorrelation of DJIA log returns . . . 57
3.2 Autocorrelation of foreign exchange log returns . . . 57
3.3 Runs of DJIA log returns above and below the mean . . . 58
3.4 Runs of foreign exchange log returns above and below the mean . . . 59
3.5 Rescaled range analysis on detrended DJIA log returns . . . 62
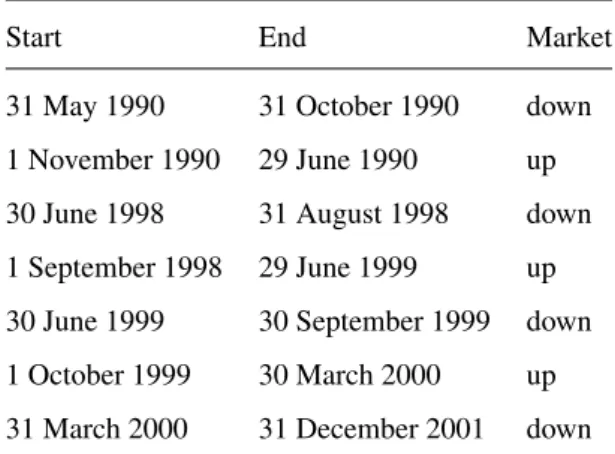
3.6 ‘Up markets’ and ‘down markets’ as defined by the ‘Forbes/Hulbert investment letter survey’ . . . 62
3.7 Correlation matrix of ‘The Forbes/Hulbert investment letter survey’ . . . 63
3.8 The extent to which the four statistical tests rejected weak form market efficiency across different time periods. . . 64
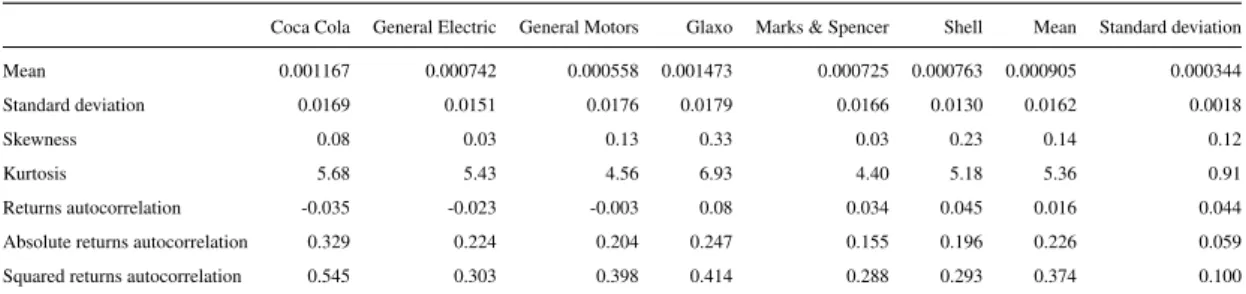
4.1 Statistics of daily stock log returns . . . 72
4.2 Statistics generated by the artificial stock market . . . 73
4.3 Range of proportions of technical analysts in the artificial stock market that replicate stylized facts . . . 76
4.4 Sharpe ratio and CPTCE correlations . . . 81
5.1 Pseudocode for the fixed length HMM kernel . . . 92
5.2 Fisher kernel test results . . . 99
5.3 Fisher kernel symbol allocation . . . 102
5.4 Out of sample results, USD/DEM . . . 104
5.5 Out of sample results, USD/JPY . . . 105
5.6 Out of sample results, GBP/USD . . . 105
5.7 Out of sample results, USD/CHF . . . 105
5.8 Out of sample results, DEM/JPY . . . 106
5.9 Out of sample results, GBP/CHF . . . 106
5.10 Out of sample results, Mean . . . 106
5.11 Summary of results on forecasting . . . 108
E.2 DJIA daily returns: decreasing . . . 154
E.3 DJIA weekly returns: increasing . . . 154
E.4 DJIA weekly returns: decreasing . . . 155
E.5 DJIA monthly returns: increasing . . . 155
E.6 DJIA monthly returns: decreasing . . . 156
E.7 DJIA annual returns: increasing . . . 156
E.8 DJIA annual returns: decreasing . . . 157
F.1 USD/DEM daily returns: increasing . . . 159
F.2 USD/DEM daily returns: decreasing . . . 160
F.3 USD/JPY daily returns: increasing . . . 160
F.4 USD/JPY daily returns: decreasing . . . 161
F.5 GBP/USD daily returns: increasing . . . 161
F.6 GBP/USD daily returns: decreasing . . . 162
F.7 USD/CHF daily returns: increasing . . . 162
F.8 USD/CHF daily returns: decreasing . . . 163
F.9 DEM/JPY daily returns: increasing . . . 163
F.10 DEM/JPY daily returns: decreasing . . . 164
F.11 GBP/CHF daily returns: increasing . . . 164
PUBLICATIONS 15
Publications
The research in this thesis has resulted in 25 publications in total (12 peer reviewed): 5 journal articles, 5 conference proceedings, 1 book chapter and 6 technical reports, as listed below. The key publications are shown in bold.
Patel, N. and Sewell, M. (2015), Calendar anomalies: A survey of the literature,International Journal of Behavioural Accounting and Finance5(2), 99–121.
Sewell, M. (2012a), The efficient market hypothesis: Empirical evidence,International Journal of Statistics and Probability1(2), 164–178.
Sewell, M. (2012b), The demarcation of science, Young Statisticians’ Meeting, Cambridge, 2–3 April 2012.
Sewell, M. (2012c), An artificial stock market,inJ. Filipe and A. Fred (eds.),ICAART 2012: Pro-ceedings of the 4thInternational Conference on Agents and Artificial Intelligence, Volume 2.
Vil-amoura, Algarve, Portugal, 6 - 8 February, 2012, SciTePress, Set ´ubal, pp.293–300.
Sewell, M. (2012d), Ideology-free politics: A bottom-up approach, CRASSH Postdoctoral Research Seminar Series. Cambridge, 21 June 2012.
Sewell, M. (2012e), The philosophy of risk,in URMPM World Congress 2012 in London. “The Human Factor in Risk”. Proceedings, Union of Risk Management for Preventive Medicine (URMPM), p.80.
Sewell, M. and Shawe-Taylor, J. (2012), Forecasting foreign exchange rates using kernel methods, Expert Systems with Applications39(9), 7652–7662.
Sewell, M. (2011a), The evolution of entrepreneurs and venture capitalists,inR. Yazdipour (ed.), Ad-vances in Entrepreneurial Finance: With Applications from Behavioral Finance and Economics, Springer, New York, Chapter 11, pp.205–217.
Sewell, M. (2011b), Characterization of financial time series, Research Note RN/11/01, University Col-lege London, London.
Sewell, M. (2011c), Ensemble learning, Research Note RN/11/02, University College London, London.
Sewell, M. (2011e), History of the efficient market hypothesis, Research Note RN/11/04, University College London, London.
Sewell, M. (2011f), Money management, Research Note RN/11/05, University College London, London.
Sewell, M. (2011g), The Fisher kernel: A brief review, Research Note RN/11/06, University College London, London.
Sewell, M. (2011h), Psychology of successful investing, behaviouralfinance.net, 12 February 2011.
Sewell, M. (2011i), Human behaviour under risk and uncertainty: Are we really just conservative?, envecon 2011: Applied Environmental Economics Conference, London, 4 March 2011.
Sewell, M. (2010a), Introduction to behavioural finance, behaviouralfinance.net, 14 April 2010.
Sewell, M. (2010b), Emotions help solve the prisoner’s dilemma, Behavioural Finance Working Group Conference: Fairness, Trust and Emotions in Finance, London, 1–2 July 2010.
Sewell, M., Schuhmertl, R., Wei, J. and Harris, D. (2010), Quant Capital’s M&A Strategy, 19 June 2010.
Sewell, M. (2009a), Algorithm bias: A statistical review,Futurespp.38–40.
Sewell, M. (2009b), Decision making under risk: A prescriptive approach,in Proceedings of the 2009 Symposium; Academy of Behavioral Finance and Economics, September 23-25, 2009, Chicago,
Illi-nois, Academy of Behavioral Finance and Economics, Montrose, CA, p.9.
Sewell, M. (2008a), Optimization and methods to avoid overfitting, Talk presented at the Automated Trading 2008 conference, London, 15 October 2008.
Sewell, M. (2008b), Gender (sic) equality (sic),Opticon18264.
Sewell, M. V. and Yan, W. (2008), Ultra high frequency financial data,inM. Keijzer (ed.),Proceedings of the 2008 GECCO Conference Companion on Genetic and Evolutionary Computation, ACM, New York, pp.1847–1850.
Yan, W., Sewell, M. V. and Clack, C. D. (2008), Learning to optimize profits beats predicting returns — comparing techniques for financial portfolio optimisation,inM. Keijzer (ed.),Proceedings of the 10th Annual Conference on Genetic and Evolutionary Computation, ACM, New York, pp.1681–1688.
17
Chapter 1
Introduction
This chapter sets the scene. It starts with my motivations for undertaking the work, and explains why the area of research is important. It continues with the research objectives including the research question, the research methodology for the chapters on character-ization, modelling and forecasting and then lists the all important contributions made to science. The chapter finishes with an annotated guide to each chapter in the thesis.
1.1
Motivations
This thesis concerns the application of machine learning to the understanding of financial markets. A greater understanding of financial markets is important, if only because of their impact on the global economy. Back in 1929 the Wall Street Crash caused the Dow Jones Industrial Average (DJIA) to lose 40 per cent of its value in two months. In 1992 in the UK, the events that took place on Black Wednesday when sterling was forced out of the ERM are an example of when the markets were more powerful than the governments; the markets were right in the sense that the devaluation forced on sterling was justified by the country’s economic dilemma. A third example concerns the ‘dot-com bubble’, the DJIA tripled between 1994 and 1999, whilst, over the same period, basic economic indicators did not come close to tripling. The global financial crisis of 2007–08 led to a downturn in the housing market, evictions, foreclosures, the failure of businesses, unemployment, huge declines in consumer wealth and a downturn in economic activity. Lastly,dailyforeign exchange market turnover averaged $5.3 trillion in April 2013 (Bank for International Settlements, 2013). This is over 17 times greater than the gross domestic product (GDP) of the world economy and over 100 times greater than global exports.
Gershenfeld and Weigend (1994) claim that [t]ime series analysis has three goals: forecasting, modeling, and characterization. I utilize their time series trichotomy, albeit in a different order, and applied it to financial time series to structure the core of the thesis thus.
The research on characterization in this thesis is partially motivated because it imparts domain knowledge for the work on forecasting. It is also motivated by the challenge itself, for example the distribution of financial market returns is not precisely known.
The markets uniquely capture the psychology of individuals on a large scale. Markets usually reflect the decisions of thousands or even millions of people going about their daily lives. The sheer size of the markets also makes the area research-worthy and non-trivial. Multiagent systems would appear the most natural way of modelling a market when the market participants are both numerous and autonomous.
The task of forecasting financial markets is one of predicting a time series generated from a social science, which in practice is purely an exercise in information processing. An attractive way of achiev-ing this is to make minimal assumptions and use a data-driven, model-free, flexible and nonparametric approach. In other words, use machine learning, in the guise of supervised learning, which encompasses both theoretical soundness and experimental effectiveness. The central paradigm in the model-driven domain of finance is the ‘efficient market hypothesis’ (EMH), and an efficient market is one in which prices always ‘fully reflect’ available information. This creates a challenge, as it implies that ‘beating the market’ by forecasting changes in price is at best very difficult, and at worst impossible. The EMH is thus important because it places restrictions on what is possible vis-`a-vis forcasting algorithms. The research on forecasting is thus partially motivated because it creates the potential to challenge the central paradigm in finance, the EMH. Plus it presents the potential to improve supervised learning algorithms.
Another motivation for focussing on finance is that the research domain is growing. As technology drives down transaction costs, markets are increasingly accessible to an increasing number of partic-ipants. Also, globally, the failure of communism has ensured that the market economy continues to grow.
In addition to the research described in this thesis, there exists an array of opportunities for further work in this field. Algorithmic trading typically involves splitting up an order to buy or sell a fixed number of shares in an optimal manner over a period of time; this is extremely fertile territory for the application of machine learning. Intelligent techniques could be used to optimize a trading system based on cointegration. Deep learning algorithms could be used to forecast financial time series, as they should be able to find and exploit signals at different levels of abstraction. Ensemble learning could be used to attempt to combine individual predictive models in an optimal way. An equity trading system could be built using the knowledge gained from the characterization of equity markets. Intelligent techniques could be employed to select funds and allocate capital. Quantitative techniques could be applied to global macro hedge fund strategies. Optimizing an automated market-making algorithm using intelligent techniques could be hugely lucrative for the financial industry. In the area of mergers and acquisitions, machine learning could be applied to the potentially lucrative task of predicting takeover targets. Once a trader has found a positive expected return, they need to decide what proportion of their capital to bet per trade: money management and position sizing are a challenging optimization problem. Another potential source of enormous wealth would be the application of intelligent techniques to option pricing. Rather than just the price, or the bid and the ask, an intelligent trading system could utilize several levels of the order book. A probabilistic model such as a particle filter could be employed to track a financial time series. Finally, intelligent techniques could be employed to predict yield curves. Section 7.2 (p. 126) addresses potential ideas for further work and goes into more detail.
1.2. Research Objectives 19 My interests in developing the work further mainly concern working with ultra high frequency financial data. Tick data, preferably showing the order book, must be ripe for exploitation by machine learning, but would require impressive processing power, a vast amount of storage and robust algorithms. Today, tick data generated by financial markets quite possibly represents a greater volume than any other source outside high energy physics. Futures markets provide the most data, followed by foreign exchange markets, followed by stock markets, although most of the literature relates to stock markets. It is likely that the type of modelling required would be similar across all three types of market. In practice, we are more likely to be concerned with futures markets or foreign exchange markets because transaction costs are vanishingly small and leverage is possible.
1.2
Research Objectives
The thesis research question is: ‘Can one improve upon the state of the art in financial time series analysis through the application of machine learning?’ The thesis is split according to the three above-identified central areas of time series analysis: characterization, modelling and forecasting.
characterization Characterization attempts with little or no a priori knowledge to determine fundamen-tal properties, such as the stationarity of a system or the amount of randomness.
modelling The goal of modelling is to find a description that accurately captures features of the long-term behaviour of the system.
forecasting The aim of forecasting (also called predicting) is to accurately predict the short-term evolu-tion of the system.
In the forecasting third of the thesis the aims may be graduated thus: 1) to improve standard algorithms, and 2) to beat the ‘state of the art’. The more ambitious goal, 2), is ill-defined, as there is no consensus within academia and it is likely to be proprietary outside, but an algorithm that successfully forecast financial markets published in the academic literature shall be used as a proxy.
1.3
Research Methodology
1.3.1
Characterization
The goals of the research on characterization (Chapter 3) are to write efficient implementations of al-gorithms that contribute to the ‘stylized facts’1 of financial markets. Five experiments are conducted. The experiments are chosen because they are tests of market efficiency, and help us to characterize fi-nancial markets. A test of autocorrelation and two versions of the runs test (a non-parametric test of the mutual dependence of the elements of a sequence) were performed on the DJIA and six foreign ex-change currency pairs. Results showed that daily DJIA, USD/DEM, USD/JPY, GBP/USD, USD/CHF
1Astylized factis a term used in economics to refer to empirical findings that are so consistent (for example, across a wide
and GBP/CHF returns each exhibit a surprising number of sequences of decreasing returns. Whilst my implementation of Hurst’s rescaled range (R/S) analysis (in C++) found little evidence of long memory in stock market returns. My implementation ofR/Sanalysis is more accurate than commercially avail-able software, but slower. I purchased ‘The Forbes/Hulbert investment letter survey’, the data encom-passes performance from 31 May 1990 to 31 December 2001 and includes just those newsletters tracked that have a predominant US equity focus. The performance of the recommendations of the newsletters is analysed by means of correlation analysis on the quantitative data and the results evidenced weak-form market efficiency.
1.3.2
Modelling
The goals of the experiments on modelling are to improve algorithms that 1) model market action (Sec-tion 4.1) and 2) model investors’ risk preferences (Sec(Sec-tion 4.2). The experiments are chosen because they each allow us to model markets and investors’ risk preferences using a realistic bottom-up empiricallly-valid approach, with a focus on simplicity and realism. Both experiments utilize behavioural finance. For the former, the evolved heuristics and biases exhibited by fundamental analysts and technical analysts, such as representativeness and conservatism, are used to build an agent-based artificial stock market (in Excel). The relative proportion of technical analysts and fundamental analysts was allowed to vary, leading to the following broad conclusions. Whether a fundamental analyst, or a technical analyst, it pays to be in a majority. As the number of technical analysts increases, the standard deviation of returns decreases, whilst the skewness increases. Whilst kurtosis of market returns peaks with around 40 per cent technical analysts, and rapidly declines as the number of technical analysts exceeds 90 per cent. The autocorrelation of returns is close to zero with 100 per cent fundamental analysts, and approaches 1.0 as the proportion of technical analysts approaches 100 per cent. With a realistic proportion of tech-nical analysts and fundamental analysts, the artificial stock market replicates mean returns, the standard deviation of returns, the absolute returns correlation and the squared returns correlation of a real stock market. However, the artificial stock market failed to accurately replicate the skewness, kurtosis and au-tocorrelation of returns. The number of free parameters was kept to a minimum, so there was little scope for tuning the model until it output the desired results. In the second part, I devised and implemented (in both PHP and Visual Basic) an investment performance measurement metric developed from prospect theory (Kahneman and Tversky, 1979; Tversky and Kahneman, 1992) known as cumulative prospect theory certainty equivalent (CPTCE). The implementation of CPTCE makes up part of a more general performance measurement calculator which I wrote and is freely available online.2 It calculates mean return, standard deviation, skewness, kurtosis, beta, Jensen’s alpha, Sharpe ratio, Sortino ratio, Treynor’s measure, information ratio, Stutzer ratio, Omega, M2, T2and maximum drawdown, and is in use by the financial industry.
1.3. Research Methodology 21
1.3.3
Forecasting
The goals of the experiments on forecasting are to 1) improve standard algorithms, and 2) beat the ‘state of the art’. We have shown that forecasting financial markets is at best very difficult. Furthermore, if a simple algorithm were able to generate abnormal returns, the algorithm would be adopted by many market participants, and the pattern in the time series that the algorithm was exploiting would become eroded as traders attempted to enter the market ahead of each other, so the algorithm would cease being profitable. On the other hand, it seems unlikley that there exists a highly complex pattern in financial time series that is exploitable, because it would likley be swamped by noise. We are left with the task of seeking unknown patterns of intermediate complexity.
First domain knowledge gained via the runs test is used to build a DJIA trading system (Section 5.1). Although the algorithm is created ‘in sample’, given its simplicity and the size of the data set, significant overfitting of noise seems unlikely, so the equity curve is surprisingly impressive up until 2002, when the dynamics of the market must have changed. However, the algorithm clearly fails to outperform the market in the out of sample period.
For both theoretical and empirical reasons I then opt to use kernel methods for forecasting (Sec-tion 5.2). Detecting linear rela(Sec-tions has been the focus of much research in statistics and machine learn-ing for decades and the resultlearn-ing algorithms are well understood, well developed and efficient. However, linearity is rather special, and outside quantum mechanics no real system is truly linear (Meiss, 2003). Naturally, one wants the best of both worlds. So, if a problem is non-linear, instead of trying to fit a non-linear model, one can map the problem from theinput spaceto a new (higher-dimensional) space (called thefeature space) by doing a non-linear transformation using suitably chosen basis functions and then use a linear model in the feature space. This is known as the ‘kernel trick’. The linear model in the feature space corresponds to a non-linear model in the input space. This approach can be used in both classification and regression problems. The choice of kernel function is crucial for the success of all kernel algorithms because the kernel constitutes prior knowledge that is available about a task. Accordingly, there is no free lunch (see p. 47) in kernel choice. A formal treatment and the advantages of kernel methods is given on p. 84. Empirically, my review of the relevant literature (pp. 49–52) found that, on average, SVMs outperform ANNs when applied to the prediction of financial or commodity markets. Therefore, my approach focuses on kernel methods, the best known of which is the support vector machine (SVM).
Five implementations of kernel methods for classification are employed to forecast foreign ex-change data: a vanilla support vector machine (SVM) (used as a benchmark), a Bayes point machine (developed by Tom Minka), a Fisher kernel (introduced by Jaakkola and Haussler (1999) and named in honour of Sir Ronald Fisher), the DC (difference of convex functions) algorithm (as implemented by Ar-gyriou et al. (2006)), and the DC algorithm is used to learn the parameters of the hidden Markov model in the Fisher kernel. The five methods are compared with the genetic programming approach used in Neely et al. (1997) and reported in Neely et al. (2009) (NWD/NWU). The final four methods performed better than the vanilla SVM, but none better than NWD/NWU.
Furthermore, I ported two implementations of SVMs to Windows and also added semi-automated parameter selection. SVMdark3 is based on SVMlight (Joachims, 2004) and written in C for Win32, whilst winSVM4 is based on mySVM (R¨uping, 2000) and written in C++ for Win32. My Windows SVM software has been used by the financial industry.
1.4
Contributions to Science
This PhD thesis seeks to make contributions to science, yet computer science is an engineering discipline. How can we reconcile the two? Let us first attempt to definescienceexplicitly. Dictionary definitions in-form us that science is the systematic study of the universe—through observation and experiment—in the pursuit of knowledge that allows us to generalize. More formally, as I explained at a Young Statisticians’ Meeting in Cambridge, science is essentially Bayesian inference (Sewell, 2012b). This means that in its purest sense the application of science involves making assumptions, in the form of prior probabilities, gathering data and applying Bayes’ theorem. Machine learningis generally a practical approximation of Bayesian inference, justified because the techniques are simpler and good enough. In other wordsthe practical automation of science involves gathering data and applying a machine learning algorithm with
the correct ‘inductive bias’. The key to choosing an effective inductive bias is having domain knowledge. So, in order to successfully apply a machine learning algorithm to financial time series analysis, we need to understand the financial domain. The net result is amultidisciplinarythesis, with contributions made to both computer science and finance. The American computer scientist and software engineer Freder-ick Brooks recognised that science and engineering have a symbiotic relationship when he wrote ‘[t]he scientist builds in order to learn; the engineer learns in order to build’ (Brooks, 1987). I would add that the computer scientist working in machine learning learns in order to build in order to learn.
The central argument of the thesis is that one can improve upon the state of the art in financial time series analysis through the application of machine learning. The results of the work on the char-acterization, modelling and forecasting of financial time series each lend support to the central thesis. The characterization used existing literature plus statistics, the modelling used behavioural biases and multiagent systems, and the forecasting used supervised learning. The contributions made are listed below.
Experiment 1: Characterization
• I reconcile the apparent efficiency of markets according to linear statistical tests (e.g. auto-correlation) with the potential for non-linear forecasting methods to generate above-average risk-adjusted returns and identify the nature of the inefficiencies in the DJIA and foreign ex-change markets (Chapter 3). The runs test, that detects linear and non-linear relationships, identifies several previously undocumented anomalies: daily DJIA, USD/DEM, USD/JPY, GBP/USD, USD/CHF and GBP/CHF returns each exhibit a surprisingly high number of
3Available fromhttp://svmdark.martinsewell.com/. 4Available fromhttp://winsvm.martinsewell.com/.
1.4. Contributions to Science 23 sequences of decreasing returns.
• I wrote software for performing the runs test in Visual Basic for Excel (Section 3.3). I also wrote software for testing for long-memory, rescaled range analysis, in C++ and Visual Basic for Excel (Section 3.4). Neither algorithm was previously available for free as downloadable software including source code. The runs test source code is given in Appendix D and the rescaled range analysis source code is given in Appendix G.
Experiment 2: Modelling
• A novel investment performance measurement metric, cumulative prospect theory certainty equivalent (CPTCE), is developed from Tversky and Kahneman’s cumulative prospect the-ory. The statistic models investors’ empirically-observed risk preferences (people care about losses and gains rather than absolute wealth, evaluate probabilities incorrectly, are loss averse, risk averse for gains, risk seeking for losses and have non-linear preferences), whilst no other performance metric does this effectively. The financial industry have taken interest, with offers to commercialize the product. See Section 4.2.
• The evolved heuristics and biases exhibited by fundamental analysts and technical analysts, inducing underreaction and overreaction, are used to build an agent-based artificial stock market. The resultant time series replicates mean returns, the standard deviation of returns, the absolute returns correlation and the squared returns correlation of a real stock market, and provides a novel insight into the effect of the proportion of technical analysts relative to fundamental analysts. See Section 4.1.
Experiment 3: Forecasting
• Two Windows implementations of SVMs with semi-automated parameter selection are built. SVMdark is based on SVMlight and written in C for Win32, whilst winSVM is based on mySVM and written in C++ for Win32. For some time the programs were the only Win-dows applications dedicated to support vector machines, they were frequently downloaded and have been used by the financial industry. The source code is also freely available to download. See p. 87.
• A (generative) hidden Markov model is trained on market data to derive a Fisher kernel for a (discriminative) support vector machine, the DC algorithm and a Bayes point machine are also used to create kernels. Furthermore, the DC algorithm is used to learn the parameters of the hidden Markov model in the Fisher kernel, which is a novel combination of algorithms. All four algorithms performed better than the vanilla SVM in terms of gross returns, net returns and Sharpe ratio. See Chapter 5.
1.5
Chapters
1 Introduction The first chapter ‘sets the scene’. It includes the motivations for undertaking the re-search, the research objectives including the research question, the research methodology for the work on characterization, modelling and forecasting and the all important contributions to science. Finally, an annotated guide to the rest of the thesis is provided here.
2 Background and Literature Review The second chapter consists of a survey and critical assess-ment of other work and its relation to the research in this thesis. The literature in the following areas is reviewed: the EMH, dependence and long memory in market returns, investment newslet-ters, technical analysis, behavioural finance, multiagent systems, investment performance mea-surement, kernel methods and support vector machines with a particular focus on the application of SVMs to the financial domain.
3 Characterization The first of the three core chapters comprises five experiments. A test for au-tocorrelation and two versions of the runs test showed that daily DJIA, USD/DEM, USD/JPY, GBP/USD, USD/CHF and GBP/CHF returns each exhibit a surprisingly high number of sequences of decreasing returns. An implementation of Hurst’s rescaled range (R/S) analysis found little ev-idence of long memory in DJIA returns. The performance of investment newsletters is analysed, evidencing weak-form market efficiency.
4 Modelling The work on modelling utilizes behavioural finance. The evolved heuristics and biases exhibited by fundamental analysts and technical analysts, inducing underreaction and overreac-tion, are used to build an agent-based artificial stock market. The time series generated by the artificial market provides insight into the effect of technical analysts. A novel investment perfor-mance measurement metric, CPTCE, is developed from prospect theory (Kahneman and Tversky, 1979; Tversky and Kahneman, 1992).
5 Forecasting In the first experiment a daily DJIA trading system is built. Secondly, a hidden Markov model is trained on foreign exchange data to derive a Fisher kernel for an SVM, and the DC algorithm and Bayes point machine are also used to create kernels. Further, the DC algorithm was used to learn the parameters of the hidden Markov model in the Fisher kernel. Finally, an implementation of SVMs with semi-automated parameter selection is built.
6 Critical assessment of own work The hypothesis is stated; precision, thoroughness and the contri-butions are demonstrated, and a comparison with the closest rivals is given. The results of the work on the characterization, modelling and prediction of financial time series each lend support to the hypotheses and therefore to the central thesis.
7 Conclusion and Future Work The conclusion summarizes the thesis and highlights the contribu-tions made. Finally, potential ideas for further work in the field are addressed, including the ap-plication of machine learning to algorithmic trading, cointegration, deep learning, ensemble learn-ing, an equity trading system, funds of funds, global macro strategies, market-maklearn-ing, merger
1.5. Chapters 25 arbitrage, money management, option pricing, the order book, a particle filter and yield curve analysis.
27
Chapter 2
Background and Literature Review
This chapter is a survey and critical assessment of related work. Central to this thesis is the all-important efficient market hypothesis (EMH), which is covered in detail. The follow-ing sections cover the experiments undertaken in the three core chapters: characterization, modelling and forecasting. In the section on characterization markets and time series are introduced, stochastic processes in financial markets are covered, with the martingale given special attention. Stylized facts are introduced. Then the literature on dependence in mar-ket returns, long-memory in marmar-ket returns and investment newsletters is reviewed. In the section on modelling, the relevant literature on behavioural finance, technical analysis, mul-tiagent systems, prospect theory and investment performance measurement is covered. In the section on forecasting, the relevant literature on the no free lunch theorem for super-vised machine learning, data snooping, kernel methods, support vector machines (SVMs) and genetic programming is reviewed.
2.1
Introduction
This chapter is a survey and critical assessment of related work. First, the all-important efficient market hypothesis (EMH) is covered. The sections that follow are split according to the three main areas of time series analysis: characterization, modelling and forecasting. In the section on characterization markets and time series are introduced, stochastic processes in financial markets are covered with the martingale given special attention, stylized facts are introduced, then the literature on dependence in market returns, long-memory in market returns and investment newsletters is reviewed. In the section on modelling, the relevant literature on behavioural finance, technical analysis, multiagent systems, prospect theory and investment performance measurement is covered. In the section on forecasting, the relevant literature on the no free lunch theorem for supervised machine learning, data snooping, kernel methods, support vector machines (SVMs) and genetic programming is reviewed.
2.2
Efficient Market Hypothesis
The EMH has been the central proposition of finance since the early 1970s and is one of the most con-troversial and well-studied propositions in all the social sciences. As the Professor of Finance, Andrew Lo, puts it, ‘[i]t is disarmingly simple to state, has far-reaching consequences for academic pursuits and business practice, and yet is surprisingly resilient to empirical proof or refutation’ (Lo, 1997). The no-tion of an efficient market is central to this thesis because market efficiency (along with assumpno-tions about investors’ risk preferences) puts constraints on what is possible vis-`a-vis the characterization of financial markets. Conversely, the characterization of financial markets (again with assumptions about investors’ risk preferences) allows us to gauge the efficiency of financial markets. The EMH also has profound implications for the work on forecasting, as it places bounds on our expectations. There is little consensus between the opinions held in academia and industry. Unsurprisingly, most of the support for the EMH comes from the former. I host and run the world’s only website dedicated to the efficient market hypothesis.1
The random walk hypothesis was conceived in the 16th century as a model of games of chance. Bachelier (1900) modelled the path of stock prices as Brownian motion and showed that speculators should be unable to beat the market. Samuelson (1965) proved that properly anticipated prices fluctuate randomly, whilst Fama (1970) defined an efficient market as one in which prices always ‘fully reflect’ available information. However, Grossman and Stiglitz (1980) argued that because information is costly, a market price cannot perfectly reflect the information which is available, since if it did, those who spent resources to obtain the information would receive no compensation. A more detailed history of the EMH is given in Sewell (2011e).
To give a definition, a market is said to beefficientwith respect to an information set if the price fully reflects that information set (Fama, 1970), i.e. if the price would be unaffected by revealing the information set to all market participants (Malkiel, 1992). The efficient market hypothesis (EMH) asserts that financial markets are efficient.
A market is said to be efficient with respect to an information set, and the classic taxonomy of information sets, due to Roberts (1967) and published by Fama (1970), consists of the following:
weak form efficiency The information set includes only the history of prices.
semi-strong form efficiency The information set includes all information known to all market partici-pants (publicly available information).
strong form efficiency The information set includes all information known to any market participant (private information).
Note that the sets are nested, with each successive set being a superset of the preceding set. Later, the weak form was redefined by Fama (1991) to include variables like dividend yields and interest rates. This thesis only concerns itself with weak-form efficiency, the history of prices.
2.3. Characterization 29 How can we test to see whether a market is efficient? Strictly speaking market efficiency is not refutable. An efficient market will always ‘fully reflect’ available information, but in order to determine how the market should ‘fully reflect’ this information, it is necessary to determine investors’ risk prefer-ences. Therefore, any test of the EMH is a test of both market efficiency and investors’ risk preferprefer-ences. For this reason, the EMH, by itself, is not a well-defined and empirically refutable hypothesis. This ‘joint hypothesis problem’ was first pointed out by Fama (1970). However, if investors’ risk preferences are known, in theory, if not in practice, market efficiency can be tested. If information is revealed to market participants, the reaction of security prices can be measured. If and only if prices do not move when the information is revealed, the market is efficient with respect to that information set. See Campbell et al. (1996, pp. 21–22).
Are markets becoming increasingly efficient? Although only one paper published before 1960, Cowles and Jones (1937), found significant market inefficiencies; with decreasing transaction costs, an increasing number of market participants, increasing processing power and improving algorithms, one would expect markets to become increasingly efficient. The relative proportion of the papers summarized in Sewell (2011e) that reject the EMH peaked in the 1980s and 1990s, and Kim et al. (1991), Schwert (2003) and T´oth and Kert´esz (2006) suggest that markets are becoming increasingly efficient. It could be that markets in the 1980s and 1990s were less efficient because they were the decades of technological asymmetry: some market participants used microcomputers, whilst others did not. It could also be that it took until the 1980s/1990s for data to be of sufficient quality and quantity to reject market efficiency with any degree of confidence. Analyses post-2000 tend to support market efficiency simply because markets have become increasingly efficient. The Red Queen effect ensures that one’s ability to make money in the markets is dependent on the ability of the other market participants: the game is relative and moving.
So are financial markets efficient or not? Overall, just under half of the papers reviewed in Sewell (2011e) support market efficiency. Recall that a market is said to be efficient with respect to an informa-tion set if the price ‘fully reflects’ that informainforma-tion set (Fama, 1970). On the one hand, the definiinforma-tional ‘fully’ is an exacting requirement, suggesting that no real market could ever be efficient, implying that the EMH is almost certainly false. On the other hand, economics is a social science, and a hypothesis that is asymptotically true puts the EMH in contention for one of the strongest hypotheses in the whole of the social sciences. Strictly speaking the EMH is false, but in spirit is profoundly true. Besides, science concerns seeking the best hypothesis, and until a flawed hypothesis is replaced by a better hypothesis, criticism is of limited value.
2.3
Characterization
This section is a review of the literature relevant to the experiments conducted in Chapter 3 on the char-acterization of financial time series. The goal is to know as much as possible about the nature of financial time series, and the experiments are chosen to help us identify stylized facts, and to assess the degree to
which markets are efficient. It starts with notes on markets and time series, introduces stochastic pro-cesses in financial markets, identifies some stylized facts, reviews the literature on dependence and long memory in market returns, then concludes with a review of the literature on investment newsletters. For a more thorough review of the literature on the characterization of financial markets, see Sewell (2011b).
2.3.1
Markets
Whenever there are valuable commodities to be traded, there are incentives to develop a social arrange-ment that allows buyers and sellers to discover information and carry out a voluntary exchange more efficiently, i.e. develop a market. The largest and best organized markets in the world tend to be the securities markets.
2.3.2
Time Series
How do we get from financial transactions taking place, perhaps globally, to data that we can analyse on a computer? In a market, whenever buyers and sellers trade, it makes sense to record the agreed price at which the transaction took place. This price record creates a time series. There is ample literature on time series analysis, the fourth edition ofTime Series Analysis: Forecasting and Control(Box et al., 2008) is a revision of the classic 1970 book, Hamilton (1994)’s tome is the bible, whilst Weigend and Gershenfeld (1994) is the most relevant in terms of using advanced methods for time series prediction. For a time series glossary, see Appendix C (pp. 141–142). Note that it is the (natural)logarithmof the price of an asset that is of interest, because the price of a stock conforms to a lognormal distribution. Furthermore, it is thechangein price that is usually of interest, so we are normally concerned with log returns,lnPt/Pt−1.
2.3.3
Stochastic Processes in Financial Markets
How can we best represent the underlying process that generates market returns? The concept of ran-domness is central to finance and this is formalized by the mathematics of stochastic processes. A stochastic processis a collection of random variables, representing the evolution of random values over time. Table 2.1 (p. 31) gives a summary as to what extent the various random processes relate to finan-cial markets. A more formal treatment is given in Sewell (2006). In particular, an understanding of the concept of a martingale is necessary for a thorough understanding of what an efficient market does and does not imply about the process generating a market price under risk neutrality. In probability theory, amartingaleis a model of a fair game where no knowledge of past events can help to predict future winnings. In particular, a martingale is a sequence of random variables (i.e., a stochastic process) for which, at a particular time in the realized sequence, the expectation of the next value in the sequence is equal to the present observed value even given knowledge of all prior observed values.
2.3. Characterization 31
Table 2.1: Stochastic processes and their applicability to markets. It is thelogarithmof the price of an asset (Osborne, 1959) that is of interest.
Stochastic process Description Applicability to markets Notes diffusion process satisfies the diffusion equation
poor Regnault (1863) and Osborne (1959) discovered that price devia-tion is propordevia-tional to the square root of time, but the nonstadevia-tion- nonstation-arity found by Kendall (1953), Houthakker (1961) and Osborne (1962) compromises the significance of the process.
Gaussian process
increments normally distributed
poor Financial markets exhibit leptokurtosis (Mitchell, 1915, 1921; Olivier, 1926; Mills, 1927; Osborne, 1959; Larson, 1960; Alexan-der, 1961). For example, the kurtosis of daily returns of large cap stocks is of the order of 5 (Taylor, 2005, p. 53).
L´evy process
stationary independent increments
poor Kendall (1953), Houthakker (1961) and Osborne (1962) found nonstationarities in markets in the form of positive autocorrelation in the variance of returns.
Markov process
memoryless poor Kendall (1953), Houthakker (1961) and Osborne (1962) found pos-itive autocorrelation in the variance of returns.
martingale zero expected return
submartingale: good for stock market
Bachelier (1900) and Samuelson (1965) recognised the importance of the martingale in relation to an efficient market. Whilst Cox and Ross (1976), Lucas (1978) and Harrison and Kreps (1979) pointed out that in practice investors are risk averse, so (presumably as compensation for the time value of money and systematic risk) they demand a positive expected return. In a long-only market like a stock market this implies that the price of a stock follows a sub-martingale (a sub-martingale being a special case when investors are risk-neutral). random walk discrete version of Brownian motion
poor LeRoy (1973) and (especially) Lucas (1978) pointed out that a ran-dom walk is neither necessary nor sufficient for an efficient market.
Wiener process (Brownian motion) continuous-time, Gaussian independent increments
poor Bachelier (1900) developed the mathematics of Brownian motion and used it to model financial markets. Note that Brownian mo-tion is a diffusion process, a Gaussian process, a L´evy process, a Markov process and a martingale. On the one hand this makes it a very strong condition (and therefore the least realistic), on the other hand it makes it a very important ‘generic’ stochastic process and is therefore used extensively for modelling financial markets (for example, option pricing (Black and Scholes, 1973)).
2.3.4
Stylized Facts
The goal of the research on characterization is to list the so-called stylized facts applicable to financial markets. Astylized factis a term used in economics to refer to empirical findings that are so consistent (for example, across a wide range of instruments, markets and time periods) that they are accepted as truth. Due to their generality, they are often qualitative. From the literature reviewed below, and more generally from the literature reviewed in Sewell (2011b), we are able to characterize financial markets with the following stylized facts.
Dependence Autocorrelation in returns is largely insignificant, except at high frequencies when it be-comes negative.
Distribution Approximately symmetric, increasingly positive kurtosis as the time interval decreases and a power-law or Pareto-like tail.
Heterogeneity Non-stationary (clustered volatility).
Non-linearity Non-linearities in mean and (especially) variance.
Scaling Markets exhibit non-trivial scaling properties.
Volatility Volatility exhibits positive autocorrelation, long-range dependence of autocorrelation, scal-ing, has a non-stationary log-normal distribution and exhibits non-linearities.
Volume Distribution decays as a power law, also calendar effects.
Calendar effects Intraday effects exist, the weekend effect seems to have all but disappeared, intra-month effects have been found in most countries, the January effect has halved, and holiday effects exist in some countries.
Long memory About 50 per cent of the articles analysing market returns concluded that they exhibit long memory, and about 80 per cent of those analysing market volatility concluded that it exhibits long memory.
Chaos There is little evidence of low-dimensional chaos in financial markets.
Early claims made for stable distributions, long memory in returns and chaos theory turned out to be largely unfounded as higher-frequency data became available. This evidences the importance of a data-driven approach. Below I detail and summarise the literature on dependence and long memory in market returns.
2.3.5
Dependence in Market Returns
As discussed above, we wish to implement algorithms that identify (possibly non-linear) dependence in stock returns as this would have important implications regarding market efficiency and our ability to forecast. The first three experiments on the characterization of financial markets consist of a test
2.3. Characterization 33 for autocorrelation and two versions of the runs test (a non-parametric statistical test of the mutual dependence of the elements of a sequence) on a major US stock market index, so the relevant literature on the dependence of market returns is addressed here.
Fama (1970) found that 22 out of the 30 stocks of the DJIA exhibited positive daily serial corre-lation. Fama and French (1988) found that autocorrelations of stock return indices (they used portfo-lios) form a U-shaped pattern across increasing return horizons. The autocorrelations become negative for 2-year returns, reach minimum values for 3–5-year returns, and then move back towards zero for longer return horizons. Lo and MacKinlay (1988) found significant positive serial correlation for weekly and monthly holding-period index returns, but negative autocorrelations for individual securities with weekly data. Ball and Kothari (1989) found negative serial correlation in five-year stock returns. Lo and MacKinlay (1990a) found negative autocorrelation in the weekly returns of individual stocks, whilst weekly portfolio returns were strongly positively autocorrelated. Jegadeesh (1990) found highly signifi-cant negative serial correlation in monthly individual stock returns and strong positive serial correlation at twelve months. Brock et al. (1992) found positive autocorrelation in DJIA daily returns. Boudoukh et al. (1994) found that for small-firm indices, the spot index’s autocorrelation is significantly higher than that of the futures. Zhou (1996) found that high-frequency FX returns exhibit extremely high nega-tive first-order autocorrelation. Longin (1996) found posinega-tive autocorrelation for a daily index of stocks. Campbell et al. (1996) reported that the autocorrelation of weekly stock returns is weakly negative, whilst the autocorrelations of daily, weekly and monthly stock index returns are positive. Lo and MacKinlay (1999) found a positive autocorrelation for weekly holding-period market indices returns, but a random walk for monthly. They also found negative serial correlation for individual stocks with weekly data. Cont (2001) found negative autocorrelation on a tick-by-tick basis for both foreign exchange (USD/JPY) and a stock (KLM shares traded on the New York Stock Exchange (NYSE)). He also claims that weekly and monthly autocorrelations exist. The autocorrelation of 1 minute FX returns is negative (Dacorogna et al., 2001). Ahn et al. (2002) found that the daily autocorrelations of stock indices are nearly all posi-tive, whilst the daily autocorrelations of the corresponding futures contracts are close to zero. Lewellen (2002) found negative autocorrelation for stock portfolios after a year. Llorente et al. (2002) found that the first-order autocorrelation of daily returns is negative for stocks with large bid–ask spreads (-0.088) and small sizes (-0.076). It is positive but very small for large stocks (0.003) and stocks with small bid– ask spreads (0.01). Bianco and Ren`o (2006) found negative serial correlation in the returns of Italian stock index futures for periods smaller than 20 minutes. Cerrato and Sarantis (2006) looked at monthly data on black market exchange rates and found evidence of non-linear mean reversion in the real ex-change rates of developing and emerging market economies. Lim et al. (2008) examined ten Asian emerging stock markets and discovered that all the returns series exhibit non-linear serial dependence. Serletis and Rosenberg (2009) analysed daily data on four US stock market indices and concluded that US stock market returns display mean reversion. Anoruo and Gil-Alana (2011) analysed stock indices for ten African countries (daily data for four and monthly data for six) using fractionally integrated tech-niques and found no evidence of mean reversion in any of the markets. Lim et al. (2013) analysed the
DJIA, S&P 500 and NYSE Composite at the daily frequency from 1970 to 2008 using the automatic portmanteau BoxPierce test and the wild bootstrapped automatic variance ratio test, and found that those periods with significant return autocorrelations can largely be associated with major exogenous events. Anderson et al. (2013) found that NYSE-listed stock daily return correlations were predominantly pos-itive for the period 1993–2000 and predominantly negative for the period 2001–2008. DeMiguel et al. (2014) analysed the daily returns of various portfolios of US stocks between 1970 and 2011 and found that the autocorrelations decreased with time, becoming either zero or even negative after 2008, the year of the financial crisis.
In summary, weekly and monthly stock returns are weakly negatively correlated, whilst daily, weekly and monthly index returns are positively correlated. Campbell et al. (1996) (p. 74) point out that this somewhat paradoxical result can mean only one thing: large positive cross-autocorrelations across individual securities across time. High frequency market returns exhibit negative autocorrelation.
2.3.6
Long Memory in Market Returns
An efficient market should not possess any long memory, so implementing an efficient algorithm that tests for it is of great interest. The fourth experiment on the characterization of financial time series concerns testing for long memory in the returns of a financial market, so the relevant literature on the dependence of market returns is addressed here. In 1906, Harold Edwin Hurst, a young English civil servant, came to Cairo, Egypt, which was then under British rule. As a hydrological consultant, Hurst’s problem was to predict how much the Nile flooded from year to year. He developed a test for long-range dependence and found significant long-term correlations among fluctuations in the Nile’s outflows and described these correlations in terms of power laws. This statistic is known as therescaled range,range over standard deviationorR/S statistic. From 1951 to 1956, Hurst, then in his seventies, published a series of papers describing his findings (Hurst, 1951). Mandelbrot (1971) showed that if asset returns display long memory, then the impact of new market information can not be perfectly arbitraged away and thus an efficient market becomes impossible. Mandelbrot (1972) appliedR/Sanalysis to financial returns. Greene and Fielitz (1977) claimed that many daily stock return series are characterized by long-term dependence. Aydogan and Booth (1988) concluded that there was no significant evidence for long-term memory in common stock returns.
Lo (1991) modified theR/Sstatistic to ensure that it is robust to short-range dependence and found little evidence of long-term memory in historical US stock market returns. Cheung (1993) found evi-dence of long memory in foreign exchange rates. Goetzmann (1993) considered three centuries of stock market prices.R/Stests provided some evidence that the detrended London Stock Exchange and NYSE prices may exhibit long-term memory. Cheung and Lai (1993) examined the long memory behaviour in gold returns during the post-Bretton Woods period and found that the long memory behaviour in gold returns is rather unstable. They concluded, ‘[w]hen only few observations corresponding to major po-litical events in the Middle East, together with the Hunts event, in late 1979 are omitted, little evidence
2.3. Characterization 35 of long memory can be found.’ Mills (1993) found little evidence of long memory in daily UK stock returns. Embrechts (1994) claims that the Hurst coefficient for JPY/USD returns indicates a memory effect. Embrechts et al. (1994) applied rescaled range analysis to US Fed Fund rates, US Treasury notes, CHF/USD exchange rates and the Japanese stock market (TOPIX) and claimed that it shows that most fi-nancial markets follow a biased random walk. Bhar (1994) tested for long-term memory in the JPY/USD exchange rate using Lo’s methodology and found no evidence of long-term memory. Moody and Wu (1995) performed rescaled range and Hurst exponent analysis on tick-by-tick interbank foreign exchange rates, and found that they are mean-reverting. Nawrocki (1995) considered the CRSP monthly value-weighted index and the S&P 500 daily index, and found that the Hurst exponent and the Lo-modified R/Sstatistic indicate that there is persistent finite memory. Tschernig (1995) found evidence for weak long memory in the changes of DEM/USD spot rates and the CHF/USD spot rates; in contrast, there was no evidence for long memory in the DEM/CHF spot rate changes. Chow et al. (1996) found evi-dence that consistently revealed the absence of long-term depenevi-dence in 22 international equity market indices. Moody and Wu (1996) improve Lo’sR/Sstatistic and conclude that the DEM/USD series is mildly trending on time scales of 10 to 100 ticks. Peters (1996) appliedR/Sanalysis and concluded that most of the capital markets are characterized by long memory processes. Lux (1996) analysed German stock market data and found no evidence for (positive or negative) long-term dependence in the returns series. Barkoulas and Baum (1996) applied the spectral regression method and found no evidence of long memory in either aggregate or sectoral stock indices, but evidence of long memory in 5, intermediate memory in 3 and no fractal structure in 22 of the 30 DJIA companies. Their overall findings did not offer convincing evidence against the martingale model. Using the spectral regression method, Barkoulas and Baum (1997) found significant evidence of long memory in the 3- and 6-month returns (yield changes) on Eurocurrency deposits denominated by JPY (Euroyen). Hiemstra and Jones (1997) applied the mod-ified rescaled range test to the return series of 1,952 common stocks and their results indicated that long memory is not a widespread characteristic of those stocks. Lobato and Savin (1998) found no evidence of long memory in daily stock returns. Willinger et al. (1999) found empirical evidence of long-range dependence in stock price returns, but the evidence was not absolutely conclusive. Huang and Yang (1999) applied the modifiedR/Stechnique to intraday data and found long-term memory in both NYSE and NASDAQ indices. Baum et al. (1999) reject the hypothesis of long memory in real exchange rates in the post-Bretton Woods era.
Using the spectral regression method, Barkoulas et al. (2000) found significant and robust evidence of positive long-term persistence in the Greek stock market. Chen (2000) calculated Hurst’s classical rescaled range statistic for seven Asia-Pacific countries’ stock indices and concluded that all the index returns have long memory. Crato and Ray (2000) found no evidence for long memory in futures’ re-turns. Weron and Przybyłowicz (2000) found that electricity price returns are strongly mean-reverting. Zhuang et al. (2000) investigated British stock returns and found little or no evidence of long-range de-pendence. Sadique and Silvapulle (2001) examined the presence of long memory in the weekly stock returns of seven countries, namely Japan, Korea, New Zealand, Malaysia, Singapore, the US and