Biased support vector machine and weighted-SMOTE
in handling class imbalance problem
Hartono a,1,*, Opim Salim Sitompul b,2, Tulus b,3, Erna Budhiarti Nababan b,4
a STMIK IBBI, Jl. Sei Deli No. 18, Medan 20114, Indonesia
b Universitas Sumatera Utara, Jl. Dr. T. Mansyur No. 9, Medan 20155, Indonesia 1[email protected]; 2 [email protected]; 3 [email protected]; 4 [email protected] * corresponding author
1.
Introduction
Class imbalance problem occurs when classification results shows a class with much larger instances than the others. This raises an issue of majority versus minority [1]. Class imbalance can emerge if the size of dataset is considerably immense with high imbalance ratio [2]. Most of the traditional machine learning techniques deal with reasonably balanced class distributions in solving classification problems
[3,4]. Class imbalance is major problem in machine learning, can affect prediction accuracy. Machine learning will provide more accurate predicted results for classes with larger number of instances, and the resulting accuracy will be lowered in the class with small number of instances [5]. This problem also increases the number of misclassification in machine learning [6]. In general, there are three approaches for solving class imbalance problems. First approach is Data-Level Solutions, second is Algorithm-Level Solutions, and last Cost-Sensitive Solutions [7]. The problem of class imbalance can be divided into two scenarios: binary and multi-class [8].
The representativeness of the sample problem is important due to three things: it must have a reduced size compared to the original source, contain the main information in the source, and low redundancy [9]. SVM is robust and precise, but can be sensitive to missing values and difficult to train for larger and highly imbalanced datasets. To train large-scale data, it must be combined with another approach in Data Level-Solutions [10]. A widely used method is Synthetic Minority Over-sampling Technique (SMOTE) method [11]. SMOTE will irregularly initiate synthetic minority object to stabilize number of instances in the minority and majority classes [12]. To control the sensitivity in Support Vector Machine, Veropoulos et al. [13] introduced Biased Support Vector Machine. Biased Support Vector Machine combined with SMOTE by Jian et al. [14] to handle class imbalance problem.
A R T I C L E I N F O A B S T R A C T
Article history
Received December 27, 2017 Revised February 9, 2018 Accepted March 9, 2018
Class imbalance occurs when instances in a class are much higher than in other classes. This machine learning major problem can affect the predicted accuracy. Support Vector Machine (SVM) is robust and precise method in handling class imbalance problem but weak in the bias data distribution, Biased Support Vector Machine (BSVM) became popular choice to solve the problem. BSVM provide better control sensitivity yet lack accuracy compared to general SVM. This study proposes the integration of BSVM and SMOTEBoost to handle class imbalance problem. Non Support Vector (NSV) sets from negative samples and Support Vector (SV) sets from positive samples will undergo a Weighted-SMOTE process. The results indicate that implementation of Biased Support Vector Machine and Weighted-SMOTE achieve better accuracy and sensitivity.
This is an open access article under the CC–BY-SA license.
Keywords Class Imbalance
Biased Support Vector Machine Weighted-SMOTE
Accuracy Sensitivity
The SMOTE method will generally initialize a sample number of minorities and after that it will generate equal numbers of synthetic data, but this method should consider all the remaining minority data samples [15]. A Weighted-SMOTE proposed by Prusty et al. [15] will oversampling each minority data sample and carried out based on the weight assigned to it. These weights are determined by using the Euclidean distance of a particular minority data sample with consideration to all remaining minority data samples.
This paper introduced the implementation of Biased Support Vector Machine and Weighted-SMOTE in Handling Class Imbalance Problem. Biased Support Vector Machine will give better sensitivity control compare to Support Vector Machine. Biased Support Vector Machine works by providing different cost functions for positive samples (minority class) and negative samples (majority class) will group both positive samples and negative samples into Support Vector (SV) Sets and Non Support Vector (NSV) Sets.
Biased Support Vector Machine has been combined with SMOTEBoost in handling class imbalance problem to get the better accuracy. SMOTEBoost should consider all the minority data samples and for this reason, Weighted-SMOTE has been introduced. NSV Sets from negative samples and SV Sets from Positive Samples will then undergo a Weighted-SMOTE process. The traditional performance evaluation in imbalanced evaluation are accuracy and sensitivity [5].
On condition high imbalance ratio of 99%, which minority (positive) classes have only 1% instances as well as error rates may be reduced by learning algorithm through classifying all instances into majority class, until the result give a 1% error rate. Nonetheless, in data mining work, minority (positive) class usually a focus [7] and in case of class imbalance, minority classes frequently grow into the more important class [16]. To be able to recognize unusual behavior differs from the general access patterns, the focus would be placed on the positive class and Biased Support Vector Machine (BSVM) became popular choice to solve the problem. The purpose of this research is to get a better sensitivity and accuracy using the implementation of BSVM and Weighted-SMOTE in handling class imbalance problem.
2.
Method
2.1.Biased Support Vector Machine and Weighted-SMOTE Algorithm
Traditional Support Vector Machine (SVM) cannot handling class imbalance problem with significant bias in data distribution. It is because the separation hyperplane learned by the SVM very close to the minority class which explains why SVM has a degrading performance on highly imbalanced datasets [17]. A Geometric Mean SVM (GSVM) proposed by Gonzalez-Abril et al. [18] will get the ideal hyperplane by calculating the moving of the original bias in the SVM to improve the geometric mean between the true positive rate and the true negative rate. However, in some problem, focus of interest was given to the positive class since it may contain unusual behavior differs from the general access pattern and to deal with datasets where one class, the positive class, is considered more relevant than another class in binary classification problems, the Biased Support Vector Machine (BSVM) method
[13] can be considered.
BSVM designed for cases when it is non-critical to increase the true positive ratio in exchange for an increase in the false positive rate [19]. BSVM achieve better performance in sensitivity, but have a significant reduction in accuracy [19]. To overcome this issue, integration with Weighted-Smote Algorithm can be made. Biased Support Vector Machine combined with SMOTEBoost to handle class imbalance problem [14] but this method should consider all remaining minority data samples [15] and this is the reason why Weighted-SMOTE has an advantage to use in this research.
In Biased Support Vector Machine, minority samples are given with a larger cost function and the mathematical model of Biased Support Vector Machine is defined by (1) [13].
𝑚𝑖𝑛1 2|𝑤| 2+ 𝐶+∑ 𝜉 𝑖𝑘+ 𝐶−∑𝑖∈𝐼−𝜉𝑖𝑘 𝑖∈𝐼+ 𝑠. 𝑡. 𝑦𝑖(𝑤𝑇𝜙(𝑥𝑖) + 𝑏) ≥ 1 − 𝜉𝑖 𝜉𝑖≥ 0, ∀𝑖
Where w and b represent the normal vector and the intercept of hyperplane, respectively 𝜉𝑖 ≥ 0 are
slack variable. The detailed procedure of Biased Support Vector Machine and Weighted-SMOTE Algorithm in handling class imbalance is as follows.
Step 1, Take some data from minority class and majority class. Some data from the minority class are expressed as positive samples and some data from the majority class is expressed as negative samples. Step 2, Determine the hyperplane combination of positive samples and negative samples. Where the combined value of positive samples is 1 and the combined value of negative samples is -1.
Step 3, Minimise the margin value of positive samples and negative samples to obtain Hyperplane using Biased Support Vector Machine which is done using equation (2) and (3) [14].
)
(
2
1
2
1
2 4 2 3 2 2 2 1 2w
w
w
w
W
s.t.N
i
b
x
w
y
i(
i i
)
1
,
1
,
2
,
3
,
,
(3) 1 ) . . . . (w1x1w2 x2w3 x3w4 x4b yiStep 4, Determine Positive Samples and Negative Samples using (4) [14].
y
w
x
b
sign
x
f
l i i i
(
.
)
)
(
1 If the sign function gives a result greater than 0 then it is included in the minority class and if the sign function gives a result smaller than 0 then it is included in the majority class. Conduct training for minority class and majority class based on hyperplane equation obtained. The training process can be done using (4)
Step 5, Obtain positive result for minority class and negative result for majority class. If the training result for an instance in the minority class gives a negative result then move the instance into the majority class and if the training result for an instance in the majority class gives a positive result then move that instance into the minority class.
Step 6, Take some data back from the minority class and make it as positive samples and retrieve some data back from majority class and make it as negative samples. Determine the hyperplane of each positive samples and negative samples using (2) and (3).
Step 7, Perform training process on minority class using (5). For the process of determining SV Sets and NSV Sets by using hyperplane from positive samples. If the calculation result gives 1 then it is categorized into SV Sets and otherwise categorized as NSV Sets.
𝐻1= 𝑆𝑉 𝑆𝑒𝑡𝑠 𝑓𝑜𝑟 𝑀𝑖𝑛𝑜𝑟𝑖𝑡𝑦 𝐶𝑙𝑎𝑠𝑠 (𝑤. 𝑥 + 𝑏 = 1)
Step 8, Do the training process on majority class using (6). For the process of determining SV Sets
and NSV Sets by using hyperplane of negative samples. If the calculation result gives -1 then it is
categorized into SV Sets and otherwise categorized as NSV Sets.
Step 9, SV Eliminate noise using Sets on the Minority Class and then process the Weighted-SMOTE to be combined with NSV Sets on the minority class to become a new minority class. The Weighted-SMOTE process is as follows [15]:
(1) Calculate Euclidean Distance for each of T minority data samples using (7) [20].
𝑑𝑖𝑗 = √∑ (𝑥𝑖𝑘− 𝑥𝑗𝑘)2 𝑝
𝑘=1
Here, i = [1,2, . . . . , 𝑇] and 𝑗 = [1,2, . . . , 𝑇] and 𝑗 ≠ 1. Euclidean Distance for all the minority data are calculated and stored in a column matrix using (8) [10].
𝐸𝐷 = [𝐸𝐷1, 𝐸𝐷2, . . . , 𝐸𝐷𝑇] (8)
(2) Normalized ED matrix using maximum of the ED (𝐸𝐷𝑚𝑎𝑥) and minimum of ED (𝐸𝐷𝑚𝑖𝑛) then
called it as normalized ED (NED) that can be seen in (9).
𝑁𝐸𝐷𝑖=
𝐸𝐷𝑖−𝐸𝐷𝑚𝑖𝑛
𝐸𝐷𝑚𝑎𝑥−𝐸𝐷𝑚𝑖𝑛
(9)
(3) Convert NED matrix using (10) to get the Remodeled Normalized Euclidean Distance Matrix (RNED).
[𝑅𝑁𝐸𝐷]𝑇𝑥1= 𝑠𝑢𝑚(𝑁𝐸𝐷) − [𝑁𝐸𝐷]𝑇𝑥1 (10)
(4) Calculated Weight Matrix for each minority of T samples considering the sum of RNED Matrix using (11).
[𝑊𝑒𝑖𝑔ℎ𝑡 𝑀𝑎𝑡𝑟𝑖𝑥]𝑇𝑥1=
[𝑅𝑁𝐸𝐷]𝑇𝑥1
𝑠𝑢𝑚(𝑅𝑁𝐸𝐷) (11)
(5) Using this Weight matrix to find the SMOTE generation matrix using (12).
[𝑆𝑀𝑂𝑇𝐸 𝐺𝑒𝑛𝑒𝑟𝑎𝑡𝑖𝑜𝑛 𝑀𝑎𝑡𝑟𝑖𝑥]𝑇𝑥1= 𝑁𝑥𝑇
100[𝑊𝑒𝑖𝑔ℎ𝑡 𝑀𝑎𝑡𝑟𝑖𝑥]𝑇𝑥1 (12)
Step 10, NSV Sets on Majority Class go through Weighted-SMOTE process and combined with SV
Sets on Majority Class to become a new majority class. The Weighted-SMOTE process is similar with
Step 9.
2.2.Research Design
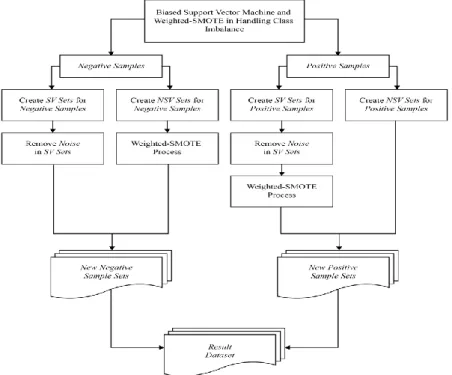
The experiments conducted using Iris Dataset and Balanced Scale Weight & Distance Database using software deployed in R Language. Research Method can be seen in Fig. 1.
This research calculates the Accuracy and Sensitivity from the result of implementation of Biased Support Vector Machine and Weighted-SMOTE using (13) [15] and (14) [13].
𝐴𝑐𝑐𝑢𝑟𝑎𝑐𝑦 = 𝑇𝑁+𝑇𝑃
𝑇𝑁+𝐹𝑃+𝐹𝑁+𝑇𝑃 (13)
𝑆𝑒𝑛𝑠𝑖𝑡𝑖𝑣𝑖𝑡𝑦 = 𝑇𝑃
𝑇𝑃+𝐹𝑁 (14)
Confusion Matrix [13] is used for determining the value of TN, TP, FN, and FP which can be seen in Table 1.
Table 1. Confusion Matrix
Classified as Positive Classified as Negative
Positive Samples True Positive (TP) False Negative (FN)
From the Fig. 1, shows that Biased Support Vector Machine will classify both majority class (negative samples) and minority class (positive samples) into Support Vector Sets (SV Sets) and Non Support Vector Sets (NSV Sets). Noise from SV Sets Negative Samples removed and the NSV Sets Negative Samples processed using Weighted-SMOTE. Then SV Sets Negative Samples combined with NSV Sets Negative Samples, generating a new Negative Samples Sets. After this process, noise from the SV Sets in Positive Samples removed and this SV Sets processed using Weighted-SMOTE. Then SV Sets Positive Samples combined with NSV Sets Positive Samples, generating a new Positive Samples Sets. New Negative Sample Sets and New Positive Sample Sets combined to make Result Dataset.
Fig. 1. Research Method
3.
Results and Discussion
Testing conducted using Iris Dataset and Balanced Scale Weight & Distance Database using software deployed in R Language. Result of the testing using Iris Dataset can be seen in Table 2.
Table 2. Result of Testing using Iris Dataset
Iteration
Before Processing After Processing
Accuracy Sensitivity Number of Majority Number of Minority Number of Majority Number of Minority 1 60 40 52 48 0.87 0.83 2 60 34 49 45 0.81 0.79 3 62 39 52 49 0.82 0.79 4 64 36 50 50 0.902 0.904 5 55 44 50 49 0.93 0.92 6 71 29 50 50 0.84 0.83 7 66 30 50 46 0.93 0.92 8 62 37 50 49 0.89 0.88 9 67 35 54 48 0.94 0.93 10 65 35 52 48 0.89 0.88 Average 63.2 35.9 50.9 48.2 0.88 0.87
Based on Table 2 it can be seen that from the 10 experiments it was found that Biased Support Vector Machine and Weighted-SMOTE can decrease the difference in the number of members between majority and minority class. This can be done because Biased Support Vector Machine and Weighted-SMOTE can improve classification accuracy. Better accuracy impacts the misclassification on the lower
majority and minority classes. In general, class imbalance issues will arise if there is misclassification of the placement of instances in the minority class to be placed in the majority class.
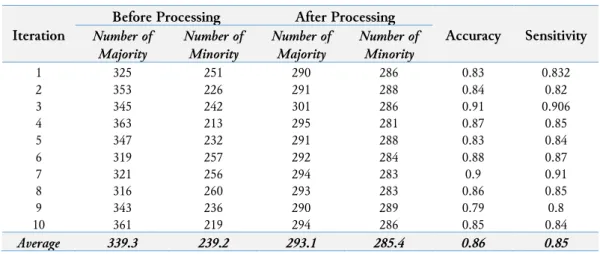
Result of testing using Balanced Scale Weight & Distance Database can be seen in Table 3. Similar results were obtained in experiments using the Balance Scale Weight & Distance Database which can be seen in Table 3. The results show that the Biased Support Vector Machine and Weighted-SMOTE can also correct the difference in the number of majority and minority that can be seen on the results before and after processing. This confirms that an increase in classification accuracy can provide an advantage in overcoming class imbalance problems.
Table 3. Result of Testing using Balanced Scale Weight & Distance Database
Iteration
Before Processing After Processing
Accuracy Sensitivity Number of Majority Number of Minority Number of Majority Number of Minority 1 325 251 290 286 0.83 0.832 2 353 226 291 288 0.84 0.82 3 345 242 301 286 0.91 0.906 4 363 213 295 281 0.87 0.85 5 347 232 291 288 0.83 0.84 6 319 257 292 284 0.88 0.87 7 321 256 294 283 0.9 0.91 8 316 260 293 283 0.86 0.85 9 343 236 290 289 0.79 0.8 10 361 219 294 286 0.85 0.84 Average 339.3 239.2 293.1 285.4 0.86 0.85
From Table 2 and Table 3, there is an improvement in the differentiation on number of majority and number of minority before and after processing with Biased Support Vector Machine and Weighted-SMOTE. The accuracy and sensitivity is satisfying. The high value of accuracy and sensitivity means that the implementation of Biased Support Vector Machine and Weighted-SMOTE can handle the class imbalance problem. The results also show that if focus will be given to positive samples or minority classes then Biased Support Vector Machine and Weighted-SMOTE can be considered.
4.
Conclusion
The study implemented Biased Support Vector Machine and Weighted-SMOTE in handling class imbalance problem. Experiments of two datasets showed the satisfactory result that indicated in value of the accuracy and sensitivity with the average accuracy was 0.87 and average sensitivity was 0.86. From the study, it can be conclude that implementation of BSV and Weighted-SMOTE can handle class imbalance problem with the positive class in a higher priority. The proposed methods give the satisfactory result in accuracy and sensitivity.
Acknowledgment
This work was supported by the Grant of Ministry of Research, Technology, and Higher Education (RistekDikti) of the Republic of Indonesia.
References
[1] S. M. A. Elrahman and A. Abraham, “A Review of Class Imbalance Problem,” J. Netw. Innov. Comput., vol. 1, pp. 332–340, 2013, available at: http://ias04.softcomputing.net/jnic2.pdf.
[2] S. Maldonado and J. López, “Dealing with high-dimensional class-imbalanced datasets: embedded feature selection for SVM classification,” Appl. Soft Comput., Vol. 67, pp. 94-105, Jun. 2018, doi:
https://doi.org/10.1016/j.asoc.2018.02.051.
[3] J. Ortigosa-Hernández, I. Inza, and J. A. Lozano, “Measuring the class-imbalance extent of multi-class problems,” Pattern Recognit. Lett., vol. 98, pp. 32–38, 2017, doi:
[4] O. Loyola-González, J. F. Martínez-Trinidad, J. A. Carrasco-Ochoa, and M. García-Borroto, “Effect of class imbalance on quality measures for contrast patterns: An experimental study,” Inf. Sci., vol. 374, pp. 179– 192, Dec. 2016, doi: https://doi.org/10.1016/j.ins.2016.09.040.
[5] M. Galar, A. Fernandez, E. Barrenechea, H. Bustince, and F. Herrera, “A Review on Ensembles for the Class Imbalance Problem: Bagging-, Boosting-, and Hybrid-Based Approaches,” IEEE Trans. Syst. Man Cybern. Part C Appl. Rev., vol. 42, no. 4, pp. 463–484, Jul. 2012, doi:
https://doi.org/10.1109/TSMCC.2011.2161285.
[6] Hartono, O. S. Sitompul, Tulus, and E. B. Nababan, “Optimization Model of K-Means Clustering Using Artificial Neural Networks to Handle Class Imbalance Problem,” IOP Conf. Ser. Mater. Sci. Eng., vol. 288, p. 012075, Jan. 2018, doi: https://doi.org/10.1088/1757-899X/288/1/012075.
[7] W.-C. Lin, C.-F. Tsai, Y.-H. Hu, and J.-S. Jhang, “Clustering-based undersampling in class-imbalanced data,” Inf. Sci., vol. 409–410, pp. 17–26, Oct. 2017, doi: https://doi.org/10.1016/j.ins.2017.05.008 . [8] J. A. Sáez, B. Krawczyk, and M. Woźniak, “Analyzing the oversampling of different classes and types of
examples in multi-class imbalanced datasets,” Pattern Recognit., vol. 57, pp. 164–178, Sep. 2016, doi:
https://doi.org/10.1016/j.patcog.2016.03.012.
[9] D. Furundzic, S. Stankovic, S. Jovicic, S. Punisic, and M. Subotic, “Distance based resampling of imbalanced classes: With an application example of speech quality assessment,” Eng. Appl. Artif. Intell., vol. 64, pp. 440– 461, Sep. 2017, doi: https://doi.org/10.1016/j.engappai.2017.07.001.
[10] G. Haixiang, L. Yijing, J. Shang, G. Mingyun, H. Yuanyue, and G. Bing, “Learning from Class-Imbalanced Data: Review of Methods and Applications,” Expert Syst. Appl., vol. 73, pp. 220–239, May 2017, doi:
https://doi.org/10.1016/j.eswa.2016.12.035.
[11] L. Zhang, C. Zhang, R. Gao, R. Yang, and Q. Song, “Using the SMOTE technique and hybrid features to predict the types of ion channel-targeted conotoxins,” J. Theor. Biol., vol. 403, pp. 75–84, 2016, doi:
https://doi.org/10.1016/j.jtbi.2016.04.034.
[12] X. Yuan, L. Xie, and M. Abouelenien, “A regularized ensemble framework of deep learning for cancer detection from multi-class, imbalanced training data,” Pattern Recognit., vol. 77, pp. 160–172, May 2018, doi: https://doi.org/10.1016/j.patcog.2017.12.017.
[13] K. Veropoulos, C. Campbell, and N. Cristianini, “Controlling the Sensitivity of Support Vector Machines,” presented at the International Joint Conference on AI, 1999, pp. 55–60, available at:
http://seis.bris.ac.uk/~enicgc/pubs/1999/ijcai_ss.pdf.
[14] C. Jian, J. Gao, and Y. Ao, “A new sampling method for classifying imbalanced data based on support vector machine ensemble,” Neurocomputing, vol. 193, pp. 115–122, Jun. 2016, doi:
https://doi.org/10.1016/j.neucom.2016.02.006.
[15] M. R. Prusty, T. Jayanthi, and K. Velusamy, “Weighted-SMOTE: A Modification to SMOTE for Event Classification in Sodium Cooled Fast Reactors,” Prog. Nucl. Energy, vol. 100, pp. 355–364, 2017, doi:
https://doi.org/10.1016/j.pnucene.2017.07.015.
[16] M. Gao, X. Hong, S. Chen, and C. J. Harris, “A combined SMOTE and PSO based RBF classifier for two-class imbalanced problems,” Neurocomputing, vol. 74, no. 17, pp. 3456–3466, Oct. 2011, doi:
https://doi.org/10.1016/j.neucom.2011.06.010.
[17] H. He and A. Ghodsi, “Rare class classification by support vector machine,” in Pattern Recognition (ICPR), 2010 20th International Conference on, 2010, pp. 548–551, doi: https://doi.org/10.1109/ICPR.2010.139. [18] L. Gonzalez-Abril, H. Nuñez, C. Angulo, and F. Velasco, “GSVM: An SVM for handling imbalanced
accuracy between classes inbi-classification problems,” Appl. Soft Comput., vol. 17, pp. 23–31, Apr. 2014, doi: https://doi.org/10.1016/j.asoc.2013.12.013.
[19] L. Gonzalez-Abril, C. Angulo, H. Nuñez, and Y. Leal, “Handling binary classification problems with a priority class by using Support Vector Machines,” Appl. Soft Comput., vol. 61, pp. 661–669, Dec. 2017, doi:
https://doi.org/10.1016/j.asoc.2017.08.023.
[20] R. Loohach and K. Garg, “Effect of Distance Functions on K-Means Clustering Algorithm,” Int. J. Comput. Appl., vol. 49, no. 6, pp. 7–9, 2012, doi: https://doi.org/10.5120/7629-0698.