Using Code Coverage Tools in the Linux Kernel
Nigel Hinds
Paul Larson
Hubertus Franke
Marty Ridgeway
{ nhinds, plars, frankeh, mridge}@ us.ibm.com
Defining software reliability is hard enough, let alone ensuring it. However, most all software developers agree on the importance of testing. The often unspoken assumption with testing is that the test programs
covera majority of the source code written. A test covers a line of code if running the test executes the line.
Coverage analysis measures how much of the target code is run during a test and is a useful mechanism for evaluating the effectiveness of a system test or benchmark.
The GNU development tool gcov allows developers to obtain coverage results for programs compiled with the GNU gcc compiler.
In this article, we learn how to instrument the Linuxr kernel to generate code coverage data, and how to visualize results with tools from the Linux Test Project (LTP) [4].
1
Coverage Basics
Code coverage analysis is the process that allows us to determine the percentage of code within an appli-cation that was executed during the test process. The data gathered by using coverage analysis can be used to measure and improve the test process [6]. Coverage analysis can be performed in a variety of ways for producing different views of how a test process executes the code. A few types of coverage analysis are discussed here.
The first and most basic type of coverage analysis is usually called statement coverage analysis [1]. Statement coverage analysis breaks the code down into basic blocks. Basic blocks are the sections of code that exist between branches. Since these basic blocks do not cross branches, we can know that if any instruction in a basic block is executed, then every instruction within the basic block is executed the same number of times. Instrumenting basic blocks with counters provides a more efficient way of showing how many times each line of code in a program has been executed, without having to instrument every line.
Statement coverage analysis is what most people generally think of when they think of code coverage analysis, but it isn’t flawless on its own. The following example shows one way it can fail:
int *iptr = NULL; if(conditional)
iptr = &i; *iptr = j*10;
The example above will work fine when every line is executed (100% coverage). However, if the condi-tional is ever false, iptrwill be null when dereferenced, exposing the bug. With statement coverage, one must know that 100% code coverage in a test process may not necessarily imply that the application is well tested.
Another type of coverage analysis is called branch coverage analysis [5]. Instead of generating data about how many times each line or basic block is executed, branch coverage looks at the branches between basic blocks. Branch coverage analyzes each branch to determine the possible paths through it and produces data to show which paths were taken and how often. As an added bonus, by knowing which branches were taken, statement coverage data can be derived. In the example above, branch coverage would have clearly shown that one possible branch (conditional failed) was never tested, exposing a hole in the test process.
A more sophisticated form of branch coverage also exists that handles complex conditionals. Many conditionals involve more than a single test that will pass or fail. Some conditionals involve complex logic that requires testing through all combinations. The better form of branch coverage analysis will correctly handle situations like the following example:
struct somestructure* p = NULL;
if(i == 0 || (j == 1 && p->j == 10)) printf("got here\n");
If iis ever non-zero when j is 1, then the NULL pointerpwill be dereferenced in the last part of the conditional. There are paths through this branch in both the positive and negative case that will never expose the potential segmentation fault if the conditional is only analyzed as a single pass or fail statement.
1.1
GCOV
Although there are many other types of coverage for dealing with a variety of corner cases, gcov only provides statement and branch coverage. In order to get coverage data, programs must be compiled by gcc with the -fprofile-arcs and -ftest-coverage flags. These options cause the compiler to insert additional instructions into the generated object code. This new code increments counters which identify sections of the code being executed. When the program is run these counters are incremented when the specific portions of the code are executed. When the program terminates the counters are dumped to a file. During the postmortem, the actual gcov program is used to process the counter file just created.
Unfortunately, until now gcov did not work on kernel code for two primary reasons. Although kernel files can be instrumented with gcc, the kernel never links with the system libraries that provide support
functions for gcov. Additionally, since the kernel never exits, counter data would never be generated. Getting coverage data from dynamic modules was another obstacle to kernel coverage.
In early 2002, the LTP team published a patch to the Linux kernel that addresses these issues and allowed developers to use the existing gcov tools to get coverage data from a running kernel [2]. A detailed description of the functionality provided by the patch can be found in our Ottawa Linux Symposium paper [3].
2
Using Coverage Tools
Once a program has terminated and the gcov counter data (.dafiles) exist, gcov is capable of analyzing the files and producing coverage output. To see the coverage data for a user space program, one may simply rungcov program.cwhereprogram.cis the source file. The.dafile must also exist in the same directory.
The raw output from gcov is useful, but not very readable or organized for viewing source trees. The lcov toolkit produces a far more user friendly and organized output. lcov automates the process of extracting the coverage data using gcov and producing HTML results based on that data [4].
To produce coverage data with lcov, first download the gcov-kernel and lcov tools from the LTP website at ltp.sourceforge.net.
Apply the gcov-kernel patch to a test kernel.
patch -p1< gcov-<kernel version>.patch
General kernel configuration and compiling instruction is beyond the scope of this article. But, to enable gcov on the entire kernel, verify that theGCOV kernel profilerconfiguration option is selected. The gcov-kernel README file provides details on how to gcov enable portions of the kernel. After compiling and installing the gcov-kernel, download and install the lcov toolkit. The lcov toolkit provides options for manipulating gcov data.
lcov provides scripts to clear the gcov kernel counters.
lcov --zerocounters
The developer would run one or more tests to exercise the new kernel code. During the test, gcov-kernel counters are updated.
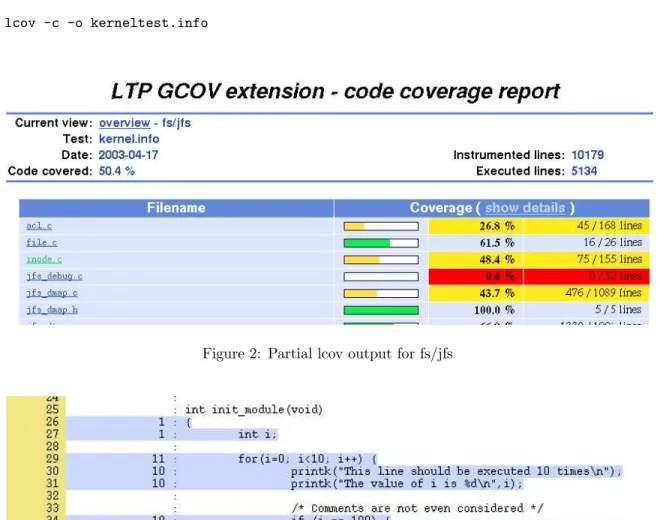
The basic process flow of the lcov tool is illustrated in Figure 1. Capture the gcov data by calling lcov with the capture option (-c), specifying an output file (-o).
lcov -c -o kerneltest.info
Figure 2: Partial lcov output for fs/jfs
Figure 3: Example lcov output for a file
The lcov tool first calls gcov to generate the coverage data, then calls the LTPgeninfoscript to collect that data and produce a .info file to represent the coverage data. Once the .info file has been created, the
genhtmlscript may be used to create HTML output for all of the coverage data collected. Thegenhtml
script will generate both output at a directory level as illustrated in Figure 2 and output on a file level as illustrated in Figure 3.
The lcov tool can also be used for analyzing the coverage of user space applications, and producing HTML output based on the data collected. Using lcov with applications is similar to kernel usage. In order to analyze coverage, the application must be compiled with gcc using the -fprofile-arcs and
-ftest-coverageflags. The application should be executed from the directory in which it was compiled, and for gcov to work on user space programs, the application must exit normally. The process for using lcov with an application is as follows:
1. Run the program following your test procedure, and exit.
2. lcov --directory [dirname] -c -o application.info
3. genhtml -o [outputdir] application.info
lcov can also be used to manipulate .info files. Information describing coverage data about files in a
.infofile may be extracted or removed. Runninglcov --extract file.info PATTERNwill show just the data in the.infofile matching the given pattern. Runninglcov --remove file.info PATTERNwill show all data in the given .info file except for the records matching the pattern, thus removing that record. Data contained in.infofiles may also be combined by running lcov -a file1.info -a file2.info -a file3.info... -o output.info, which produces a single file (output.info) containing the data from all files passed to lcov with the-aoption.
3
Results & Conclusions
The gcov-kernel patch overhead was estimated by comparing compile times for the Linux kernel. Specif-ically, each test kernel was booted and the time required to compile (execute make bzImage) the Linux 2.5.50 kernel was measured. Runtimes, as measured by /bin/time, show 91.62+1090.38 seconds of ker-nel+user time to compile the kernel without the gcov-kernel patch. A patched kernel took 113.17+1103.63 seconds to compile. Even though the patch increased the kernel time by about 23%, most applications spend a small percentage of their time in the kernel. In our test, the compile spent less than 10% of the time in the kernel, so the observed overall gcov-kernel patch overhead is about 3% of the combined kernel and user space runtime. See the Ottawa Linux Symposium paper [3] for more on the gcov-kernel patch overhead.
The real benefit of code coverage analysis is that it can be used to analyze and improve the coverage provided by a test suite. In this case, the test suite being improved is the Linux Test Project. 100% code coverage is necessary (but not sufficient) for complete functional testing. It is an important goal of the
LTP to improve coverage by identifying untested regions of kernel code. This section provides a measure of LTP coverage and how the gcov-kernel patch has improved the LTP suite.
The gcov-kernel patch and LTP tool and test suite make the valuable gcov software coverage package available to kernel developers. gcov allows developers to measure the effectiveness of their testing efforts.
References
[1] Code Coverage Analysis. http://www.bullseye.com/coverage.html.
[2] GCOV-kernel. http://ltp.sourceforge.net/coverage/gcov-kernel.php.
[3] P. Larson, N. Hinds, H. Franke, and R. Ravindran. Improving the linux test project with kernel code coverage analysis. In2003 Ottawa Linux Symposium, July 2003.
[4] LCOV. http://ltp.sourceforge.net/coverage/lcov.php.
[5] B. Marick. The Craft of Software Testing. Prentice Hall, 1995.
[6] W. E. Perry. Effective Methods for Software Testing. Wiley Computer Publishing, second edition edition, 2000.
Legal Statement
This work represents the view of the authors and does not necessarily represent the view of IBM. Linux is a registered trademark of Linus Torvalds.