Forensic Analysis of File System Intrusions using Improved Backtracking
Sriranjani Sitaraman and S. Venkatesan
Department of Computer Science
The University of Texas at Dallas
Richardson, Texas 75083-0688.
[email protected], [email protected]
Abstract
Intrusion detection systems alert the system administra-tors of intrusions but, in most cases, do not provide de-tails about which system events are relevant to the intrusion and how the system events are related. We consider intru-sions of file systems. Existing tools, like BackTracker, help the system administrator backtrack from the detection point, which is a file with suspicious contents, to possible entry points of the intrusion by providing a graph containing de-pendency information between the various files and pro-cesses that could be related to the detection point. We im-prove such backtracking techniques by logging certain ad-ditional parameters of the file system during normal opera-tions (real-time) and examining the logged information dur-ing the analysis phase. In addition, we use data flow anal-ysis within the processes related to the intrusion to prune unwanted paths from the dependency graph. This results in significant reduction in search space, search time, and false positives. We also analyze the effort required in terms of storage space and search time.
Keywords: Intrusion Detection, Data Flow Analysis, Dy-namic Slicing, Backtracking, File System
1. Introduction
Computer intrusions and attacks are increasing every year [3] and many of these are done with automated and sophisticated attack techniques [2]. Consequently, discov-ery or detection of intrusion is becoming more difficult. To help in determining how an attack happened and who is be-hind the attack, many events are logged continuously during a machine’s normal operation. After an intrusion, the sys-tem administrators have to examine huge log files for con-nections from unusual network locations or unusual activity in the system. Tools such as Tripwire [18] [19] help system
administrators by automating some parts of intrusion detec-tion. Adetection pointrefers to the state on the local com-puter that alerts the user of the intrusion [20]. Deleted or modified files, processes with unusual activity,setuidor set-gidfiles, unauthorized entries in system configuration file or network configuration file, etc., are called detection points. A number of security tools are available to help detect in-trusions, secure the system, and deter break-ins [1].
The logs provide a list of events that occurred prior to the intrusion, and often it is the system administrator’s task to determine how these events relate to each other and how these events affect the detection point. For example, the attacker may have installed a back-door in one login ses-sion, and used that back-door to gain unauthorized access in a subsequent session. An installedrootkit is an exam-ple of such Unix intrusions [12]. The log will not indicate that these two sessions are related and extensive examina-tion of the log is needed. An automated process for detect-ing dependencies between the various system events would greatly benefit intrusion analysis. BackTracker is such a tool, and was developed by King and Chen [20] to automat-ically identify the entry point used to gain access to a sys-tem and the sequence of steps leading to the detection point by displaying chains of events in a dependency graph.
We next present an overview of the BackTracker system and describe how it determines the sequence of events that affect a detection point.
1.1. BackTracker
BackTracker uses a modified Linux kernel to log events that describe dependencies between operating system ob-jects [20]. There are two components: the online compo-nent, which runs and logs information when the computer is in operation and the off-line component, which analyzes the log after an intrusion. King et al [21] show how Back-Tracker can generate forward causal graphs that can be used to track other hosts that are involved in multi-hop intrusions. While the various applications in the system are
execut-ing, BackTracker’s online logger component logs external information associated with events such as invocations of system calls and the related OS-level objects like files and processes. Some events create dependencies. For example, writing to a file by a process causes the file (the sink ob-ject) to depend on the process (the source obob-ject). The de-pendency associated with an event is represented assource sink. If process P writes to filef, the dependency cre-ated by this event is represented asP f. Thetime thresh-oldfor an object refers to the maximum time that an event can occur and still be considered relevant for that object. The time threshold of an object can be considered as a time instant and all time instantst such that .
With the log of the objects and dependency-causing events, BackTracker’s off-line graph generator component, namely GraphGen, constructs the dependency graph as follows. First, GraphGen is initialized with the object associated with the detection point and its time threshold is set to the earliest time that unusual contents/behavior was noticed in the detection point.GraphGenthen reads the log of events in the reverse order of their occurrence starting from the time the detection point was identified. For each eventE, GraphGenevaluates whetherEcan affect any object that is already in the dependency graph and whether the event has occurred within the time threshold of such an object in the graph. If the eventEis determined to affect an object in
the graph and the source object for this event, , is not
al-ready in the graph, then is added to the graph. The time
threshold of is set to the timetwhen eventEoccurs
be-causeEdoes not depend on events that occur aftert. More details about the various events and dependencies tracked by BackTracker can be found in [20].
As an example, consider the sequence of events (from the log) shown in Table 1. The intrusion detection system determined thatFile 7has suspicious contents. Let the ac-tual path of the attacker be:File 2 Process B Process D File 6 Process F File 7. WithFile 7as the de-tection point, BackTracker constructs the dependency graph corresponding to the sequence of events of Table 1 as shown in Figure 1. In the graph, the label on each event shows the time of occurrence of the event.
We consider the problem of presenting a compact depen-dency graph to the system administrator to analyze. The de-pendency graph generated by BackTracker may be too large even after applying some of the suggested filtering rules. We propose two additional steps that can reduce the size of the dependency graph. First, we add additional fields to the log with details about file offsets where a read or write opera-tion is performed, and use this informaopera-tion while generating the graph. Second, we propose the use of data flow analysis within processes to determine the events relevant to the de-tection point. Each of these two steps can reduce the graph size significantly. Data flow analysis has been used
exten-Time Event
1. Process AcreatesProcess B 2. Process Breads fromFile 1 3. Process Breads fromFile 2 4. Process Breads fromFile 3 5. Process BcreatesProcess D 6. Process Dwrites toFile 4 7. Process Dwrites toFile 5 8. Process Dwrites toFile 6 9. Process BcreatesProcess C 10. Process Creads fromFile 4 11. Process Cwrites toFile 7 12. Process BcreatesProcess E 13. Process Ereads fromFile 5 14. Process Ewrites toFile 7 15. Process BcreatesProcess F 16. Process Freads fromFile 6 17. Process Fwrites toFile 7
18. File 7is identified as the detection point
Table 1. Sample Sequence of System Events
18: Detection Point 17 16 14 1 2 3 4 5 6 7 8 9 10 11 15 12 13 File 1 Process D File 6 File 5 File 4
Process C Process E Process F
File 7 Process B
Process A File 2
File 3
Figure 1. Dependency Graph generated by BackTracker
sively to optimize code during the compilation process [8]. Data flow information such asreaching definitions, that in-dicate which definitions of a variable may be used at a point of concern in a program, can be collected using static or dy-namic methods, and this information can be used to reduce the number of possible paths in the dependency graph.
Our initial analysis shows that there is a moderate space overhead in the logging phase and time overhead in the analysis phase, but the resulting graph size is quite small when compared to the size of the graphs constructed with-out our optimization.
The rest of the paper is organized as follows: In Sec-tion 2, we describe the system model used, and SecSec-tion 3 presents an overview of the main components of our tool. Our solution to the problem of large dependency graphs is presented in Section 4. Section 5 discusses ideas for im-plementation of the tool, and Section 6 analyzes the algo-rithm’s performance, and limitations of our approach. tion 7 compares our contribution to related work, and Sec-tion 8 concludes the paper.
2. System Model
Consider a typical Unix system where the operating sys-tem, commonly called as thekernel, interacts directly with the hardware. The user applications use the system call in-terface to access the operating system’s functions. Data is stored infilesand files are organized on the hard disk in a Unix-based file system. The file system is accessed via sys-tem calls. The attributes of files such as the file’s owner, file size, last modification time, etc., are stored ininodes. A programis an executable file, and aprocessis an instance of the program in execution [10]. Processes execute simul-taneously in the Unix system, and system calls allow cre-ation, termincre-ation, synchronizcre-ation, etc., of processes.
There are two main components: an onlineloggerand an off-linegraph generator. Theloggercomponent can be built into the kernel or implemented as a loadable kernel module and executed along with other user applications. In the event of an intrusion, with the log of events and a detec-tion point, the off-linegraph generatorconstructs a graph of dependencies that relate to the detection point. Thegraph generator’s output is given to the system administrator for analysis of the intrusion.
We now describe the various objects, events and depen-dencies that are relevant to the backtracking tool. The back-tracking tool is used for back-tracking file system based intru-sions only. It tracks the flow of information between operat-ing system objects and events. It does not track application level objects or events.
1. Objects:
The OS-level objects that are tracked by the back-tracking tool are files, processes and filenames. Afile
object is identified by its inode and contents. A pro-cess object is described by its unique PID and a ver-sion number. Every process except the swapper pro-cess is tracked from its creation to termination. Swap-per is tracked from the time it makes the first system call.Filenameobjects indicate the absolute pathnames of files. These objects are affected by system calls such ascreat(),open(),unlink(), etc.
2. Events:
The system calls invoked by processes are the events that are tracked by logger. The system call events affect OS objects. For example, when a pro-cess writes to a file f using thewrite() system call, file f is the object affected by the event. When log-gerlogs an event, it stores all the identifying informa-tion about the calling process and the affected object. In addition to that,loggerstores the values of the pa-rameters that were provided as input to the system call as well as the return value of the system call. As de-scribed in Section 4, this information will be used when thegraph generatoranalyzes the trace and per-forms data flow analysis to reduce the size of the graph. Note that this logging operation can be per-formed by modifying the system call or by modifying the application/system program.
3. Dependencies:
An eventEresults in a dependency between the OS objects that are associated withE. A dependency is represented assource object sink object.
Dependencies can be of the following types: (i)Between two processes:
Such dependencies are created when one process cre-ates another process (using thefork() system call) or sends a signal to another process. A dependency of the formProcess A Process Bis created whenProcess A forksProcess B. The same dependency is created whenProcess Asends a signal toProcess Bwith the kill() system call.
(ii)Between a process and a file:
A Process File dependency is created when the file’s contents or attributes are affected by some ac-tion by a process. Thewrite() andchown() system calls are examples that produce a Process File depen-dency. Aread() system call introduces a dependency of the type:File Process. This dependency arises due to the fact that the process’ actions may depend on the contents read from the file. As an example, a pro-cessAdepends on a fileFwhen processAreads data from fileF, and this is represented asFile F Pro-cess A.
(iii)Between a process and a filename:
AProcess Filename dependency is created when the process invokes a system call that modifies a
file-name object. Examples of such system calls are re-name(),unlink(),creat(),link(),mount(), etc. A File-name Process dependency is created when a sys-tem call that takes a filename object as input succeeds. For example, system calls such asopen(),stat(), etc., will not succeed if the file identified by the filename ar-gument does not exist. In such cases, theFilename Processdependency is not created.
2.1. Definitions
Following are some terms used in the subsequent sec-tions.
Offset Interval in a File We define offset interval, [a,b],
, in a filef as the set of byte offsets fromatob inf.
Suspicious Offset Interval Asuspicious offset intervalof a filef is an offset interval infthat is known to contain suspicious contents (for example, if filef is a detection point). Note that a file can have more than one suspi-cious offset interval. Let the set of all suspisuspi-cious off-set intervals of a filef be denoted by . , for a file
f, is initialized with either the offset interval where sus-picious contents are found (iff is a detection point) or is initialized to null (for all other files).
Offset Interval of Read/Write Operation The offset in-terval of a read or write operation is [a,b] if the read or write operation was performed between offsetsaand bin the file. For example, if a process reads nbytes from a file from an offset of 100 from the start of the file, then the offset interval of thisread() system call is [100, 100 n].
Overlapping Offset Interval Offset interval,w, of a write operation is said to beoverlappingan offset intervals of filef ifwandshave some common offsets, i.e., if
!#"
. For example, if a process writes to offsets [50, 100] of filef, itoverlapsoffset intervals [75, 125], [25, 60], [75, 80], etc., of filef.
Latest Overlapping Offset Interval For each offset bin a suspicious intervals of filef, we define the latest overlapping offset intervalas the offset interval corre-sponding to the latest write that was performed at off-setbin filef. If no write operation was performed at offsetbin suspicious intervalsof filef, then the lat-est overlapping offset interval forbis null. Note that a suspicious offset interval consists of one or more off-sets, and hence may have multiple latest overlapping offset intervals.
3. Design of Backtracking tool
Figure 2 illustrates the various steps involved in back-tracking a file system based intrusion. When the programs are executing, theloggercomponent logs the system events. An intrusion detection system detects an intrusion either immediately after it occurs or at a later time. A detection point (a suspicious OS object) is identified. With the detec-tion point and the trace of the system events (found in the log), the off-linegraph generatorcomponent constructs the dependency graph. This dependency graph can be further pruned using the data flow analysis tool explained in Sec-tion 4.2.
We now explain the two main components of the back-tracking tool in more detail.
Logger:
Logging of system events and affected operating sys-tem objects while the syssys-tem is executing constitutes an important phase of the tool, thereby enabling backtrack-ing from the detection point to the entry point of intrusion. The responsibility of the loggeris to monitor all the ap-plications executing on the target system and log the var-ious events occurring on the system at the OS level. The logger logs all the information needed to enable a re-play of all the events, if possible, during the subsequent analysis and graph generation phase. This involves trac-ing the system calls executed by the various applications, and logging them along with the values of the input param-eters and return values.
Graph Generator:
Thegraph generatoris an off-line component of the tool that analyzes the log created by the online logger com-ponent. The detection point, indicated by an intrusion detection system or other tools, is used as the start-ing point for the analysis, and the log is examined ‘back-wards’ i.e., from the last event to the first, in a manner similar to BackTracker. An outline of the graph genera-tion algorithm as used in BackTracker is given below. Note that the dependency graph is initialized to the object corre-sponding to the detection point.
Initialize dependency graph to object corresponding to the detec-tion point.
/* read events from latest to earliest, starting from the time when the detection point was identified by the intrusion detection sys-tem*/
for each eventEin log$
let%'&)(+*-,.(0/
---Program Source
Data Flow Analysis Tool Uses offset intervals, other system event details Online Logger in execution Programs Data flow Control flow Log Compile, build Dynamic Slicing Static Slicing Graph Generator Offline Graph Pruned Dependency system events detected Intrusion Intrusion detection System
file f is detection point Dependency Graph
threshold of(0/ )
if (object(+* not already in graph)$
add(* to graph
connect(+* to(0/ with directed edge(1*-,.(0/
set time threshold of(+* to time ofE
2
2
4. Improvements to BackTracker
The motivation for our work has been the reduction in the size of the graph generated by BackTracker. We now explain how to find unwanted paths in the graph. The two main improvements to the existing tool, BackTracker, are presented below.
4.1. Offset Intervals
We log the file offsets when read or write operations are performed. The offset intervals associated with the read() andwrite() system calls help in reducing the size of the re-sulting dependency graph. For instance, consider that Pro-cess Awrites toFile 1to offset interval [10, 20], and Pro-cess Breads fromFile 1subsequently from offset interval [50, 100] with no intermediate operation (by any process) that modifies the contents ofFile 1. In this case, there does not exist a dependency between processesAandBwith the path:Process A File 1 Process B. BackTracker would include such a path in the dependency graph because the write operation ofProcess AtoFile 1had happened within the time threshold of the read operation ofFile 1by
Pro-cess B. We remove such dependencies from the graph using the offset interval information.
We propose changes to the graph generation algorithm when a write event or a read event is encountered in the log. The changes are described in the following sections.
4.1.1. Write Event The following checks are per-formed in the graph generation algorithm while examin-ing a write eventEfrom the log in order to use the available offset interval information. Let be the set of all
suspi-cious offset intervals of a filef. Iff is the detection point, then is initialized to the suspicious offset interval
de-tected inf, otherwise, is initialized to null.
if (Ecorresponds to awrite() system call by processPon filef)$
let%'&)(+34,5(+6
if ((+6 exists in graph andEaffects(+6 by time
threshold of(+6 )
if (offset interval ofEis a latest overlapping offset interval for some suspicious offset intervalsof filef, i.e.,7+8:9 6 )
if (( 3 not already in graph)$
add( 3 to graph
connect(3 to(+6 with directed edge,(+3:,5(6
set time threshold of(+3 to time ofE
2
2
4.1.2. Read Event When a read eventEof processPfrom filef is encountered, the event is added to the graph if the object associated withPis already in the graph. We need to know what the suspicious offset intervals of a file are as it is not necessary to track write operations that write to a part
of the file that is never read from subsequently. So, in our backwards analysis of the event log, when we encounter a read operation, we add the offset interval of this read oper-ation to , the set of all suspicious offset intervals of file
f.
The following actions are taken by the graph genera-tion algorithm while examining a read eventE.
if (Ecorresponds to aread() system call by processPfrom filef)
$ let%;&)( 6 ,.( 3 if ((
3 exists in graph andEaffects
(
3 by time
threshold of( 3 )
if ((
6 not already in graph)
$
add(
6 to graph
connect(+6 to(+3 with directed edge,(16,5(3
set time threshold of(+6 to time ofE
add offset interval ofEto the set96 of suspicious
offset intervals of filef
2
2
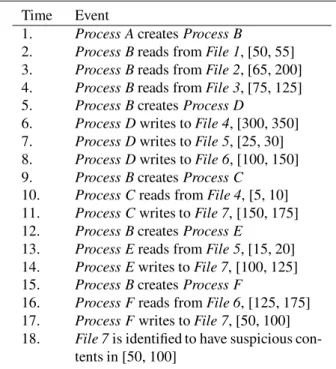
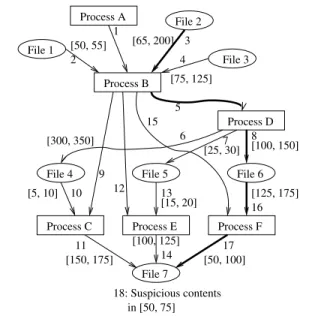
We present an example to better illustrate the benefits of using offset intervals. Table 2 shows the same sequence of events in the log of Table 1 with the corresponding offset in-terval information. Figure 3 shows the dependency graph of Figure 1 with offset interval information for theread() and write() system calls. Suppose the intrusion detection sys-tem indicated thatFile 7is the detection point with suspi-cious offset interval [50, 75]. Given the offset interval in-formation for all theread() andwrite() system calls, our al-gorithm will produce a dependency graph as shown in Fig-ure 4.
The following steps were taken while generating the de-pendency graph shown in Figure 4 for the sequence of events in Table 2.
1. Time 18: First, the graph is initialized withFile 7, the detection point. The suspicious offset interval ofFile 7 is [50, 75].
2. Time 17:Process F writes toFile 7in offset interval [50, 100]. This write event’s offset interval is deter-mined to be a latest overlapping interval of the suspi-cious offset interval [50, 75] ofFile 7. So we add the source of this event, Process F, and an edge for the event to the graph. The time threshold ofProcess Fis set to 17, the time of this event.
3. Time 16:Process Freads fromFile 6. The sink object Process Fof the event exists in the graph constructed so far and the event’s time is within the time thresh-old of the object ofProcess F. So, the source object of this event,File 6, is added to the graph. Also, the
off-Time Event
1. Process AcreatesProcess B
2. Process Breads fromFile 1, [50, 55] 3. Process Breads fromFile 2, [65, 200] 4. Process Breads fromFile 3, [75, 125] 5. Process BcreatesProcess D
6. Process Dwrites toFile 4, [300, 350] 7. Process Dwrites toFile 5, [25, 30] 8. Process Dwrites toFile 6, [100, 150] 9. Process BcreatesProcess C
10. Process Creads fromFile 4, [5, 10] 11. Process Cwrites toFile 7, [150, 175] 12. Process BcreatesProcess E
13. Process Ereads fromFile 5, [15, 20] 14. Process Ewrites toFile 7, [100, 125] 15. Process BcreatesProcess F
16. Process Freads fromFile 6, [125, 175] 17. Process Fwrites toFile 7, [50, 100] 18. File 7is identified to have suspicious
con-tents in [50, 100]
Table 2. Sequence of System Events with Off-set Intervals
set interval of this read event, [125, 175] is added to the list of suspicious offset intervals ofFile 6.
4. Time 15: The dependencyProcess B Process F is added to the graph asFis already in the graph and the event occurs within the time threshold ofProcess F. 5. Time 14:Process E writes toFile 7in offset interval
[100, 125]. This offset interval does not overlap the suspicious offset interval ofFile 7, [50, 75]. So the de-pendency corresponding to this event is not added to the graph.
6. Time 13, 12: SinceProcess E is not in the graph, the events occurring at times 13 and 12 are skipped. 7. Time 11, 10, 9: The write event at time 11 byProcess
CtoFile 7does not have an offset interval that over-laps the suspicious offset interval ofFile 7. So,Process Cis not added to the graph, and the next two events at times 10 and 9 are also skipped.
8. Time 8:Process Dwrites toFile 6in offset interval [100, 150]. File 6 is in the graph, and its only sus-picious offset interval [125, 175] overlaps with this event’s offset interval. So,Process Dis added to the graph, with the time threshold set to 8.
9. Time 7, 6: BothFile 4andFile 5are not found in the dependency graph, so these events (at time instants 7 and 6) are skipped.
[25, 30] [5, 10] 1 2 3 4 5 6 7 8 9 10 11 12 [15, 20] 13 14 15 17 16 File 1 Process D File 6 File 5 File 4
Process C Process E Process F
File 7 Process B Process A File 2 File 3 [50, 100] 18: Suspicious contents in [50, 75] [150, 175] [100, 150] [75, 125] [65, 200] [50, 55] [300, 350] [100, 125] [125, 175]
Figure 3. Graph of Figure 1 with offset inter-val information
10. Time 5:Process Dexists in the graph, soProcess Bis added to the graph for this event.
11. Time 4, 3, 2: Objects forFile 1,File 2andFile 3are added to the graph. The offset interval of each of these read events is added to the respective file’s list of sus-picious offset intervals.
12. Time 1:Process Ais added to the graph as Process B is found in the graph.
The dependency graph of Figure 4 has fewer objects and dependency edges than the graph of Figure 1.
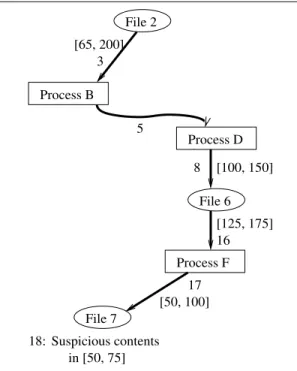
4.2. Data Flow Analysis
In the reduced dependency graph of Figure 4 that was ob-tained after applying offset intervals information, note that Process Bhad read data fromFile 1,File 2, andFile 3. The suspicious content thatProcess Bpassed on toProcess Din a buffer variable was written toFile 6byProcess D. While analyzing the events in the log, it is not clear from where Process Bobtained the suspicious data (and then passed to Process D). The possible data sources are the three files, File 1,File 2orFile 3, some internal definition of the data buffer or user data read byProcess B. We use program slic-ing techniques on the programs ofProcesses DandBto de-termine the reaching definitions for the value of the buffer variable used in thatwrite() system call. This approach re-duces the search space further. Note that this may require the source code of the programs involved.
The process global data flow analysisis used in order to determine how data flows through the various
applica-1 2 3 4 5 8 15 16 17 18: File 1 Process D File 6 Process F File 7 Process B Process A File 2 File 3 [50, 100] Suspicious contents in [50, 75] [100, 150] [75, 125] [65, 200] [50, 55] [125, 175]
Figure 4. Smaller dependency graph con-structed using offset intervals
tion program [8]. In data flow analysis, the definitiondis said toreacha pointpif there is a path in the program from the point immediately followingdtop, such thatdis not “killed” along that path. The definition of a variable ais said to bekilledif between two points along the path there is a read ofaor an assignment toa[8].
Aprogram slicerefers to the set of statements of the pro-gram that influences the value of a variable at a point in the program. The initial notion of a program slice was astatic slice obtained irrespective of the values of the input vari-ables. Given a variable, a program location and a set of val-ues for all input variables, the task of determining which statements in the program affected the value of that vari-able at that location is referred to asdynamic program slic-ing[4] [6].
Static program slicing techniques can be used to reduce the size of the dependency graph but they may be very con-servative and inefficient. A static analysis of the source code of a program cannot indicate what execution paths the pro-gram may have. Hence, static propro-gram slicing may present more reaching definitions for a variable’s value than the ac-tual set of definitions that could possibly be executed. Dy-namic slicing takes a particular test case, represented by a known set of values for all the input variables, and evalu-ates the program thereby yielding more probable program slices.
In the example shown in Figure 4, after applying dy-namic slicing on the programs of Process DandProcess Bwith the trace generated bylogger, suppose that the only reaching definition (of the buffer variable used in the write
3 5 8 16 17 18: Process D File 6 Process F File 7 Process B File 2 [50, 100] Suspicious contents in [50, 75] [100, 150] [65, 200] [125, 175]
Figure 5. Dependency Graph after applying Dynamic Slicing
event at time 8) is determined to be theread() system call invoked by Process Bto read contents from File 2. This would yield the smaller dependency graph shown in Fig-ure 5. Note that to perform program slicing for the buffer variable of a particular write event, the location in the pro-gram of thatwrite() system call, in addition to the values of all the input variables, is needed. The location (line num-ber) of thewrite() system call in the program, correspond-ing to an event, can be determined by techniques described in Section 5.
5. Implementation Ideas
The componentloggerof our tool can be built as part of the Linux kernel or can be implemented as a Linux loadable kernel module. OS Virtual Machines that were introduced to enable time-sharing of expensive hardware are now used in a variety of applications [14] [15]. The secure and fine gran-ular logging of system execution that virtual machines pro-vide can be used in intrusion detection [13]. User applica-tions can be executed on the host system or inside a tar-get system which itself is running as a user application on the host system. In the latter case, the target system is a host process that transfers control tologger, a Virtual Ma-chine Monitor (VMM), whenever a system call is invoked by a user application in the target system. Whenever log-geris invoked, it examines the host system for the state of
the target system process and extracts information about the event and the affected objects.
Whenever awrite() system call is invoked,loggerneeds to print the line number of thewrite() system call in the source program. The line number information is needed to perform data flow analysis during the graph generation phase of the backtracking tool. In order to make the line numbers available tologger, this information is added to a section of the object file during compilation of the user application. The compiler has to be enhanced to perform this operation and all the user applications have to be com-piled using this enhanced compiler. The -goption of gcc can be used to produce debugging information in the oper-ating system’s native format [26]. The ability to read the re-quired line number details from the debugging information section of the object file can be built intologger. Similar ca-pability can be found in the Gnu Debugger (GDB) applica-tion [27].
6. Performance and Limitations
We analyze the overheads of time and storage space in the two phases of our backtracking tool, namely log-ging and graph generation, and compare the time and space requirements of our improved backtracking tool with exist-ing tools such as BackTracker.
Logging Phase:
Our logger component needs to log more informa-tion that enables thegraph generator to replay the events and perform data flow analysis. The additional informa-tion consists of the actual values passed to the system calls, and the return values of the system calls. The log-ger in our backtracking tool also needs to obtain the line number information from the relevant sections of the ob-ject file whenever awrite() system call is encountered.
Graph Generation Phase:
With the improved graph generation algorithm, the size of the dependency graph will be reduced. Hence, with fewer paths to track, our backtracking tool generates the fi-nal dependency graph faster. Dynamic slicing will produce good results by pruning more unwanted paths in the graph, but at the expense of additional time in the graph genera-tion phase.
A limitation of our approach is the storage overhead dur-ing the loggdur-ing phase. The detailed traces are needed in or-der to replay the various programs and determine program slices dynamically. We can reduce the space required by the log by choosing static program slicing instead of dynamic
program slicing. Note that in order to perform static data flow analysis on a program, the source code for that pro-gram is required. Also, execution backtracking has its lim-itations since it may not be feasible to undo certain actions of the applications and replay them. In such cases, dynamic slicing techniques may produce conservative results.
7. Related Work
The idea of using causality of system events has been ex-ploited by other research projects such as King and Chen’s BackTracker [20] and the Repairable File System [33]. In Repairable File System, a forward analysis from the de-tection point is performed to determine the operating sys-tem objects that were affected by the syssys-tem intrusion. Ammann, Jajodia and Liu [9] have proposed techniques to detect the flow of contaminated transactions through a database and roll back those transactions that are affected directly or indirectly by contaminated transactions. In con-trast, our intrusion detection tool backtracks from a detec-tion point to determine the entry point of an intrusion. Only OS-based objects and events are tracked.
BackTracker performs forward as well as backward anal-ysis of operating system events to detect the flow of infor-mation from and to the detection point. BackTracker filters the resulting graph to prioritize likely paths of an intrusion, but in doing so, may hide important sequences of events. Our work, in comparison, performs backward analysis from a detection point. With moderate storage overhead, the im-provements suggested in this paper aim to reduce the size of the dependency graph while retaining the important se-quences of events that led to the detection point.
Weiser [29] [30] introduced the concept of program slic-ing to make debuggslic-ing of programs easier. Many tech-niques to obtain static program slices were proposed in [11] [17] [25]. In addition to debugging, program slices are useful in testing, maintenance, and understanding of pro-grams [4] [6]. Techniques such as PSE (Postmortem Static Analysis) by Manevich et al [24] use information about a program failure (such as the kind of failure, and its loca-tion in the program’s source code) to produce a set of ex-ecution traces along which the program can be driven to the given failure. Notions of dynamic program slicing were proposed by Korel and Laski [22] and Agrawal and Hor-gan [7]. Agrawal et al present a debugging model, based on dynamic slicing and execution backtracking techniques, that easily lends itself to automation in [5]. Dynamic slicing techniques are still topics of active research [31] [32]. Sur-veys of the various program slicing methods are presented in [16] [23] [28]. In this work, we have applied dynamic slicing techniques for detection of file system based intru-sions.
8. Conclusion
Analyzing an intrusion with huge log files is an ardu-ous task for system administrators. The system administra-tor must determine how the intruder gained access to the system and conducted the attack. Existing tools, like Back-Tracker, provide a dependency graph of the events in the log that relate to the intrusion. In this paper, we have ad-dressed the problem of reducing the size of the dependency graph. We have proposed two improvements to the graph generation algorithm, which when applied properly can re-sult in significant reduction in search space and search time.
References
[1] CERT/CC List of security tools. 2001,
http://www.cert.org/tech tips/security tools.html.
[2] CERT/CC Overview of attack trends. 2002, http://www.cert.org/archive/pdf/attack trends.pdf.
[3] CERT/CC Overview: Incident and vulnerability trends. 2003, http://www.cert.org/present/cert-overview-trends/. [4] H. Agrawal, R. A. DeMillo, and E. H. Spafford. Dynamic
slicing in the presence of unconstrained pointers. In Pro-ceedings of the symposium on Testing, analysis, and verifi-cation, pages 60–73. ACM Press, 1991.
[5] H. Agrawal, R. A. Demillo, and E. H. Spafford. Debugging with dynamic slicing and backtracking.Software - Practice and Experience, 23(6):589–616, 1993.
[6] H. Agrawal and J. R. Horgan. Dynamic program slicing. In Proceedings of the ACM SIGPLAN 1990 conference on Pro-gramming language design and implementation, pages 246– 256. ACM Press, 1990.
[7] H. Agrawal and J. R. Horgan. Dynamic program slicing. In Proceedings of the ACM SIGPLAN 1990 conference on Pro-gramming language design and implementation, pages 246– 256. ACM Press, 1990.
[8] A. V. Aho, R. Sethi, and J. D. Ullman. Compilers: princi-ples, techniques, and tools. Addison-Wesley Longman Pub-lishing Co., Inc., 1986.
[9] P. Ammann, S. Jajodia, and P. Liu. Recovery from malicious transactions. IEEE Transactions on Knowledge and Data Engineering, 14(5):1167–1185, September/October 2002. [10] M. J. Bach.The Design of the Unix Operating System.
Pren-tice Hall PTR, 1986.
[11] J.-F. Bergeretti and B. A. Carr. Information-flow and data-flow analysis of while-programs.ACM Transactions on Pro-gramming Languages and Systems (TOPLAS), 7(1):37–61, 1985.
[12] M. Bishop. Unix security: Security in programming. SANS’96, 1996.
[13] G. W. Dunlap, S. T. King, S. Cinar, M. A. Basrai, and P. M. Chen. Revirt: enabling intrusion analysis through virtual-machine logging and replay. SIGOPS Oper. Syst. Rev., 36(SI):211–224, 2002.
[14] J. Grizzard, E. Dodson, G. Conti, J. Levine, and H. Owen. Towards a trusted immutable kernel extension (tike) for self-healing systems: a virtual machine approach. InProceedings of the Fifth IEEE Information Assurance Workshop (IAW), pages 444–446. IEEE, June 2004.
[15] J. Grizzard, S. Krasser, G. C. Owen, and E. Dodson. To-wards an approach for automatically repairing compromised network systems. InProceedings of the IEEE Symposium on Network Computing and Application’s Workshop on Trust-worthy Network Computing (IEEE-NCA), August 2004. [16] T. Hoffner, M. Kamkar, and P. Fritzson. Evaluation of
pro-gram slicing tools. InProceedings of Automated and Algo-rithmic Debugging, pages 51–69, 1995.
[17] S. Horwitz, T. Reps, and D. Binkley. Interprocedural slic-ing usslic-ing dependence graphs. ACM Transactions on Pro-gramming Languages and Systems (TOPLAS), 12(1):26–60, 1990.
[18] G. Kim. Advanced applications of tripwire for servers: De-tecting intrusions, rootkits and more..Whitepaper, Tripwire. [19] G. H. Kim and E. H. Spafford. The design and implementa-tion of tripwire: A file system integrity checker. In Proceed-ings of ACM Conference on Computer and Communications Security, pages 18–29, 1994.
[20] S. T. King and P. M. Chen. Backtracking intrusions. In Proceedings of the nineteenth ACM symposium on Operat-ing systems principles, pages 223–236. ACM Press, 2003. [21] S. T. King, Z. M. Mao, D. G. Lucchetti, and P. M. Chen.
En-riching intrusion alerts through multi-host causality. In Pro-ceedings of 2005 Network and Distributed System Security Symposium (NDSS) (to appear), 2005.
[22] B. Korel and J. Laski. Dynamic slicing of computer pro-grams. The Journal of Systems and Software, 13:187–195, 1990.
[23] A. D. Lucia. Program slicing: Methods and applications. In Proceedings of the First IEEE International Workshop on Source Code Analysis and Manipulation, pages 142–149. IEEE Computer Society Press, Los Alamitos, California, USA, Nov 2001.
[24] R. Manevich, M. Sridharan, S. Adams, M. Das, and Z. Yang. Pse: Explaining program failures via postmortem static anal-ysis. InProceedings of SIGSOFT’04/FSE-12. ACM Press, 2004.
[25] K. J. Ottenstein and L. M. Ottenstein. The program depen-dence graph in a software development environment. In Pro-ceedings of the first ACM SIGSOFT/SIGPLAN software gineering symposium on Practical software development en-vironments, pages 177–184. ACM Press, 1984.
[26] R. M. Stallman. Using and Porting GNU CC, Version 2.8.1. 1995.
[27] R. M. Stallman.GDB Manual, Version 6.2.1. 2004. [28] F. Tip. A survey of program slicing techniques. Journal of
programming languages, 3:121–189, 1995.
[29] M. Weiser. Programmers use slices when debugging. Com-munications, ACM, 25(7):446–452, 1982.
[30] M. Weiser. Program slicing.IEEE Transactions on Software Engineering, 10(4):352–357, 1984.
[31] X. Zhang and R. Gupta. Cost effective dynamic program slicing. InProceedings of the ACM SIGPLAN Conference on Programming Language Design and Implementation, June 2004.
[32] X. Zhang, R. Gupta, and Y. Zhang. Precise dynamic slicing algorithms. InProceedings of the IEEE/ACM International Conference on Software Engineering, pages 319–329, May 2003.
[33] N. Zhu and T. Chiueh. Design, implementation, and eval-uation of repairable file service. Proceedings of The Inter-national Conference on Dependable Systems and Networks, June 2003.