Mining Biological Data. Cogn Comput. doi: 10.1007/s12559-020-09773-x [epub ahead of print].
Deep Learning in Mining Biological Data
Mufti Mahmud∗ · M. Shamim Kaiser∗ ·T. Martin McGinnity · Amir Hussain
Received: 10/08/2020/ Accepted: date
Abstract
Background: Recent technological advancements in data acquisition tools allowed life scientists to acquire multimodal data from different biological application domains. Categorised in three broad types (i.e., images, signals, and sequences), these data are huge in amount and complex in nature. Mining such enormous amount of data for pattern recognition is a big challenge and requires sophisticated data intensive machine learning techniques. Artificial neural network based learning sys-tems are well known for their pattern recognition capa-bilities and lately their deep architectures - known as deep learning (DL) - have been successfully applied to solve many complex pattern recognition problems. Methods: To investigate how DL - especially its dif-ferent architectures - has contributed and utilised in the mining of biological data pertaining to those three types, a meta analysis has been performed and the re-sulting resources have been critically analysed.
Mufti Mahmud ( )
Department of Computing & Technology, Nottingham Trent University, Clifton, Nottingham, NG11 8NS, UK E-mail: [email protected], [email protected] M. Shamim Kaiser ( )
Institute of Information Technology, Jahangirnagar University, Savar, Dhaka, 1342, Bangladesh E-mail: [email protected]
T. Martin McGinnity
Intelligent Systems Research Centre, Ulster University, Northern Ireland, Derry, BT48 7JL, UK
Department of Computing & Technology, Nottingham Trent University, Clifton, Nottingham, NG11 8NS, UK
Amir Hussain
School of Computing, Edinburgh Napier University, Edin-burgh, EH11 4BN, UK
∗ M. Mahmud and M.S. Kaiser are joint first and corre-sponding authors.
Results and Conclusion:Focusing on the use of DL to analyse patterns in data from diverse biological do-mains, this work investigates different DL architectures’ applications to these data. This is followed by an ex-ploration of available open access data sources pertain-ing to the three data types along with popular open source DL tools applicable to these data. Also, com-parative investigations of these tools from qualitative, quantitative, and benchmarking perspectives are pro-vided. Finally, some open research challenges in using DL to mine biological data are outlined and a number of possible future perspectives are put forward. Keywords Brain machine interfaces · bioimaging ·
deep learning performance comparison · medical imaging · omics · open access data sources · open source tools.
1 Introduction
The pursuit of understanding human behaviours, along with the various pathologies, their early diagnosis and finding cures have driven the life sciences research in the last two centuries [1]. This accelerated the devel-opment of cutting edge tools and technologies that al-low scientists to study holistically the biological sys-tems as well as dig down, in an unprecedented man-ner, to the molecular details of the living organisms [2, 3]. Increasing technological sophistication has pre-sented scientists with novel tools for DNA sequencing [4], gene expression [5], bioimaging [6], neuroimaging [7], and body/brain-machine interfaces [8].
These innovative approaches to study the living or-ganisms produce huge amount of data [9] and create a situation often referred as ‘Data Deluge’ [10]. Depend-ing on the target application and experimentation, this
Gene/DNA/RNA seq. Gene expression Molecular components Protein structure
Human activity recognition Behavioral monitoring Cognetive state Anomaly detection Disease prediction Drug design Gene modification Alternative splicing PS interpretation EM Images (f/s)MRI PET/CT Scan Radiographs Fundus Images Endoscopy Images Electroencephalogram Electromyogram Electrocardiogram Single / multiunit activity Field potentials Image reconstruction Disease diagnosis Organ segmentaion Anomaly detection Cell analysis Cell/tissue classification Cell count Disease diagnosis Deep Learning Data
Hardware Tools / Frameworks / Libraries
Applications
RNN DA
CNN DBN
Output Hidden Visible Conv/Pool
Input Kernel
DEEPLEARNING4J
DL4J
Simple to Abstract
features ClassificationMapping/
CPU
Control ALU ALU ALUALU Cache DRAM GPU DRAM FPGA Config. ASIC scikit
Fig. 1 The ecosystem of modern data analytics using advanced machine learning methods with specific focus on application
of DL to biological data mining. The biological data coming from various sources (e.g., sequence data from theOmics, various images from the [Medical/Bio]-Imaging, and signals from the [Brain/Body]-Machine Interfaces) are mined using DL with suitable architectures tailored for specific applications.
biological big data can be characterized by their inher-ent characteristics of beinghierarchical (i.e., data com-ing from different levels of a biological system – from molecules to cells to tissues to systems),heterogeneous
(i.e., data acquired by different acquisition methods – from genetics to physiology to pathology to imaging),
dynamic(i.e., data changes as a function of time), and
complex (i.e., data describing nonlinear biological
pro-cesses) [11]. These intrinsic characteristics of biologi-cal big data posed an enormous challenge to data sci-entists to identify patterns and analyze them to infer meaningful conclusions from these data [12]. The chal-lenges have triggered the development of rational, reli-able, reusreli-able, rigorous, and robust software tools [11] using machine learning (ML) based methods to facil-itate recognition, classification, and prediction of pat-terns in the biological big data [13].
Based on how a method learns from the data, the ML techniques can be broadly categorized into
super-vised andunsupervisedapproaches. Insupervised
learn-ing, objects in a pool are classified using a set of known annotations or attributes or features, i.e., a supervised
algorithm learns the pattern(s) from a limited number of annotated training data and then classifies the re-maining testing data using the acquired knowledge.
In-stead, in theunsupervised learning, pattern(s) are first defined from a subset of the unknown data and then the remaining data are classified based on the defined patterns, i.e., an unsupervised algorithm first defines pattern(s) among the objects in a pool of data with un-known annotations or attributes or features, and then uses the acquired knowledge to classify the remaining data. In addition, there is another category called
re-inforcement learning which, is out of the scope of this
work, but allows an agent to improve its experience and knowledge by learning iteratively through interacting with its environment.
Since the 1950s’ many methods pertaining to both the learning paradigms (i.e., supervised and
unsuper-vised) have been proposed. The popular methods in the
supervised domain include: ANN [14] and its variants
(e.g., Backpropagation [15], Hopfield Networks [16], Boltz-mann Machines [17], Restricted BoltzBoltz-mann Machines [18], Spiking Neural Networks [19], etc.), Bayesian Statis-tics [20], Support Vector Machines [21] and other lin-ear classifiers [22] (e.g., Fisher’s Linlin-ear Discriminant [23], Regressors [24], Naive Bayes Classifier [25], etc.), k-Nearest Neighbors [26], Hidden Markov Model [27], and Decision Trees [28]. Popularunsupervised methods include: Autoencoders [29], Expectation-Maximization
[30], Information Bottleneck [31], Self-Organizing Maps [32], Association Rules [33], Hierarchical Clustering [34], k-Means [35], Fuzzy Clustering [36], and Density-based Clustering [37, 38] (e.g., Ordering Points To Identify the Clustering Structure [39]). Many of these methods have been successfully applied to data coming from various biological sources.
For the sake of simplicity, the vast amount of bi-ological data coming from the diverse application do-mains have been categorized to a few broad data types. These data types include, Sequences (data generated by Omics technologies, e.g., [gen/ transcript/ epigen/ prote/ metabol]omics [40]),Images (data generated by [bio/ medical/ clinical/ health]-imaging techniques con-taining [sub-]cellular and diagnostic images), and Sig-nals (electrical signals generated by the brain and the muscles and acquired using appropriate sensors at the [Brain/Body]-Machine Interfaces or BMI). Each of these data types originating at diverse biological application domains have witnessed major contributions from the specified ML methods and their variants (see for Se-quences[41],images [42, 43, 44], andsignals[45, 46, 47]). In recent years DL methods are potentially reshap-ing the future of ML and AI [48]. Worthy to mention here that, from a broader perspective, ML has been applied to a range of tasks including anomaly detec-tion [49, 50], biological data mining [51, 52], detecdetec-tion of Corona virus [53, 54], brain disease detection [55, 56, 57], education [58], natural language processing [59], and price prediction [60]. Despite notable popularity and applicability to diverse disciplines [61], there ex-ists no comprehensive review which focuses on pattern recognition in biological data, provides pointers to the various biological data sources and DL tools, and the performances of those tools [51].
Also, considering the ecosystem of modern data anal-ysis using advanced ML techniques (such as DL), pro-viding information about methods’ application only par-tially covers the components of this ecosystem (see the various components of the ecosystem in Fig. 1). The remaining components of the ecosystem include open access data sources and open source toolboxes and li-braries which are used in developing the individual meth-ods. It is therefore of paramount importance to have a complete understanding of the availability of datasets and their characteristics, the capabilities and options offered by the libraries and how they compare with each other in different execution environments such as central processing unit (CPU) and graphical processing unit (GPU). The current paper’s novelty lies in being first of its kind to cover comprehensively the complete ecosystem of modern data analysis using advanced ML technique, i.e., DL.
Therefore, with the above aim, this review provides– a brief overview on DL concepts and their applications to various biological data types; a list of available open access data repositories offering data for method devel-opment; and a list of existing open source libraries and frameworks which can be utilized to harness the power of these techniques along with their relative and perfor-mance comparison. Towards the end, some open issues are identified and some speculative future perspectives are outlined.
The remainder of the article is organized as follows: section 2 provides the conceptual overview and intro-duces the reader to the underlying theory of DL; sec-tion 3 describes the applicasec-tions; secsec-tion 4 lists the open source data repositories; section 5 presents the popular open source DL tools; sections 6 and 7 compares the most popular tools from relative and performance per-spectives. Section 8 presents the reader with some of the open issues and hints on the future perspectives; and finally, the article is concluded in section 9.
2 Overview of Deep Learning
In DL the data representations are learned with in-creasing abstraction levels, i.e., at each level more ab-stract representations are learned by defining them in terms of less abstract representations at lower levels [62]. Through this hierarchical learning process a sys-tem can learn complex representations directly from the raw data [63].
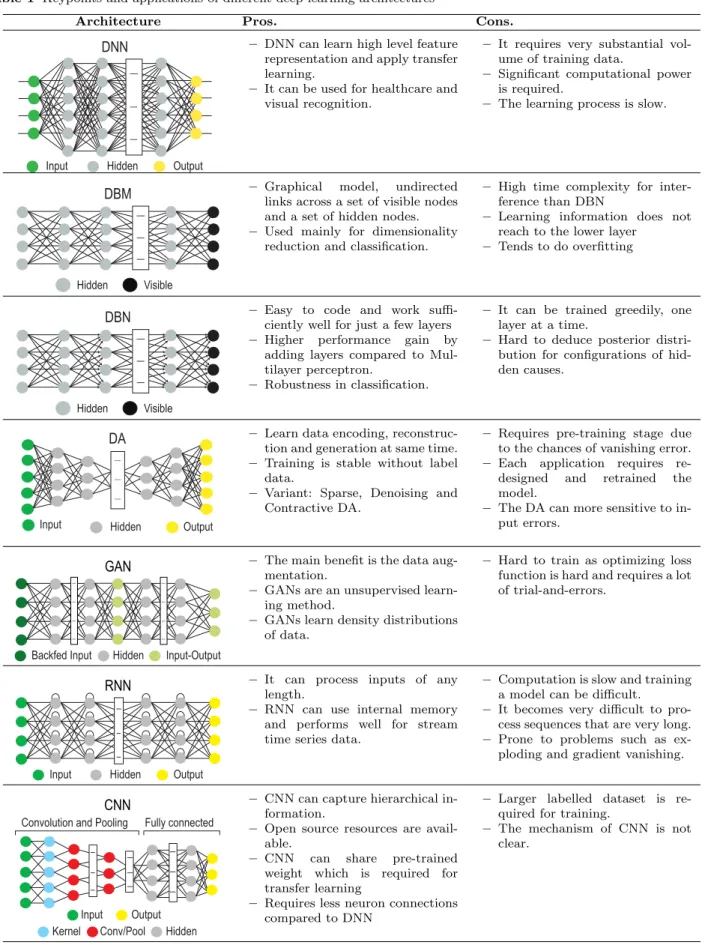
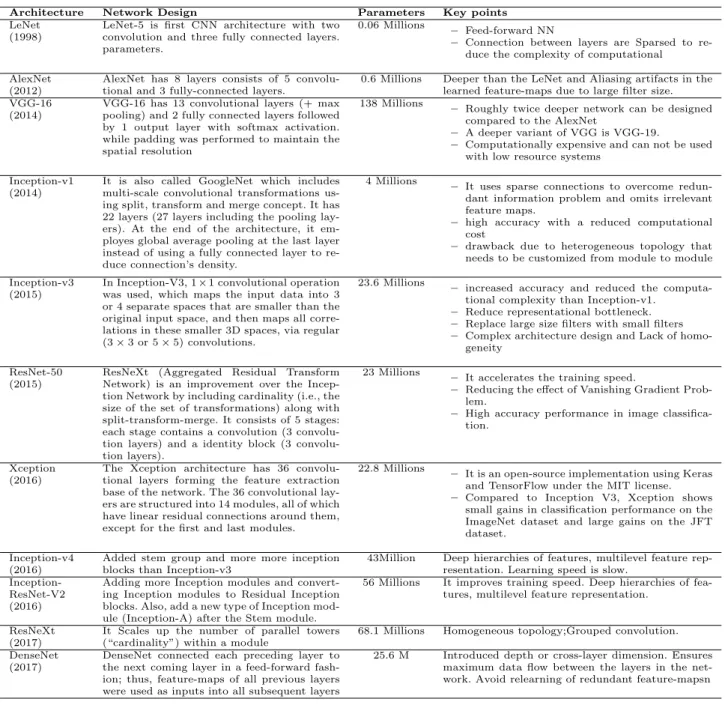
Though many DL architectures have been proposed in the literature for various applications, there has been a consistent preference to use particular variants for bi-ological data. As shown in Fig. 2, the most popular models have been identified as– Deep Neural Network (DNN), Deep Boltzmaan Machine (DBM) and Deep Belief Network (DBN), Deep Autoencoder (DA), Gen-erative Adversarial Network (GAN), Recurrent Neural Network (RNN, including LSTM), and Convolutional Neural Network (CNN). Each of these models’ archi-tectures and their respective pros and cons are listed in Table 1. Therefore, the following subsections intro-duces the reader to each of these most frequently used DL architectures in mining biological data.
2.1 Deep Neural Network (DNN)
A DNN [64] is inspired by the brain’s multilevel visual processing mechanism starting with the cortical area ‘V1’ and then to area ‘V2’, and so on [65]. Mimicking this, the traditional artificial neural network or NN is
Table 1 Keypoints and applications of different deep learning architectures
Architecture Pros. Cons.
DNN
Hidden Output Input
– DNN can learn high level feature representation and apply transfer learning.
– It can be used for healthcare and visual recognition.
– It requires very substantial vol-ume of training data.
– Significant computational power is required.
– The learning process is slow.
DBM
Hidden Visible
– Graphical model, undirected links across a set of visible nodes and a set of hidden nodes. – Used mainly for dimensionality
reduction and classification.
– High time complexity for inter-ference than DBN
– Learning information does not reach to the lower layer
– Tends to do overfitting
DBN
Hidden Visible
– Easy to code and work suffi-ciently well for just a few layers – Higher performance gain by
adding layers compared to Mul-tilayer perceptron.
– Robustness in classification.
– It can be trained greedily, one layer at a time.
– Hard to deduce posterior distri-bution for configurations of hid-den causes.
DA
Output Hidden
Input
– Learn data encoding, reconstruc-tion and generareconstruc-tion at same time. – Training is stable without label
data.
– Variant: Sparse, Denoising and Contractive DA.
– Requires pre-training stage due to the chances of vanishing error. – Each application requires re-designed and retrained the model.
– The DA can more sensitive to in-put errors.
Input-Output Hidden
Backfed Input
GAN – The main benefit is the data aug-mentation.
– GANs are an unsupervised learn-ing method.
– GANs learn density distributions of data.
– Hard to train as optimizing loss function is hard and requires a lot of trial-and-errors.
Output Hidden
Input
RNN – It can process inputs of any length.
– RNN can use internal memory and performs well for stream time series data.
– Computation is slow and training a model can be difficult.
– It becomes very difficult to pro-cess sequences that are very long. – Prone to problems such as ex-ploding and gradient vanishing.
Convolution and Pooling Fully connected
Output Hidden Input
Conv/Pool Kernel
CNN – CNN can capture hierarchical in-formation.
– Open source resources are avail-able.
– CNN can share pre-trained weight which is required for transfer learning
– Requires less neuron connections compared to DNN
– Larger labelled dataset is re-quired for training.
– The mechanism of CNN is not clear.
Legend: DA: Deep Autoencoder; DBN: Deep Belief Network; RNN: Recurrent Neural Network; DNN: Deep Neural Network; DBM: Deep Boltzmann Machine; CNN: Convolutonal Neural Network.
A
B
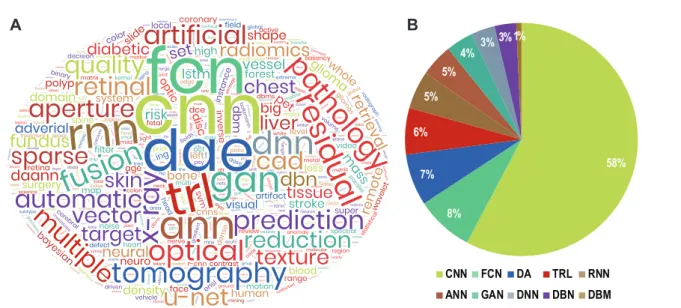
CNN FCN DA TRL RNN ANN GAN DNN DBN DBM 58% 8% 7% 6% 5% 5% 4% 3% 3%1%Fig. 2 Application of different DL models to biological data. (A) Wordcloud generated using author keywords extracted
from research papers published between January 2011 and March 2020 which mentioned analysis of biological data (images, signals and sequences) using DL techniques and indexed in the Scopus database. The keywords were pruned to highlight the analysis methods. (B) Distribution of published papers mentioning the usage of top 10 techniques. The colours of the individual pies match the colours in the wordcloud. Legend— CNN: Convolutional Neural Network, FCN: Fully Connected Network, DA[E]: Deep Autoencoder, TRL: Transfer Learning, RNN: Recurrent Neural Network (including Long-Short Term Memory or LSTM), ANN: Artificial Neural Network, GAN: Generative Adversarial Network, DNN: Deep Neural Network, DBN: Deep Belief Network, DBM: Deep Boltzmaan Machine.
extended with additional hidden layers containing non-linear computational units in each of these hidden layers to learn a subset of the given representations. Despite its successful usage in a range of different applications, the main drawback has been the slow and cumbersome training process [66].
2.2 [Restricted] Boltzmann Machines ([R]BM)
[R]BM represents specific probability distributions through a undirected probabilistic generative model [67]. Con-sidered as a nonlinear feature detector, [R]BM is trained based on optimising its parameters for a set of given ob-servations to obtain the best possible fit of the probabil-ity distribution through a Markov Chain Monte Carlo method known as Gibbs sampling [68, 69]. With sym-metrical connections among subsequent units in multi-ple hidden layers, BM has only one visible layer. The main drawback of the standard BM is that, the learning process is computationally expensive and quite slow. Due to this a BM requires a long period to reach equilib-rium statistics [62]. However, this learning inefficiency can be solved by forming a bipartite graph (i.e., re-stricting to have one hidden layer and one visible layer) [67]. To extend this shallow architecture to a deep one, multiple RBMs as unitary learning elements are stacked together and this yields the following two DL architec-tures.
2.2.1 Deep Boltzmann Machine (DBM)
DBM [70] is a stack of undirected RBMs which supports a feedback mechanism among the layers to facilitate in-ference from higher level units to propagate to lower level units. This allows an input to be alternatively in-terpreted through concurrent competition at all levels of the model. Despite this powerful inference mecha-nism, estimating model parameters from data remains a challenge and cannot be solved using traditional gra-dient based methods (e.g., persistent contrastive diver-gence [71]) [70]. Though this learning problem is over-come by pretraining each RBM in a layerwise greedy fashion, with outputs of the hidden variables from lower layers as input to upper layers [67], the time complexity remains high and the approach may not be suitable for large training datasets [72].
2.2.2 Deep Belief Network (DBN)
DBN [73], in contrast to the DBM, is formed by stack-ing several RBMs together in a way that one RBM’s latent layer is linked to the next RBM’s visible layer. As the top two layers of DBN are undirected, the con-nections are downward directed to its immediate lower layer [73, 74]. Thus, the DBN is a hybrid model with the first two layers as a undirected graphical model and the rest being directed generative model. The differ-ent layers are learned in a layerwise greedy fashion and
fine-tuned based on required output [75], however, the training procedure is computationally demanding.
2.3 Deep Autoencoder (DA)
DA is a DL architecture [76] obtained by stacking a number of data driven Autoencoders which are unsu-pervised elements. DA is also known as DAE, and is designed to reduce data dimension by automatically projecting incoming representations to a lower dimen-sional space than that of the input. In an Autoencoder, equal amounts of units are used in the input/output layers and less units in the hidden layers. (Non)linear transformations are embodied in the hidden layer units to encode the given input into smaller dimensions [77]. Despite the fact that it requires a pre-training stage and suffers from a vanishing error, this architecture is pop-ular for its data compression capability and has many variants, e.g., Denoising Autoencoder [76], Sparse Au-toencoder [78], Variational AuAu-toencoder [79], and Con-tractive Autoencoder [80].
2.4 Generative Adversarial Network (GAN)
GAN [81] is an effective generative model. Generative models perform an unsupervised learning task, where they automatically discover and learn existing patterns in data and then use that knowledge to generate new ex-amples of the learnt pattern as if they were drawn from the original dataset. Using GAN, the problem is seen as a supervised learning problem with two strands– (i) the generator, which generates new examples as trained, and (ii) the discriminator, which classifies generated examples to two classes (real or fake). These genera-tor and discriminagenera-tor models are trained together in a zero-sum game (i.e., in an adversarial fashion) such that the examples generated by the generator model maximise the loss of the discriminator model [82, 83].
2.5 Recurrent Neural Network (RNN)
The RNN architecture [84] is designed to detect spatio-temporal alignments in streams of data [85]. Unlike feedforward NN which performs computations unidirec-tionally from input to output, an RNN computes the current state’s output depending on the outputs of the previous states. Due to this ‘memory’-like property, de-spite learning problems related to vanishing and explod-ing gradients, RNN has gained popularity in many fields involving streaming data (e.g., text mining, time series,
genomes, financial etc.). In recent years, two main vari-ants, bidirectional RNN (BRNN) [86] and long short-term memory (LSTM) [87] have also been applied [48, 88, 89].
2.6 Convolutional Neural Network (CNN)
CNN [90] is a multilayer NN model [91] which has gained popularity in analysing image based data. In-spired by the neurobiology of the visual cortex, the CNN consists of convolutional layer(s) containing a set of learnable filter banks and followed by fully connected layer(s). These filter banks convolve with the input data and pass the results to activation functions (e.g., ReLU, Sigmoid, and Tanh). There also exist subsampling steps in between these layers. The CNN outperforms DNNs, which as they do not scale well with multidimensional locally correlated input data. To address the scaling problem of DNNs, the CNN approach has been quite successful in analysing datasets with a high number of nodes and parameters (e.g., images). As the images are ‘stationary,’ convolution filters (CF) can easily learn data-driven kernels. Applying such CF along with a suitable pooling function reduces the features that are supplied to the fully connected network to classify. How-ever, in case of large datasets even this can be daunt-ing and can be solved usdaunt-ing sparsely connected net-works. Some of the popular CNN configurations in-clude: AlexNet [92], VGGNet [93] GoogLeNet [94] etc. (see Table 2 for a complete list of CNN’s variations with relevant details).
3 Deep Learning and Biological Data
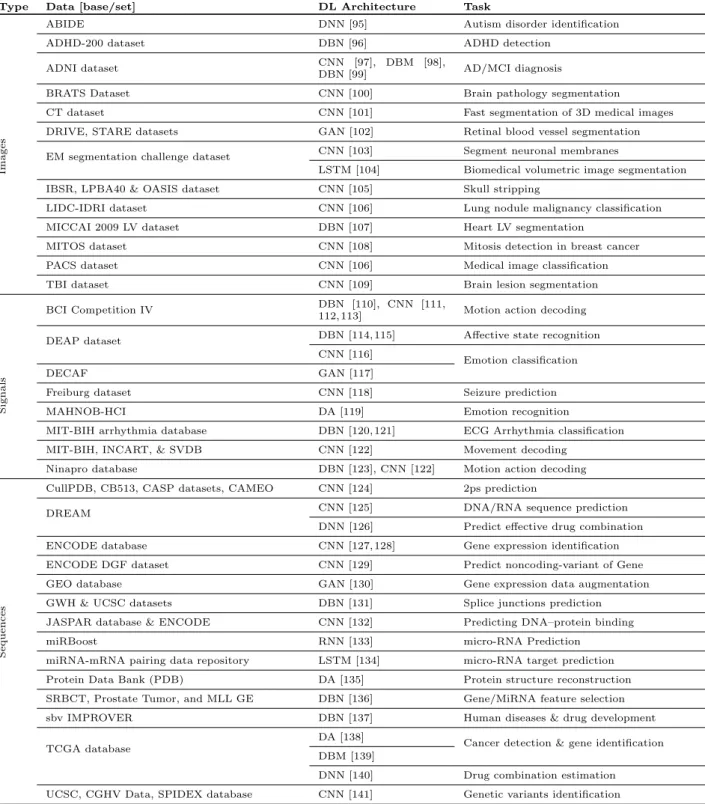
Many studies have been reported in the literature which employ diverse DL architectures with related and var-ied parameter sets (see section 2) to analyze patterns in biological data. For most of the DL architectures, as shown in Fig. 3, the number of publications are in-creasing steadily over the years. A set of randomly se-lected representative studies from the large amount of reported literature are described below and summarised in Table 3. These studies belong to the three data types we have considered within the context of this paper, that is, images, signals and sequences.
3.1 Images
CNN was used by on histology images of the breast to find mitosis [108, 142] and to segment neuronal struc-tures in Electron Microscope Images (EMI) [103]. Havaei
Table 2 Keypoints of different deep CNN architectures
Architecture Network Design Parameters Key points
LeNet (1998)
LeNet-5 is first CNN architecture with two convolution and three fully connected layers. parameters.
0.06 Millions – Feed-forward NN
– Connection between layers are Sparsed to
re-duce the complexity of computational AlexNet
(2012)
AlexNet has 8 layers consists of 5 convolu-tional and 3 fully-connected layers.
0.6 Millions Deeper than the LeNet and Aliasing artifacts in the learned feature-maps due to large filter size. VGG-16
(2014)
VGG-16 has 13 convolutional layers (+ max pooling) and 2 fully connected layers followed by 1 output layer with softmax activation. while padding was performed to maintain the spatial resolution
138 Millions – Roughly twice deeper network can be designed
compared to the AlexNet
– A deeper variant of VGG is VGG-19.
– Computationally expensive and can not be used
with low resource systems Inception-v1
(2014)
It is also called GoogleNet which includes multi-scale convolutional transformations us-ing split, transform and merge concept. It has 22 layers (27 layers including the pooling lay-ers). At the end of the architecture, it em-ployes global average pooling at the last layer instead of using a fully connected layer to re-duce connection’s density.
4 Millions – It uses sparse connections to overcome
redun-dant information problem and omits irrelevant feature maps.
– high accuracy with a reduced computational
cost
– drawback due to heterogeneous topology that
needs to be customized from module to module Inception-v3
(2015)
In Inception-V3, 1×1 convolutional operation was used, which maps the input data into 3 or 4 separate spaces that are smaller than the original input space, and then maps all corre-lations in these smaller 3D spaces, via regular (3×3 or 5×5) convolutions.
23.6 Millions
– increased accuracy and reduced the
computa-tional complexity than Inception-v1. – Reduce representational bottleneck. – Replace large size filters with small filters
– Complex architecture design and Lack of
homo-geneity ResNet-50
(2015)
ResNeXt (Aggregated Residual Transform
Network) is an improvement over the Incep-tion Network by including cardinality (i.e., the size of the set of transformations) along with split-transform-merge. It consists of 5 stages: each stage contains a convolution (3 tion layers) and a identity block (3 convolu-tion layers).
23 Millions – It accelerates the training speed.
– Reducing the effect of Vanishing Gradient Prob-lem.
– High accuracy performance in image classifica-tion.
Xception (2016)
The Xception architecture has 36 convolu-tional layers forming the feature extraction base of the network. The 36 convolutional lay-ers are structured into 14 modules, all of which have linear residual connections around them, except for the first and last modules.
22.8 Millions
– It is an open-source implementation using Keras and TensorFlow under the MIT license.
– Compared to Inception V3, Xception shows
small gains in classification performance on the ImageNet dataset and large gains on the JFT dataset.
Inception-v4 (2016)
Added stem group and more more inception blocks than Inception-v3
43Million Deep hierarchies of features, multilevel feature rep-resentation. Learning speed is slow.
Inception-ResNet-V2 (2016)
Adding more Inception modules and convert-ing Inception modules to Residual Inception blocks. Also, add a new type of Inception mod-ule (Inception-A) after the Stem modmod-ule.
56 Millions It improves training speed. Deep hierarchies of fea-tures, multilevel feature representation.
ResNeXt (2017)
It Scales up the number of parallel towers (“cardinality”) within a module
68.1 Millions Homogeneous topology;Grouped convolution.
DenseNet (2017)
DenseNet connected each preceding layer to the next coming layer in a feed-forward fash-ion; thus, feature-maps of all previous layers were used as inputs into all subsequent layers
25.6 M Introduced depth or cross-layer dimension. Ensures
maximum data flow between the layers in the net-work. Avoid relearning of redundant feature-mapsn
et al. used CNN to segment brain tumor from MRI [100] and Hosseini et al. used it for the diagnosis of AD from MRI [97, 56]. DBM [98] and RBM [99] were used in de-tecting Alzheimer’s Disease (AD) and Mild Cognitive Impairment (MCI) from MRI and PET scans. Again, CNN was used on MRI to detect neuroendocrine car-cinoma [105, 55, 74]. CNN’s dual pathway version was used by Kamnitsas et al. to segment lesions related to tumors, traumatic injuries, and ischemic strokes [109]. CNN was also used by Fritscher et al. for volume seg-mentation [101] and by Cho et al. to find anatomical structures (Lung nodule to classify malignancy) [106] from CT scans. DBN was applied on MRIs to detect
Attention Deficit Hyperactivity Disorder [96] and on cardiac MRIs to segment the heart’s left ventricle [107]. GANs have gained popularity in image synthesis and data augmentation to reduce overfitting. GAN’s appli-cation in data augmentation and image translation has been reviewed in [143] and data augmentation in the CT segmentation tasks was done using CycleGAN [144]. GAN-based framework called MedGAN was proposed for medical image-to-image translation [145]. GAN was used as survival prediction model for chest CT scan images of patients suffering from idiopathic pulmonary fibrosis [146, 147]. GAN was also used by Halicek for
Table 3 Deep learning applied to biological data
Type Data [base/set] DL Architecture Task
Images
ABIDE DNN [95] Autism disorder identification
ADHD-200 dataset DBN [96] ADHD detection
ADNI dataset CNN [97], DBM [98],
DBN [99] AD/MCI diagnosis
BRATS Dataset CNN [100] Brain pathology segmentation
CT dataset CNN [101] Fast segmentation of 3D medical images
DRIVE, STARE datasets GAN [102] Retinal blood vessel segmentation
EM segmentation challenge dataset CNN [103] Segment neuronal membranes
LSTM [104] Biomedical volumetric image segmentation
IBSR, LPBA40 & OASIS dataset CNN [105] Skull stripping
LIDC-IDRI dataset CNN [106] Lung nodule malignancy classification
MICCAI 2009 LV dataset DBN [107] Heart LV segmentation
MITOS dataset CNN [108] Mitosis detection in breast cancer
PACS dataset CNN [106] Medical image classification
TBI dataset CNN [109] Brain lesion segmentation
Signals
BCI Competition IV DBN [110], CNN [111,
112, 113] Motion action decoding
DEAP dataset DBN [114, 115] Affective state recognition
CNN [116]
Emotion classification
DECAF GAN [117]
Freiburg dataset CNN [118] Seizure prediction
MAHNOB-HCI DA [119] Emotion recognition
MIT-BIH arrhythmia database DBN [120, 121] ECG Arrhythmia classification
MIT-BIH, INCART, & SVDB CNN [122] Movement decoding
Ninapro database DBN [123], CNN [122] Motion action decoding
Sequences
CullPDB, CB513, CASP datasets, CAMEO CNN [124] 2ps prediction
DREAM CNN [125] DNA/RNA sequence prediction
DNN [126] Predict effective drug combination
ENCODE database CNN [127, 128] Gene expression identification
ENCODE DGF dataset CNN [129] Predict noncoding-variant of Gene
GEO database GAN [130] Gene expression data augmentation
GWH & UCSC datasets DBN [131] Splice junctions prediction
JASPAR database & ENCODE CNN [132] Predicting DNA–protein binding
miRBoost RNN [133] micro-RNA Prediction
miRNA-mRNA pairing data repository LSTM [134] micro-RNA target prediction
Protein Data Bank (PDB) DA [135] Protein structure reconstruction
SRBCT, Prostate Tumor, and MLL GE DBN [136] Gene/MiRNA feature selection
sbv IMPROVER DBN [137] Human diseases & drug development
TCGA database
DA [138]
Cancer detection & gene identification DBM [139]
DNN [140] Drug combination estimation
UCSC, CGHV Data, SPIDEX database CNN [141] Genetic variants identification
synthesizing hyperspectral images from digitized his-tology of breast cancer cells [148].
3.2 Signals
A stacked DA was employed to detect emotion from EEG signals after extracting relevant features using PCA and reducing nonstationary effect using covariate shift adaptation [119]. DBN was applied to decode mo-tor imagery through classifying EEG signal [110]. For
2015 2016 2017 2018 2019 0 20 40 60 80 100 DNN DBM DBN DA GAN RNN CNN Publications (%) Images
A
0 20 40 60 80 100 DNN DBM DBN DA GAN RNN CNN Publications (%) SignalsB
Sequences 0 20 40 60 80 100 DNN DBM DBN DA GAN RNN CNN Publications (%)C
Fig. 3 Trends in publication involving different DL
architec-tures from 2015 to 2019 in three major types of data – images (A), signals (B), and sequences (C). The number of papers have been normalised within each data type. However, it is noteworthy that the ratio of number of publications involv-ing DL techniques applied to different data types (images, signals, and sequences) are approximately – 1:14:101.
a similar purpose CNN was used with augmented com-mon spatial pattern features [111]. EEG signals were also classified using DA after features such as location, time, and frequency were extracted using CNN [112]. Li et al. used DBN to extract low dimensional latent fea-tures, and select critical channels to classify affective state using EEG signals [114]. Also, Jia et al. used an active learning to train DBN and generative RBMs for the classification [115]. Tripathi et al. utilized DNN and CNN based model for emotion classification [116]. CNN was employed to predict seizures through synchroniza-tion patterns classificasynchroniza-tion [118]. DBN [123] and CNN [122] were used to decode motion action from Ninapro database. The later approach was also used on
MIT-BIH, INCART, & SVDB repositories [122]. Moreover, the ECG Arrhythmias were classified using DBN [120, 121] from the data supplied by MIT-BIH arrhythmia database. Zhu et al. used a GAN model with LSTM and CNN to generate ECG signals with high morphologi-cal similarity [149]. Another GAN model, RPSeqGAN, trained with SeqGAN [150] generated arrhythmic ECG data with five periods and showed high stability and data quality [151]. GAN is also used by Luo and Lu for EEG data augmentation [152]. You et al. [153] and Jiao et al. [154] utilized GAN-based model for detect-ing seizure usdetect-ing EEG signal and Driver sleepiness usdetect-ing EEG and EOG signals, respectively. Singh et al. pro-posed a new GAN framework for denoising ECG [155].
3.3 Sequences
The Stacked Denoising DA has been used to extract fea-tures for cancer diagnosis and classification along with the identification of related genes from gene expression (GE) data [138]. GAN was also used for identifying expression patterns from GE data [156]. A template-based DA learning model was used in reconstructing the protein structures [135]. Lee et al. applied a DBN based unsupervised method to perform auto-prediction of splicing junction at DNA level [131]. Combining DBN with active learning, Ibrahim et al. devised a method to select feature groups from genes or microRNAs (miR-NAs) based on expression profiles [136]. For transla-tional research, bimodal DBNs were used by Chen et al. to predict responses of human cells using model or-ganisms [137]. Pan et al. applied a hybrid CNN-DBN model on RNAs for the prediction of RNA binding pro-tein (RBP) interaction sites and motifs [157], and Ali-panahi et al. used CNN to predict sequence specificities of [D/R]BPs [125]. Denas and Taylor used CNN to pre-process ChIP-seq data and created gene transcription factor activity profiles [127]. CNN was used by Kelley et al. to predict DNA sequence accessibility [128], by Zeng et al. to predict the DBP [132], by Zhou et al. [129] and Huang et al.[141] to find noncoding gene variation, and by Wang et al. to predict secondary protein structure (2ps) [124]. Park et al. used LSTM to predict miRNA precursor [133] and Lee et al. [134] used it to predict miRNA precursors’ targets. GAN was used by Marouf et al. for the realistic generation of single-cell RNA-seq data [130], by Jiang et al. to predict disease gene from RNA-seq data [158], by Zhao et al. as a semi-supervised procedure for predicting drug target binding [159], and by Wang et al. for identifying expression patterns from GE data [156].
4 Open Access Biological Data Sources
Reproducing scientific results, reported as statistically processed quantitative data or carefully selected repre-sentative qualitative data, has been facilitated greatly by data sharing initiatives [160]. In the last few decades many open access data repositories have been made available for this purpose [161]. Indeed many research funders and journals now require data used for studies to be made openly available for verification. To facili-tate method development, here we list the leading and popular open access data repositories pertaining to the Sequences, Images, and Signals data which are summa-rized in Tables 4, 5 and 6, respectively.
4.1 Images
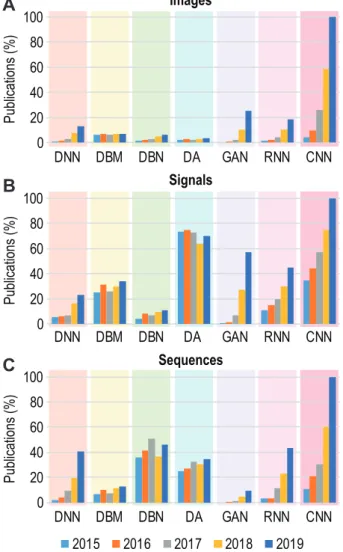
Table 4 lists the leading open access data sources in-cluding databases and individual datasets that provide access to data pertaining to biological image research. For the sake of simplicity, we have grouped these sources to four broad application areas - [Bio/ Medical]-image processing & analysis, disease detection and diagnosis, neuroimage processing & analysis, and segmentation -and are briefly described below.
4.1.1 Bio/Medical]-image Processing and Analysis
The Cell Centered Database (CCDB) [162] collection provides high resolution 3-D light and electron micro-scopic reconstructions of cells and subcellular struc-tures. It also contains [2/3/4]-D protein distribution and structural information from a number of different microscopic image acquisition systems.
Another image library, called the Cell Image Li-brary (CIL) [163], presents more than 10,000 unique datasets and 20 TB of images, videos, and animations data. These data belong to a wide diversity of organ-isms, cell types, and cellular processes.
The Euro Bioimaging [164] database provides bi-ological and biomedical imaging data aiming to pro-vide collaboration among different stakeholders includ-ing scientists, industry, national and European author-ities. Its mission is to give access and services to state-of-the-art imaging techniques and bioimaging data for scientists in Europe and beyond. Euro Bioimaging also includes image analysis tools.
The HAPS is a histology image database [165] con-tains medium/high resolution photograph of microscopic image of human cells and tissues which are free of any copyright. Another image database, the Image Data Resource (IDR) [166], contains individual datasets of cellular and tissue images. The various categories of
images include time-lapse imaging, protein localization studies, digital pathology imaging, yeast study, human high-content screening, etc. It also public API which fa-cilitates viewing, analysis, and sharing of multi-D image data for cell biology.
The SICAS Medical Image Repository (SMIR) is an image repository for medical research purpose. Two of their featured collections include post mortem Full Body CT [167] scan of 50 anonymised subjects of dif-ferent age group and gender, and CT, microCT, seg-mentation and shape models of the cochlea [183].
The Cancer Imaging Archive (TCIA) [168] contains CT, MRI, and nuclear medicine (e.g. PET) images for clinical diagnostic, biomarker and cross-disciplinary in-vestigation. The Stanford Tissue Microarray Database (TMA) [169] is a source for annotated microscopic tis-sue images and associated expression data. The data can be used for studying cell biology. The UCSB bio-segmentation benchmark dataset [170] contains 2/3-D cellular, subcellular and tissue images. These datasets can be used for segmentation and classification task.
4.1.2 Disease Detection and Diagnosis
A large amount of imaging data has been acquired from patients with neurological disorders. The Autism Brain Imaging Data Exchange (ABIDE) [171] database, it includes autism brain imaging datasets for studying the autism spectrum disorder. The other dataset per-tains to the Attention Deficit Hyperactivity Disorder (ADHD) [172] and includes 776 resting-state fMRI and anatomical datasets which are fused over the 8 inde-pendent imaging sites. The phenotypic information in-cludes: age, sex, diagnostic status, measured ADHD symptom, intelligence quotient and medication status. Imaging-based diagnostic classification is the main aim of the ADHD 200 dataset. The ADNI (Alzheimer’s Dis-ease Neuroimaging Initiative [173]) is a popular database and contains neuroimaging datasets from neurodegen-erative diseases, in particular, Alzheimer’s Disease (AD), mild cognitive impairment, early AD and elderly con-trol subjects. The datasets offered by this repository is mainly dedicated for development of novel methods for diseases related to AD. Another dataset focusing on AD is the Open Access Series of Imaging Stud-ies (OASIS) [181] dataset. This contains MRI datasets and open source data management platform (XNAT) to study and analyse AD. Neurosynth [179] is yet an-other database which includes fMRI literature (with some datasets) and synthesis platform to study Brain structure, functions and disease. On the otherhand, the Open Neuroimaging (Open NI) [182] dataset contains imaging Modalities and brain diseases data which can
Table 4 Application-wise categorisation of open access data repositories and datasets pertaining to [bio/medical/health/clinical]-images
Application Name Description Ref.
CCDB High resolution [2/3/4]-D light and electron microscope images [162]
CIL Cell image datasets and cell library app. [163]
[Bio/Medical]-image processing & analysis
Euro Bioimaging Biological and biomedical imaging data [164]
HAPS Microscopic image of human cells and tissues [165]
IDR Viewing, analysis, and sharing of multi-D image data [166]
SMIR Post mortem CT scans of the whole body [167]
TCIA CT, MRI, and PET images of cancer patients [168]
TMA Microscopic tissue images of human [169]
UCSB BioSeg 2D/3D cellular, subcellular and tissue images [170]
ABIDE Autism brain imaging datasets [171]
ADHD-200 fMRI/anatomical datasets fused over the 8 imaging sites [172]
ADNI MCI, early AD & elderly control subjects’ diagnosis data [173]
BCDR Multimodal mammography and ultrasound scan data [174]
Disease detection and
diagnosis
Kaggle CXRayP Chest X-ray scans for pneumonia [175]
MITOS Breast cancer histological images [176]
NAMIC Lupus, Brain, Prostate MRI scans [177]
nCOV-CXray COVID-19 cases with chest X-ray/CT images [178]
Neurosynth fMRI datasets and synthesis platform [179]
NIH Labelled chest x-ray images with diagnoses [180]
OASIS MRI datasets and XNAT data management platform [181]
Open NI Imaging Modalities and brain diseases data [182]
SMIR CT of Human temporal bones [183]
Neuroimage processing
& analysis
IXI It provides neuroimaging data and toolkit software [184]
LPBA40 Maps of brain regions and a set of whole-head MRI [185]
NeuroVault.org API for collecting and sharing statistical maps of brain [186]
NITRC MRI, PET, SPECT, CT, MEG/EEG and optical imaging [187]
OpenfMRI Multimodal MRI &EEG datasets [188]
UK data service fMRI dataset [189]
Segmentation DRIVE Digital Retinal Images diabetic patient [190]
IBSR Segmentation results of MRI data [191]
STARE The dataset contains raw/labelled retinal images [192]
Legend: CXRayP–Chest X-Ray Pneumonia; JHDTI–Johns Hopkins Diffusion Tensor Imaging;
be used to study decision support system for disease identification.
The recent COVID-19 pandemic has attracted a number of researchers to focus their attention is the de-tection of the novel corona virus disease. The NIH [180] nCOV Chest Xray database [178] contains COVID-19 cases with chest X-ray/CT images. The data can be used for identifying Bacterial vs Viral vs COVID-19 Pneumonia. Similar Chest Xray datasets [175] are hosted by Kaggle which include chest X-ray scans data for de-tecting traditional viral and bacterial pneumonia.
Breast cancer is also another important disease which can be addressed through imaging and this has at-tracted a number of databased hosting breast cancer images. The Breast Cancer Digital Repository (BCDR)
[174] database contains multimodal mammography and ultrasound scan, patient history etc. data collected from 1734 anonymised patients. The data can be used for dis-ease detection and diagnosis methods. Another dataset, MITOS [176] contains breast cancer histological images (haematoxylin and eosin stained slides). The detection of mitosis and evaluation of nuclear atypia are key uses.
4.1.3 Neuroimage Processing and Analysis
The Information eXtraction from Images (IXI) dataset [184] provides 600 MRI images from healthy subjects to study brain functions. These images saved in NIFTI file format and were acquired using protocol - T1, T2, proton-density weighted images; magnetic resonance
an-giography images; and diffusion weighted images. These images have been collected from three different hos-pitals in London, UK. Another database, called the Loni Probabilistic Brain Atlas (LPBA40) [185], con-tains maps of brain anatomic regions of 40 human vol-unteers. Each map generates a set of whole-head MRI whereas each MRI describes to identify 56 structures of brain, most of them lies in the cortex. The study of skull-stripped MRI volumes, and classification of the native-space MRI, probabilistic maps are key uses of LPBA40. The NeuroVault.org [186] is a web-based repos-itory (API) for collecting and sharing statistical maps of the human brain to study human brain regions. The Neuroimaging Informatics Tools and Resources Clear-ing house (NITRC) [187], provides range of imagClear-ing data from MRI to PET, SPECT, CT, MEG/ EEG and optical imaging for analysing functional and structural neuroimages. The Open fMRI [188] dataset contains MRI images acquired using different modalities includ-ing Diffusion-weighted, T1-weighted magnetization pre-pared rapid acquisition with gradient echo (MPRAGE) MRI, and multi-echo fast low angle shot (FLASH) MRI. It also contains biosignal datasets to study brain re-gions and its functions. These can be used as a bench-mark dataset in order to differentiate outcome from various neuroimaging analysis tools. The UK data ser-vice [189] contains T1/2, Diffusion Tensor Imaging and fMRI datasets from 22 patients suffering from brain tumors which can be useful for studying brain tumour surgical planning.
4.1.4 Segmentation
Segmentation is an important step in any image pro-cessing pipeline. Many datasets mentioned above can be used for segmentation purposes.
Focusing on eye diseases, the Digital Retinal Images for Vessel Extraction (DRIVE) contains JPEG Com-pressed retinal images of 400 diabetic patient of 25-90 years old. The dataset can be used to understand seg-mentation of blood vessels in retinal images and iden-tify diabetic retinopathy. Another dataset called STruc-tured Analysis of the Retina (STARE) was initiated in 1975. The project contains datasets of 400 raw retinal images, 10 labelled images of artery/vein and 80 im-ages with ground truth. Each image is annotated and features are shown in image by the expert. The dataset can be used for blood vessel segmentation and optic nerve detection.
The Internet Brain Segmentation Repository (IBSR) gives segmentation results of MRI data. Development of segmentation methods is the main application of this IBSR.
4.2 Signals
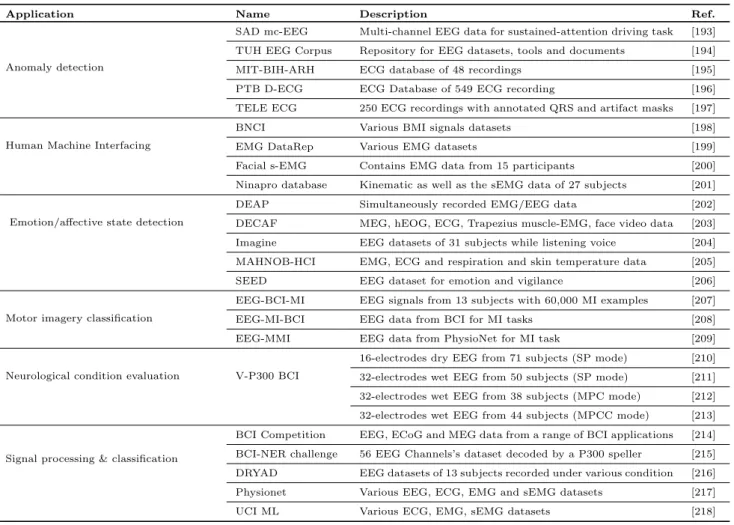
Table 5 lists leading open access data repositories and datasets (also referred as data sources) pertaining to bi-ological signals. These sources are broadly mapped to six application areas – Anomaly detection, human ma-chine interfacing which includes brain mama-chine interfac-ing as well as rehabilitation research, emotion/affective state detection, motor imagery classification, neurologi-cal condition evaluation, and signal processing and clas-sification – which are described in the following subsec-tions.
4.2.1 Anomaly Detection
Anomaly detection is one of the major application areas in which scientists have devoted much efforts. In this process, a number of open access data sources, largely containing EEG and ECG data, have been frequently used.
Starting with the EEG signals, the SAD mc-EEG [193] dataset contains 32 channel EEG signals from 27 subjects recorded while they were test-driving. That is, signals were acquired when each subject attended two 90 minutes virtual reality session for sustained-attention driving. The TUH EEG corpus [194] is also an open-source clinical EEG data repository for clinical EEG data, tool and documentation. The major datasets include seizure detection, abnormal EEG, EEG with ar-tifacts (introduced by eye movement, chewing, shiver-ing, electrode pop, electrode static, and lead artifacts, and muscle artifacts), EEG for epilepsy, etc.
Regarding the ECG signals, the MIT-BIH arrhyth-mia [195] arrhytharrhyth-mia database includes 2 channel am-bulatory ECG recording taken from 47 subjects for studying arrhythmia. There are 48 complete ECG records and about 24 recordings are freely available. The PTB diagnostic ECG database [196] comprises of 549 ECG recording taken from 290 subjects of age ranged from 17 to 87 years using the conventional 12 leads ECG recorder. Each recording includes 15 signals when the subject was given 1 to 5 records. Both the datasets can be used for anomaly detection. Another ECG dataset, the TELE-ECG dataset [197], includes 250 ECG records with annotated QRS and artifact masks. It also includes QRS and artifact detection algorithms to Study QRS and artifact detection from the ECG signal.
4.2.2 Human Machine Interfacing
The application area of Human Machine Interfacing fo-cuses on body and brain machine interfacing and reha-bilitation. This is done largely through EMG and and sometimes with EEG signals.
Table 5 Application-wise categorisation of open access data repositories and datasets pertaining to biological signals
Application Name Description Ref.
Anomaly detection
SAD mc-EEG Multi-channel EEG data for sustained-attention driving task [193]
TUH EEG Corpus Repository for EEG datasets, tools and documents [194]
MIT-BIH-ARH ECG database of 48 recordings [195]
PTB D-ECG ECG Database of 549 ECG recording [196]
TELE ECG 250 ECG recordings with annotated QRS and artifact masks [197]
Human Machine Interfacing
BNCI Various BMI signals datasets [198]
EMG DataRep Various EMG datasets [199]
Facial s-EMG Contains EMG data from 15 participants [200]
Ninapro database Kinematic as well as the sEMG data of 27 subjects [201]
Emotion/affective state detection
DEAP Simultaneously recorded EMG/EEG data [202]
DECAF MEG, hEOG, ECG, Trapezius muscle-EMG, face video data [203]
Imagine EEG datasets of 31 subjects while listening voice [204]
MAHNOB-HCI EMG, ECG and respiration and skin temperature data [205]
SEED EEG dataset for emotion and vigilance [206]
Motor imagery classification
EEG-BCI-MI EEG signals from 13 subjects with 60,000 MI examples [207]
EEG-MI-BCI EEG data from BCI for MI tasks [208]
EEG-MMI EEG data from PhysioNet for MI task [209]
Neurological condition evaluation V-P300 BCI
16-electrodes dry EEG from 71 subjects (SP mode) [210]
32-electrodes wet EEG from 50 subjects (SP mode) [211]
32-electrodes wet EEG from 38 subjects (MPC mode) [212]
32-electrodes wet EEG from 44 subjects (MPCC mode) [213]
Signal processing & classification
BCI Competition EEG, ECoG and MEG data from a range of BCI applications [214]
BCI-NER challenge 56 EEG Channels’s dataset decoded by a P300 speller [215]
DRYAD EEG datasets of 13 subjects recorded under various condition [216]
Physionet Various EEG, ECG, EMG and sEMG datasets [217]
UCI ML Various ECG, EMG, sEMG datasets [218]
Legend: MI– Motor Imagery; MMI– Motor Movement/Imagery; ERP– Event Related Potentials, SADmc-EEG– Sustained-Attention Driving multi-channel EEG; V-P300– Visual P300; SP– Single Player; MP– Multi-Player; BCI-SSVEP–Steady State Visual Evoked Potentials; EMG
DataRep–EMG Datasets Repository; ARH– arrhythmia; D-ECG– Diagnostic ECG.
The BNCI Horizon 2020 database contains more than 25 datasets such as stimulated EEG datasets, ECoG-based BCI datasets, ERP-ECoG-based BCI datasets, mental arithmetic, motor imagery (extracted from EEG, EOG, fNIRS, EMG) datasets, EEG/EOG datasets of Neuro-prosthetic control, speller datasets. Modelling and de-signing of BMI devices are the key application of this database. While the BNCI contains a variety of sig-nals, the EMG Datasets Repepository [199] includes single/ multi finger movements datasets of 2 channels, 10 classes and 8 channels, 15 classes; single/ multi fin-gers pressure on a steering wheel; EMG controlled mul-tifunctional upper-limb prostheses and EMG pattern recognition datasets.
For surface EMG (sEMG), the facial s-EMG dataset contains facial s-EMG signals from the muscles corru-gator supercilii, zygomaticus major, orbicularis oris, or-bicularis oculi, and masseter. Archived data is from 15 participants (8 females and 7 males) aged between 26 and 57 years (mean age 40.7±9.6 years). This data can
be used for rehabilitation research. Also, the NinaPro database includes kinematic as well as sEMG data of 27 subjects while these subjects were moving finger, hand and wrist. These data can be employed to study biorobotics and activity detection.
4.2.3 Emotion/Affective State Detection
Emotion and affective state detection has been a very active research field over the years. A combination of different signals has been utilised in detecting emotion and affective states and a number of data sources pro-viding these signals are described below.
A Database for Emotion Analysis using Physiologi-cal Signals (DEAP) provides various datasets for an-alyzing the human affective states. It provides EEG and sEMG signals of 32 volunteers while they were watching music videos to analyse the affective states. These volunteer also rated the video and The front face was also recorded for 22 volunteers. DECAF is
a multimodal dataset for decoding user physiological responses to affective multimedia content. It contains magnetoencephalogram (MEG), horizontal electroocu-logram (hEOG), ECG, Trapezius muscle-EMG, near-infrared face video data to study physiological and men-tal states. Another multimodal dataset is the MAHNOB-HCI [205] dataset which includes ECG, respiration and skin temperature data in addition to 32-channel EEG signals from 30 subjects while they were watching movie clips and photos. The different sensors were synchro-nised to record a synchrosynchro-nised multimodal dataset. The subjects were asked to label their own emotion state.
On the other hand, the Imagined Emotion [204] dataset provides EEG signals recorded when subjects were listening to voice recording. The SJTU Emotion EEG Dataset [206] contains three individual datasets (SEED, SEED-IV and SEED-VIG) of EEG signals. In the SEED dataset EEG signals were recorded while the subjects were watching movie clips and annotated their emotional state as positive, negative and neural. In case of SEED-IV, four emotional states such as happy, sad, fear, and neutral were annotated. Whereas, the SEED-VIG dataset contains EEG signals related to vigilance when the subjects were driving.
4.2.4 Motor Imagery Classification
Motor imagery (MI) is yet another very active area of research. As an outcome of a large number of commu-nity contributors, many datasets have been developed from which the popular ones are described below.
The Electroencephalographic brain-computer inter-face mental imagery (EEG-BCI-MI [207] dataset con-tains 60 hours of EEG recording from 13 subjects and 75 experiments. This contains around 60,000 mental imagery examples which is approximately 4.8 hours of EEG recordings (with 4600 MI examples) per partici-pant. The datasets can be used for the rehabilitation of patients having movement disorders. Another EEG datasets for MI brain computer interface (EEG-MI-BCI) [208] contains EEG signals with 3-D electrode lo-cation and EEG for non-task related states as well. The datasets were recorded from 52 participants which also contain [physio/psyco]logical data and EMG signals in addition to the EEG. These datasets can be employed to find the human factors which influences MI BCI per-formances. Yet another EEG signal centric dataset is called, EEG motor movement/ imagery (EEG-MMI) dataset [209], incorporates 1500 (1 – 2 minutes) EEG recordings taken from 109 volunteers. The dataset can be used in designing BCI-systems for rehabilitation pur-poses.
4.2.5 Neurological condition evaluation
A number of visual P300-based datasets are available with open access attributes to perform a range of neu-rological condition evaluation. These datasets, V-P300 BCI, are composed of data recorded using dry or wet electrode with 16 or 32 channels while the subjects were playing the Brain Invaders game [219]. These datasets were recorded using different playing modalities such as single player (16 dry electrodes [210] from 71 sub-jects and 32 wet electrodes [211] from 50 subsub-jects), multiplayer in collaborative mode (32 wet electrodes from 38 subjects [212]), and multiplayer cooperation and competition mode (32 wet electrodes from 44 sub-jects [213]).
4.2.6 Signal Processing and Classification
To solve various signal processing and classification prob-lems, a number of datasets have been made available under open access. Most of these problems are released to the community in the form of challenges with rele-vant datasets to solve them. The competitions during the BCI meetings have served this purpose for several years and have released datasets (the BCI competition datasets [214]) which are still available with relevant problem statements and sample codes for others to use. The challenge datasets provided by the IEEE Neural Engineering Conference (NER2015) is known as BCI-NER dataset [215]. This dataset was mainly intended for methodological development of an error potential detection algorithm suitable for the P300-based BCI systems. The BCI Competition datasets include EEG datasets (e.g., cortical negativity or positivity, feedback test trials, self-paced key typing, P300 speller paradigm, motor/ mental imagery data, continuous EEG; EEG with eye movement), ECoG datasets (e.g., finger move-ment, motor/ mental imagery signals in the form of EEG/ ECoG) and MEG dataset (e.g., wrist movement). These datasets can be used for signal processing and classification methods for BMI. Similarly, the BCI-NER Challenge [215] dataset provides 56-channel EEG sig-nals from 26 subjects using a P300 speller.
In addition to the datasets released for challenges and competitions, there are repositories which provide rich datasets for this application area. The DRYAD [216] is a versatile repository which has been recently unveiled. It contains a range of EEG recorded datasets when 19 subjects listen to natural speech time-reversed speech, cocktail party attention, and noisy audiovisual speech. The Physionet repository [217] contains a large number of neuroelectric and myoelectric datasets. As the name suggests, it is mainly for physiological data.
These datasets mainly pertain to signals such as EEG, ECoG, EMG, ECG and are acquired from many di-verse experimental settings. The UCI ML repository [218] contains a large number of diverse datasets with direct application to machine learning methods. Some relevant biosignal datasets include ECG, EEG, (s)EMG signals from diverse experimental and physiological con-ditions.
4.3 Sequences
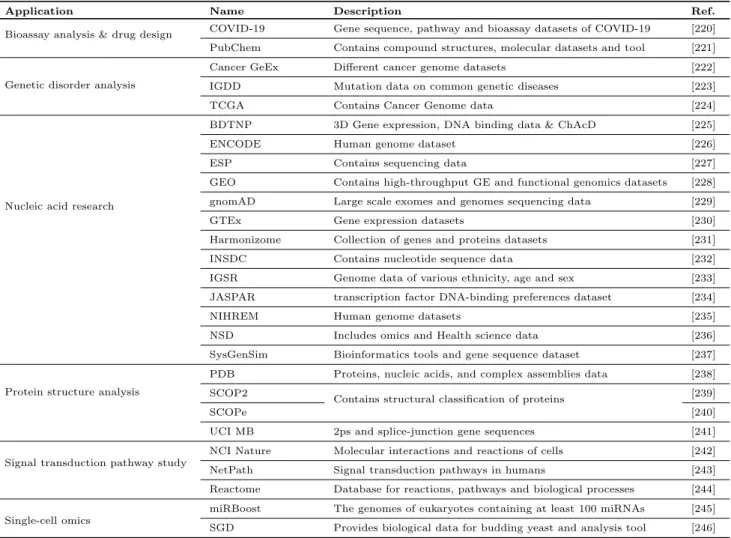
Table 6 lists the leading popular open access data sources pertaining to the various omics related research which includes genomics, proteomics, and metabolomics. Grouped to six broad application areas, namely – bioassay anal-ysis and drug design, genetic disorder analanal-ysis, nucleic acid research, protein structure analysis, signal trans-duction pathway study, and single-cell omics, the fol-lowing subsections provide brief discussions about the leading open access omics data sources.
4.3.1 Bioassay Analysis and Drug Design
Since Decemeber 2019, the world has experienced a pandemic caused by the SARS-CoV-2 (COVID-19) virus. Triggered by the necessity to facilitate the ongoing re-searches, the SARS-CoV-2 [220] dataset provides gene sequence, proteins, pathway and bioassay for SARS-CoV-2 along with compounds used in clinical trials. This dataset can be used for studying biological/chemical process and drug design.
The PubChem database [221] contains millions of compound structures and descriptive datasets of chem-ical molecules and their activities against biologchem-ical as-says. Maintained by the National Center for Biotech-nology Information of the United States National In-stitutes of Health, it can be freely accessed through a web user interface and downloaded via FTP. It also contains software services (such as plotting and clus-tering). It can be use for [gen/prote]-omics study and drug design.
4.3.2 Genetic Disorder Analysis
The cancer gene expression (GE) [222] serves as a small repository containing several cancer GE datasets which can be employed for designing tool/algorithm for can-cer detection. The cancan-cer genome atlas (TCGA) [224] repository contains more than 2.5 petabytes of genomic, epigenomic, transcriptomic, and proteomic data. It con-tains data about 33 different cancer types and over 20,000 samples. These data are generated by the Na-tional Cancer Institute and the NaNa-tional Human Genome
Research Institute. This repository is used in facilitat-ing genomic study for improvfacilitat-ing the prevention, di-agnosis, and treatment of cancer. To analyse region specific diseases, the Indian Genetic Disease Database (IGDD) [223] tracks mutations in the normal genes for genetic diseases reported in India.
4.3.3 Nucleic Acid Research
The Berkeley Drosophila Transcription Network Project (BDTNP) [225] database contains datasets pertaining to 3D Gene expression data, in-vivo and in-vitro DNA binding data as well as Chromatin Accessibility data (ChAcD). Research on GE and anomaly detection are the key applications of the datasets provided by this database.
The Encyclopedia of DNA Elements (ENCODE) [226] is a whole-genome database curated by the EN-CODE Consortium. It contains a large number of datasets pertaining to functional genomics and characterisation data including meta data of human, worm, mouse, and fly. Another database, called the Exome Sequencing Project (ESP) [227], includes genome datasets which can be used to find lung and blood disorders and their management and treatment. The Gene Expression Om-nibus (GEO) [228] is a open access functional genomics (microarray and sequence) data repository. This database can be used for functional genomic and epigenomic stud-ies such as genome methylation, chromatin structure, and genome–protein interactions. It is supported by the National Center for Biotechnology Information at the National Library of Medicine of the USA [228]. The Genome Aggregation Database (gnomAD) [229] database contains large scale exome and genome se-quencing data from different sese-quencing projects. The dataset can be used for disease diagnosis and genetic studies. The Genotype-Tissue Expression (GTEx) [230] database contains GE datasets of 54 healthy tissue sites collected from 1000 subjects and histology images. It also includes samples from GTEx biobank.
The Harmonizome [231] database provides details about genes and proteins from 114 datasets provided by 66 online resources with 71927784 associations be-tween 295496 attributes and 56720 genes. The Interna-tional Nucleotide Sequence Database [232], popularly known as INSDC, corroborates biological data from three major sources: i) DNA Databank of Japan [247], ii) European Nucleotide Archive [248], and iii) Gen-Bank [249]. These sources provide the spectrum of data raw reads, though alignments and assemblies to func-tional annotation, enriched with contextual informa-tion relating to samples and experimental configura-tions. Similar to this, the International Genome
Sam-Table 6 Application-wise categorisation of open access data repositories and datasets pertaining to Omics data
Application Name Description Ref.
Bioassay analysis & drug design COVID-19 Gene sequence, pathway and bioassay datasets of COVID-19 [220]
PubChem Contains compound structures, molecular datasets and tool [221]
Genetic disorder analysis
Cancer GeEx Different cancer genome datasets [222]
IGDD Mutation data on common genetic diseases [223]
TCGA Contains Cancer Genome data [224]
BDTNP 3D Gene expression, DNA binding data & ChAcD [225]
ENCODE Human genome dataset [226]
ESP Contains sequencing data [227]
Nucleic acid research
GEO Contains high-throughput GE and functional genomics datasets [228]
gnomAD Large scale exomes and genomes sequencing data [229]
GTEx Gene expression datasets [230]
Harmonizome Collection of genes and proteins datasets [231]
INSDC Contains nucleotide sequence data [232]
IGSR Genome data of various ethnicity, age and sex [233]
JASPAR transcription factor DNA-binding preferences dataset [234]
NIHREM Human genome datasets [235]
NSD Includes omics and Health science data [236]
SysGenSim Bioinformatics tools and gene sequence dataset [237]
Protein structure analysis
PDB Proteins, nucleic acids, and complex assemblies data [238]
SCOP2
Contains structural classification of proteins [239]
SCOPe [240]
UCI MB 2ps and splice-junction gene sequences [241]
Signal transduction pathway study
NCI Nature Molecular interactions and reactions of cells [242]
NetPath Signal transduction pathways in humans [243]
Reactome Database for reactions, pathways and biological processes [244]
Single-cell omics
miRBoost The genomes of eukaryotes containing at least 100 miRNAs [245]
SGD Provides biological data for budding yeast and analysis tool [246]
ple Resource (IGSR) [233] includes genome sequencing data from 1000 genomes project. The genome data was taken from people of various ethnicity, age and sex with the final dataset contains gene sequencing data from 2,504 individuals from 26 populations. These data can be used for disease diagnosis and genetic studies. Also, the SysGenSim [237] database includes bioinformatics tool, and Pula-Magdeburg single-gene knockout, Stat-Seq and DREAM 5 benchmark datasets for studying Gene Sequence.
JASPAR [234] is a database for transcription fac-tor DNA binding profile. The data spans through six different taxonomic groups covering Vertebrata, Nema-toda, Insecta, Plantae, Fungi, and Urochordata. The database can be used for translational genomics re-search.
The NIH Roadmap Epigenomics Mapping reposi-tory (NIHREM) [235] includes 2,804 datasets, i.e., 1,821 histone modification, 360 DNase, 277 DNA methyla-tion, and 166 RNA-Seq datasets. The repository pro-vides 3,174-fold 150.21 billion mapped sequencing the
human and tools for analyzing these datasets. It can be used for stem cell mapping, selection of tissues that are responsible for human disease. Also, the database known as Nature scientific data (NSD) [236] includes datasets pertaining to omics, taxonomy and species di-versity, mathematical and modelling resources, cytome-try, organism-focused resources and health science data. This can be used for studying and modelling different aspect of genomics.
4.3.4 Protein Structure Analysis
The Protein Data Bank (PDB) [238] contains 3-D struc-tural data proteins and nucleic acids. These data are ob-tained tools such as X-ray crystallography, NMR spec-troscopy, and cryo-electron microscopy. It includes more than 135 thousand data of proteins, nucleic acids, and complex assemblies. These can be used to understand all aspects of biomedicine and agriculture.
Structural classification of proteins or in short SCOP is a repository which hosts manually classified protein
structure datasets. The classification was done based on amino acid sequences and their structural similar-ity. The main objective is to find the evolutionary rela-tionship between the proteins. Currently two versions of SCOP are maintained. The SCOP Version 2 (shortly called SCOP2) [239] is the up to date Structural Classi-fication of Proteins database released at the first quar-ter of 2020. In contrast, the SCOP-extended (SCOPe) [240] is an extended version of the original SCOP main-tained by UC Berkeley. SCOPe includes many new clas-sified protein structures via a fusion of manual and au-tomation curation.
Molecular Biology Databases at the UCI (UCI MB) contains three individual databases: i) Secondary Pro-tein Structure [241], which is a bench repository that classifies secondary structure of certain globular pro-teins; ii) Splice-Junction Gene Sequences [250], which contains primate splice-junction gene sequences (DNA) with associated imperfect domain theory; and iii) Pro-moter Gene Sequences [251], which contains E. Coli promoter gene sequences (DNA) with partial domain theory. Objectives- i) Sequencing and predicting the secondary structure of certain proteins; ii) Study pri-mate splice-junction gene sequences (DNA) with as-sociated imperfect domain theory; iii) Study E. Coli promoter gene sequences (DNA) with partial domain theory.
4.3.5 Signal Transduction Pathway Study
The NCI-Nature Pathway Interaction Database [242] hosts cellular signaling (molecular interactions/reactions) pathways in humans. The database can be employed for cancer research. The database was created by the U.S. National Cancer Institute, NIH with the collaboration of Nature Publishing Group and published in the last quarter of 2006. Another database, NetPath [243], also contains signal transduction pathways in humans. Cre-ated jointly by Johns Hopkins University and the In-stitute of Bioinformatics (IOB) in India, it includes 45 signaling pathway ranging from protein-protein inter-actions to enzyme-protein substrate reinter-actions includ-ing 10 major pathway of immune system and 10 path-way relevant to cancer regulation. The other one, Reac-tome [244], is an open access database hosting biological pathways of metabolic processes to hormonal signalling in humans. Created through a collaboration between North America and Europe, it can be used for cancer research and treatment.
4.3.6 Single-cell Omics
The miRBoost dataset [245] contains the genomes of eukaryotes containing at least 100 miRNAs. This
date-set is used for Studying post-transcriptional gene reg-ulation (PTGeR) and miRNA-related pathology. Sac-charomyces Genome Database (SGD) [246] also pro-vides complete biological information for the budding yeastSaccharomyces cerevisiae. They also give an open source tool for searching and analyzing these data, and thereby enable the discovery of functional relationships between sequence and gene products in fungi and higher organisms. The Study of Genome expression, transcrip-tome and computational biology are main function of the SGD.
5 Open Source Deep Learning Tools
Due to surging interest and concurrent multidisciplinary efforts towards DL in the recent years, several open source libraries, frameworks, and platforms have been made available to the community. However, for a new-comer to the field of biological data mining using these tools, it is not always straight forward to know their characteristics, advantages and disadvantages. In this process, one of the main hurdles for an early analyst is to select the appropriate DL architecture/model and relevant library providing suitable implementations of the selected architecture. Towards introducing a begin-ner to the field of biological data analysis using these open source tools, this section describes them in tutorial style indicating their characteristics, pros and cons. The focus of the section has been to review and summarize the most popular open source tools, which aim to fa-cilitate the technological developments for the commu-nity. This comprehensive collection contains tools (also developed by individuals) which are well maintained with a reasonable amount of implemented algorithms. For the sake of brevity, the individual publication ref-erences of the tools are omitted and interested readers may consult them at their respective websites from the provided urls.
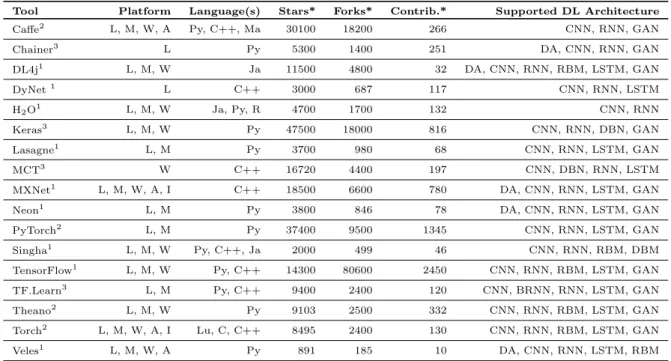
Table 7 summarizes the main features and differ-ences of the various tools. To measure the impact and acceptability of a tool in the community, we provide GitHub based measures such as, numbers of Stars, Forks, and Contributors. These numbers are indicative of the popularity, maturity, and diffusion of a tool in the com-munity.
5.1 Caffe
Caffe (http://caffe.berkeleyvision.org/) is scal-able, written in C++ and provides bindings for Python as well as Matlab. Dedicated for experiment, training,

![Table 4 Application-wise categorisation of open access data repositories and datasets pertaining to [bio/medical/health/clinical]-images](https://thumb-us.123doks.com/thumbv2/123dok_us/9954926.2488080/11.892.74.802.169.792/table-application-categorisation-repositories-datasets-pertaining-medical-clinical.webp)