ON PARALLEL AND SEQUENTIAL DISSOCIATIONS IN ENERGY SELECTED IONS
James P. Kercher
A dissertation submitted to the faculty of the University of North Carolina at Chapel Hill in partial fulfillment of the requirements for the degree of Doctor of Philosophy in the Department of Chemistry.
Chapel Hill 2006
ABSTRACT
JAMES P: KERCHER: On Parallel and Sequential Dissociations in Energy Selected Ions (Under the direction of Tomas Baer)
The ability to extract rate constants and dissociation energies of parallel and sequential dissociation pathways in energy selected ions has been made possible by recent advances in threshold photoelectron photoion coincidence (TPEPICO) spectrometry. The incorporation of velocity focusing optics for improved instrument resolution, the ability to subtract the energetic electron contamination in the threshold signal and a more robust modeling program are the key components in allowing higher energy reactions to be probed. In addition, the recent advances in computational chemistry have allowed the experimental results to be supported quickly and accurately. In many cases it has been used to uncover reaction mechanisms that would otherwise remain hidden.
The work in this thesis is devoted to obtaining kinetic and thermochemical information from higher energy dissociation pathways. Both parallel and sequential reactions are discussed. The broad range molecules for which this technique can be applied makes it both useful and attractive.
ACKNOWLEDGEMENTS
TABLE OF CONTENTS
LIST OF FIGURES: ... xi
LIST OF TABLES:... xiii
LIST OF ABBREVIATIONS:... xiv
LIST OF SYMBOLS: ... xv
CHAPTER 1: Introduction ... 1
1.1. Motivation for studying Parallel and Sequential Dissociations... 1
1.1.1. Thermochemistry of Stable and Unstable Species ... 3
1.1.2. Bond Energies... 3
1.1.3. Testing the Statistical Theories... 4
1.2. Measurement of Bond Energies and Heats of Formation... 5
1.2.1. Photoionization Mass Spectrometry (PIMS) ... 5
1.2.2. Neutral Kinetics ... 6
1.2.3. Negative Ion Cycles... 8
1.2.4. Proton Affinites... 8
1.2.5. Variations of the PEPICO Technique... 9
CHAPTER 2: Experimental Description... 14
2.1. Experimental Apparatus ... 14
2.1.1. Threshold Photoelectron Photoion Coincidence (TPEPICO)... 14
2.1.1.2. Linear Time-of-Flight Mass Spectrometer (LinTOF) ... 18
2.1.2. Photoelectron Spectroscopy... 18
2.1.2.1. Threshold Photoelectron Spectroscopy (TPES) ... 18
2.1.2.2. Ultraviolet Photoelectron Spectroscopy (UPS) ... 19
2.2. Detailed information about the TPEPICO experiment ... 20
2.2.1. Implementation of a Temperature Controlled Inlet system ... 20
2.2.2. Velocity Focusing ... 22
2.2.3. Subtraction of Energetic Electrons ... 24
2.3. Theoretical Approach ... 27
2.3.1. Modeling... 27
2.3.2. Computational Support ... 28
2.3.2.1. Ionization Energies ... 28
2.3.2.2. Thermochemistry ... 28
2.3.2.3. Potential Energy Surfaces... 29
CHAPTER 3: Temperature Controlled TPEPICO Experiments ... 30
3.1. Introduction... 30
3.2. Theoretical Section ... 31
3.3. Results... 32
3.3.1. Ion Time of Flight Distributions... 33
3.3.2. Breakdown Diagrams ... 33
3.3.3. Modeling... 36
3.3.3.1. Room Temperature (298K)... 37
3.3.3.3. Ice Water (273K) ... 38
3.3.3.4. Heated (400K)... 40
3.4. Implications and Discussion ... 40
3.4.1. The Role of Thermal Energy in Ionization... 40
3.4.2. Reaction Mechanism... 44
3.5. Conclusions... 45
CHAPTER 4: The Heat of Formation of the Acetyl Radical and Ion ... 48
4.1. Introduction... 48
4.2. Results... 52
4.2.1. Threshold Photoelectron Spectra ... 52
4.2.2. TPEPICO ... 57
4.2.2.1. Acetone Results ... 57
4.2.2.2. Butanedione Results ... 61
4.3. Thermochemistry ... 63
4.4. Conclusions... 67
CHAPTER 5: Heat of Formation of the Propionyl Ion and Radical ... 72
5.1. Introduction... 72
5.2. Theoretical Methodology... 74
5.3. Results... 78
5.3.1. Photoelectron Spectra ... 78
5.3.2. Threshold Photoelectron Photoion Coincidence... 80
5.3.2.1. Butanone ... 80
5.4. The Heats of Formation of C2H5CO+, C2H5CO•, and C2H5COCOCH3... 89
5.4.1. Experimental... 89
5.4.2. Theoretical ... 91
5.5. Discussion... 92
5.6. Conclusions... 96
CHAPTER 6: Dihalomethane Thermochemistry ... 101
6.1. Introduction... 101
6.2. Theoretical Methodology... 102
6.3. Results... 103
6.4. Dissociation onsets and Thermochemistry ... 112
6.5. Conclusions... 118
CHAPTER 7: Dissociation Dynamics of Sequential Ionic Reactions Heats of Formation of Tri-, Di-, and Monoethyl Phosphine... 123
7.1. Introduction... 123
7.2. Theoretical Methodology... 128
7.2.1. Modeling... 128
7.2.2. Ionization Energies ... 128
7.2.3. Thermochemistry ... 129
7.2.4. Potential Energy Surfaces... 129
7.3. Synthesis of Monoethyl Phosphine... 130
7.4. Results... 131
7.4.1. Determination of Ionization Energies... 131
7.4.2. TPEPICO Results and Analysis... 134
7.4.2.2. Diethyl Phosphine... 143
7.4.2.3. Monoethyl Phosphine ... 149
7.5. Thermochemistry ... 150
7.6. Discussion... 151
7.7. Conclusions... 157
CHAPTER 8: On the Dissociation of the 2-Pentanone Ion... 162
8.1. Introduction... 162
8.2. Theoretical Methodology... 163
8.3. Results... 165
8.3.1. Time-of-Flight Distributions and the Breakdown Diagram ... 165
8.3.2. Simulation of Experimental Results ... 170
8.4. Theoretical Results for Product Identification... 175
8.5. Experimental and Theoretical Thermochemistry ... 176
8.6. Discussion... 179
LIST OF FIGURES
Figure 2.1. ... 16
Figure 2.2 ... 21
Figure 2.3 ... 23
Figure 2.4. ... 26
Figure 3.1 ... 34
Figure 3.2 ... 35
Figure 3.3. ... 39
Figure 3.4 ... 41
Figure 4.1 ... 53
Figure 4.2. ... 55
Figure 4.3 ... 56
Figure 4.4 ... 58
Figure 4.5. ... 62
Figure 5.1 ... 77
Figure 5.2 ... 79
Figure 5.3. ... 81
Figure 5.4 ... 86
Figure 5.5 ... 88
Figure 6.1. ... 104
Figure 6.2 ... 106
Figure 6.4. ... 108
Figure 6.5 ... 109
Figure 6.6 ... 110
Figure 6.7. ... 111
Figure 6.8 ... 114
Figure 7.1 ... 132
Figure 7.2. ... 133
Figure 7.3 ... 135
Figure 7.4 ... 136
Figure 7.5. ... 138
Figure 7.6 ... 139
Figure 7.7 ... 144
Figure 7.8. ... 145
Figure 7.9 ... 147
Figure 7.10 ... 148
Figure 7.11. ... 152
Figure 7.12 ... 154
Figure 8.1 ... 166
Figure 8.2. ... 167
LIST OF TABLES
Harmonic vibrational frequencies calculated at the B3LYP/6-311+g*
level of theory for relevent species . ... 32
Iodobutane neutral and ion frequencies (<1000 cm-1) and the contribution to the overall thermal enrgy... 43
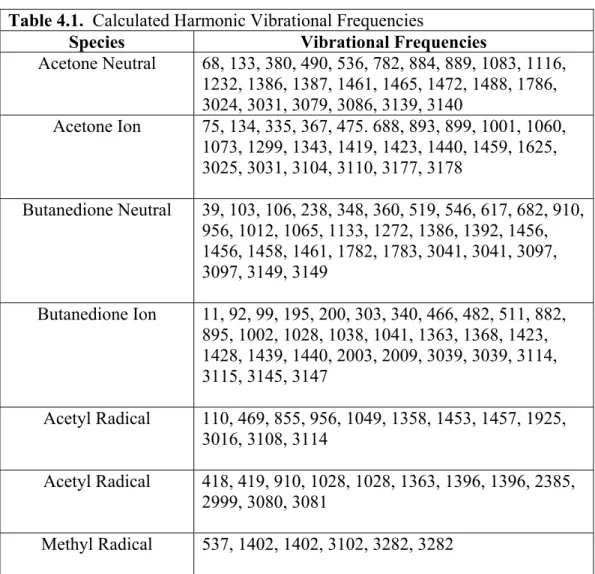
Calculated harmonic vibrational frequencies... 60
Ancillary Heats of Formation. ... 64
Experimental measurements of the ∆fHo[CH3CO+]... 65
Experimental measurements of the ∆fHo[CH3CO•] ... 66
Calculated Vibrational Frequencies for Relevent Species... 75
Ancillary Heats of Formation ... 90
Heats of Formation of C2H5CO+, C2H5CO•, and C2H5COCOCH3+... 90
Determined 0K neutral C−C bond energies... 95
Calculated neutral and ionic vibrational frequencies... 103
Summary of the Thermochemical Results (kJ/mol) for the dihalomethanes... 116
Calculated harmonic vibrational frequencies of relevent species at the B3LYP/6-311+G**. ... 127
Comparison of the Calculated and Experimental Ionization Energies ... 130
Dissociation onsets for C2H4 loss channels ... 150
Heats of Formation for the ethyl phosphine ions and neutrals. ... 151
Ancillary Thermochemical Data... 156
Calculated vibrational frequencies... 164
Experimental and Calculated Dissociation Onsets. ... 169
LIST OF ABBREVIATIONS
AE: Appearance Energy BE: Bond Energy EA: Electron Affinity Eint: Ion Internal Energy hv: Photon energy IE: Ionization Energy KE: Kinetic energy MCP: Multichannel Plate PA: Proton Affinty
PES: Photoelectron Spectroscopy
TPEPICO: Threshold Photoelectron Photoion Coincidence TOF: Time-of-flight
VUV: Vacuum ultraviolet
LIST OF SYMBOLS
∆fHo: Acidity
∆fHo: Heat of Formation
∆rxnHo: Heat of Reaction
CHAPTER 1:
Introduction
1.1. Motivation for studying Parallel and Sequential Dissociations
The complex mass spectra with their large number of fragment ion peaks attest to the numerous dissociation paths available to ions excited by moderate energy electron impact. In addition to the lowest energy dissociation pathway, ions fragment via parallel or sequential pathways at higher energies. These parallel and sequential pathways have been investigated for many years in the form of breakdown diagrams, the fractional ion abundance of each species as a function of the parent ion internal energy1. The ability to extract kinetic and thermochemical information, with well-established error limits, from these reactions is of both practical and fundamental interest.
by photoionization and the resulting ions are detected by time of flight mass spectrometry. These spectra yield the ion abundances resulting from the dissociation of the energy selected ions. The integrated TOF peak areas for each ion are plotted as a function of the photon energy to obtain a breakdown diagram. At low photon energies, only the parent ion is observed. The parent ion signal drops to zero as the ion internal energy increases past the first dissociation limit. This onset is relatively sharp and can be modeled assuming a room temperature thermal energy distribution. As the photon energy increases, other reaction pathways become available.
Dissociation onsets of higher energy channels are more difficult to establish because the onsets are not sharp. The appearance of the ion in the breakdown diagram blends smoothly into the background. The two classes of high energy dissociation reactions are shown in equations 1.1 and 1.2 as parallel and sequential reactions, respectively. The electron associated with the products are not shown.
A+ + BC•←ABC + hν→ AB+ +C• (1.1)
ABC + hν→ AB+ +C•→ A+ + B• + C• (1.2)
The A+ ion yield depends on the relative tightness of the two competing transition states. For the sequential reaction, the yield of the A+ ion depends on the energy partitioning between the AB+ ion and the C• ligand in the first step. This is modeled by assuming the excess energy is partitioned statistically between the translational, rotational, and vibrational degrees of freedom of the AB+ ion and C• ligand. Thus, the A+ onset is modeled without reference to the transition state.
1.1.1. Thermochemistry of Stable and Unstable Species
As mentioned above, the practical importance is the ability to determine thermochemical information of ions, neutrals and radicals by measuring the dissociation onset, E0, of ionic reactions. The E0 for a sample reaction, AB + hν → A+ + B● + e- , is related to the heats of formation of the products and neutrals by equation 1.3.
] [ ]
[ ]
[
0 H A H B H AB
E o
f o
f o
f +∆ −∆
∆
= + • (1.3)
If two of the three heats of formation are known the third can be determined. In many cases, organometallic complexes such as Co(CO)3NO6, two of three heats of formation are not known for the first dissociation pathway. However, complete dissociation of the neutral precursor, Co(CO)3NO + hν → Co+ + 3 CO + NO, via higher energy sequential pathways yields products whose heats of formation are well known so that a thermochemical cycle can be used to establish the unknown energies. In order to obtain heats of formation from the complete dissociation of the parent ion, high energy reactions must be modeled accurately and the error limits extracted.
1.1.2. Bond Energies
would benefit by knowing accurate bond energies. Atmospheric and combustion models require accurate energies in order to provide useful results as they afford insight into the stability of radical species. Experimental bond energies also provide a foundation for testing ab initio or empirical calculations.
Bond energies are obtained through a thermochemical cycle. For example, the C−H bond energy, BE[C−H], in acetaldehyde is related to the heats of formation, ∆fHo, of the products and reactant as illustrated in equation 1.4.
] [ ] [ ] [ ]
[C H H CH3CO H H H CH3COH
BE o
f o
f o
f +∆ −∆
∆ =
− • • (1.4)
If the heats of formation of all three species are known, the bond energy can be determined. TPEPCIO experiments provide thermochemical information about ions, neutrals and radicals making it a useful tool for determining bond dissociation energies.
1.1.3. Testing the Statistical Theories
The statistical theory of unimolecular reactions has been widely applied to both ionic and neutral systems1. Most commonly, it is used to model a single reaction step, whose rate has been measured as a function of the internal energy or temperature of the neutral or ionic precursor. The theory, in the framework of neutral thermal reactions, was worked out by Rice, Ramsperger, Kassel and Marcus and is known as RRKM theory. Independently, the quasi-equilibrium theory (QET) was laid out by Rosenstock and Wahrharftig8 to address mass spectrometric results. It was later shown that these theories are identical, resulting in what is now known as RRKM-QET theory.
acquires enough energy for reaction. It was here in Chapel Hill where the RRK theory was extended, with the help of Marcus, by incorporating the concept of the transition state12.
1.2. Measurement of Bond Energies and Heats of Formation
There are several methods used to determine the bond energies and heats of formation of ions and neutrals. They differ not only in the experimental technique but also in their dependence on ancillary themochemical quantities. By using several different methods7, weak links in the thermochemical literature can be uncovered and a self consistent set of thermochemical quantites can be obtained. It is for this reason that thermochemical quantities should be measured by more than one method.
1.2.1. Photoionization Mass Spectrometry (PIMS)
The appearance energy, AE298K, of the dissociative reaction RX + hν→ R+ + X• + e-, can be measured by photoionization mass spectrometry13-19. Mass analyzed ions are collected as a function of the photon energy to yield a photoionization efficiency (PIE) spectrum. If the onset is sharp, it can be interpreted as the appearance of the ion in the PIE curve. However, the ion signal often blends smoothly into the background and thus a model is required to extract the dissociation onset. A common procedure is to extrapolate the linear portion of the PIE curve to the baseline and this intercept is called the 298K onset. The 298K onset is converted to a 0K onset, E0, by adding the average thermal energy to the AE298K16.
The E0 is related to the radical ionization energy, IE[R•], and bond energy, BE, by equation 1.5.
If the IE[R•] can be measured accurately by photoelectron spectroscopy (PES) and an accurate AE is available, the bond dissociation energy is obtained. Although the IEs of small radicals such as CH3• are known quite well20, it is often difficult to determine the adiabatic ionization energies of large molecules to a high level of accuracy. This is because there can be very large geometry changes between the neutral and ion ground state resulting in poor transition probability due to unfavorable Franck-Condon factors. As pointed out in equation 1.4, BEs can be determined directly from radical heats of formation.
The determination of the AE298K for a particular daughter ion from photoionization mass spectrometry is relatively simple if the dissociation is fast. However this is not the case when the activation energy is large or when the ions are large. In the event of slowly dissociating ions, the appearance of the daughter ion signal is shifted to higher energies because the ions do not have time do dissociate during mass selection. This is known as the kinetic shift21;22. Experiments that measure only the ion yield are not sensitive to such effects.
1.2.2. Neutral Kinetics
Accurate thermochemical properties of radicals can be obtained from studies of the kinetics of chemical equilibra7;23-25, such as the reaction of an alkane, RH, with a halogen atom, X•.
RH + X•↔ RX + H• (1.6)
known, Keq is obtained which permits the determination of ∆rxnG, and ∆rxnH. If the heats of formation of any three species are known the fourth can be determined.
Ideally, the forward and reverse reactions are studied separately and the rate constants measured independantly. If k1 and k-1 can be determined accurately as a function of the temperature, then the Arrhenius activation energies, E1 and E-1, are obtained7. ∆rxnH is determined directly from E1 − E-1 at the midpoint temperature of the study, usually 298K. This is known as the second law method.
If k1 and k-1 can only be obtained at one temperature, usually 298K, ∆rxnH can still be obtained via the third law method. The equilibrium constant, Keq is given as k1/k-1 and hence
∆rxnG is known. ∆rxnG is related to ∆rxnH and ∆rxnS, so in order to obtain the ∆rxnH, something must be known about ∆rxnS. ∆rxnS is usually obtained from calculated entropies of the reactants and products using partition functions. If R• is a relatively small radical, its structure and vibrational frequencies are known from experiment or ab initio methods, permitting a more accurate determination of radical entropies. If the experiment is not done at 298K, the ∆rxnH and ∆rxnG at 298K are determined from tabulated heat capacities[Berk18].
were on the order of 1-2 kcal/mol for many of the halide reactions. Many of the radical heats of formation were revised to 1-4 kcal/mol higher than initial thought.
1.2.3. Negative Ion Cycles
Another approach to measuring bond energies or heats of formation is through a thermochemical cycle incorporating negative ions33. The gas phase acidity34 of RH (1.7) and the electron affinity of R• (1.8) are common cycles incorporating negative ions.
RH → R− + H+ ∆E = ∆acidHo[RH] (1.7) R−→ R• + e− ∆E = EA[R•] (1.8)
By adding the above reactions along with the ionization energy of H•, one obtains a reaction for the R−H bond energy, RH → R• + H•, where BE[R−H] = ∆acidHo[RH] + EA[R•] − IE[H•]. The acidity34, ∆acidHo, is the enthalpy of proton abstraction for equation 1.7. Although
∆acidHo is often measured using flowing afterglow devices or ICR spectrometers, there are several ways to determine ∆acidHo using equilibrium measurements, thermochemical cycles, bracketing35, photoion pair formation36, and collision induced dissociation37;38. The electron affinity, EA, is the energy required to detach an electron. One method to measure EA is to scan the photon energy to find the photodetachment threshold for the destruction of R− ions 39-41. A second method to determine EA utilizes a fixed frequency laser42. One then measures the kinetic energy of the resulting photoelectrons using an electrostatic energy analyser.
1.2.4. Proton Affinites
Radical heats of formation can also be obtained through proton affinity, PA, measurements, such as described by equation 1.8,
where the ∆E of the reaction is the PA[R=C=O]. In general, the gas phase proton affinity of a molecule is measured using high pressure mass spectrometry under equilibrium conditions. Because it is measured as a relative quantity, the accuracy depends on the knowledge of the PAs of neighboring molecules.
1.2.5. Variations of the PEPICO Technique
Photoelectron photoion coincidence (PEPICO) is a mass spectrometric technique that permits the investigation of energy selected ions in order to obtain dissociation rate contants, k(E), and onsets, E0, which can be related to the reaction thermochemisty43-51. The production of ions in a narrow, selected distribution requires more than an energy-resolved ionization source. Vacuum ultraviolet (VUV) radiation is an energy-energy-resolved ionization source, but the photon energy is distributed between the ion internal energy, Eint, and the kinetic energy of the photoelectron, KE(e−), as described by equation 1.9.
AB + hν→ Eint(AB+) + KE(e−) + IE (1.9)
The principle of PEPICO is to measure only a subset of the ions created, those which are detected in coincidence with energy-selected electrons.
There are two different methods for ion energy selection. The first approach is to use a fixed energy light source, such as a He-discharge lamp, and vary the kinetic energy of the collected electron. The advantage of this method is that it does not require a vacuum monochromator or the pumps to keep it under vacuum. The main disadvantage of this approach is the very low collection efficiency because only a small fraction of electrons are ejected in the direction of the electron energy analyzer.
List of References
(1) Baer, T.; Sztáray, B.; Kercher, J. P.; Lago, A. F.; Bodi, A.; Scull, C.; Palathinkal, D. Phys.Chem.Chem.Phys. 2005, 7, 1507-1513.
(2) Bodi, A.; Kercher, J. P.; Baer, T.; Sztáray, B. J.Phys.Chem.B 2005, 109, 8393-8399. (3) McLafferty, F. J.; McAdoo, D. J.; Smith, J. S.; Kornfeld, R. J.Am.Chem.Soc. 1971,
93, 3720-3730.
(4) Booze, J. A.; Weitzel, K. M.; Baer, T. J.Chem.Phys. 1991, 94, 3649-3656.
(5) Keister, J. W.; Baer, T.; Thissen, R.; Alcaraz, C.; Dutuit, O.; Audier, H.; Troude, V. J.Phys.Chem.A 1998, 102, 1090-1097.
(6) Sztáray, B.; Baer, T. J.Phys.Chem.A 2002, 106, 8046-8053.
(7) Berkowitz, J.; Ellison, G. B.; Gutman, D. J.Phys.Chem. 1994, 98, 2744-2765. (8) Rosenstock, H. M.; Wallenstein, M. B.; Wahrhaftig, A. L.; Eyring, H.
Proc.Natl.Acad.Sci. 1952, 38, 667-678.
(9) Rice, O. K.; Ramsperger, H. C. J.Am.Chem.Soc. 1927, 49, 1617-1629. (10) Rice, O. K.; Ramsperger, H. C. J.Am.Chem.Soc. 1928, 50, 617-620. (11) Kassel, L. S. J.Phys.Chem. 1928, 32, 225-242.
(12) Marcus, R. A.; Rice, O. K. J.Phys.Colloid Chem. 1951, 55, 894-908. (13) Harvey, Z. A.; Traeger, J. C. Eur.J.Mass Spectrom. 2004, 10, 759-766. (14) Harvey, Z. A.; Traeger, J. C. J.Mass Spectrom. 2004, 39, 802-807.
(15) Traeger, J. C.; McLoughlin, R. G. Int.J.Mass Spectrom.Ion.Proc. 1978, 27, 319-333. (16) Traeger, J. C.; McLoughlin, R. G.; Nicholson, A. J. C. J.Am.Chem.Soc. 1982, 104,
5318-5326.
(17) Traeger, J. C. Org.Mass Spectrom. 1985, 20, 223-227.
(18) Traeger, J. C. Int.J.Mass Spectrom.Ion.Proc. 1985, 66, 271-282. (19) Traeger, J. C. Int.J.Mass Spectrom. 2001, 210/211, 181-188.
(22) Troe, J.; Ushakov, V. G.; Viggiano, A. A. J.Phys.Chem.A 2005, 109, xxxx-yyyy. (23) Niiranen, J. T.; Gutman, D.; Krasnoperov, L. N. J.Phys.Chem. 1992, 96, 5881-5886. (24) Seetula, J. A. Phys.Chem.Chem.Phys. 2003, 5, 849-855.
(25) Seetula, J. A. J.Chem.Soc., Faraday Trans. 1998, 94, 3561-3567.
(26) Russell, J. J.; Seetula, J. A.; Timonen, R. S.; Gutman, D.; Nava, D. J.Am.Chem.Soc.
1988, 110, 3084-3091.
(27) Seetula, J. A.; Feng, Y.; Gutman, D.; Seakins, P. W.; Pilling, M. J. J.Phys.Chem.
1991, 95, 1658-1664.
(28) Seakins, P. W.; Pilling, M. J.; Niiranen, J. T.; Gutman, D.; Krasnoperov, L. N. J.Phys.Chem. 1992, 96, 9847-9855.
(29) Seakins, P. W.; Pilling, M. J. J.Phys.Chem. 1991, 95, 9878-9881.
(30) Nicovich, J. M.; vanDijk, C. A.; Kreutter, K. D.; Wine, P. H. J.Phys.Chem. 1991, 95, 9890-9896.
(31) Slagle, I. R.; Gutman, D. J.Am.Chem.Soc. 1985, 107, 5342-5347.
(32) Russell, J. J.; Senkan, S. M.; Seetula, J. A.; Gutman, D. J.Phys.Chem. 1989, 93, 5184-5188.
(33) Ellison, G. B.; Davico, G. E.; Bierbaum, V. M.; DePuy, C. H. Int.J.Mass Spectrom.Ion.Proc. 1996, 156, 109-131.
(34) Bartmess, J. E.; Scott, J. A.; McIver, Jr. R. T. J.Chem.Soc. 1979, 101, 6056-6063. (35) Defrees, D. J.; McIver, Jr. R. T.; Hehre, W. J. J.Am.Chem.Soc. 1980, 102,
3334-3338.
(36) Berkowitz, J. Photoion-Pair Formation; In VUV and Soft X-Ray Photoionization; Becker, U., Shirley, D. A., eds. Plenum Press: N.Y., 1996; pp 263-289.
(37) Cooks, R. G.; Kruger, T. L. J.Am.Chem.Soc. 1977, 99, 1279-1281.
(38) Dang, T. T.; Motell, E. L.; Travers, M. J.; Clifford, E. P.; Ellison, G. B.; DePuy, C. H.; Bierbaum, V. M. Int.J.Mass Spectrom.Ion.Proc. 1993, 123, 171-185.
(39) Jackson, R. L.; Hiberty, P. C.; Brauman, J. I. J.Chem.Phys 1981, 74, 3705-3712. (40) Lykke, K. R.; Mead, R. D.; Lineberger, W. C. Phys.Rev.Lett. 1984, 52, 2221-2224. (41) Mead, R. D.; Lykke, K. R.; Lineberger, W. C.; Marks, J.; Brauman, J. I. J.Chem.Phys
(42) Ellis, Jr. H. B.; Ellison, G. B. J.Chem.Phys 1983, 78, 6541-6558.
(43) Baer, T.; Tsai, B. P.; Smith, D.; Murray, P. T. J.Chem.Phys. 1976, 64, 2460-2465. (44) Baer, T.; Smith, D.; Tsai, B. P.; Werner, A. S. Adv.Mass Spectrom. 1978, 7A, 56-62. (45) Baer, T. J.Am.Chem.Soc. 1980, 102, 2482-2483.
(46) Baer, T. Int.J.Mass Spectrom. 2000, 204.
(47) Keister, J. W.; Tomperi, P.; Baer, T. Int.J.Mass Spectrom.Ion.Proc. 1997, 171, 243-251.
(48) Koizumi, H.; Davalos, J. Z.; Baer, T. Chem.Phys. 2006, 324, 385-392. (49) Koizumi, H.; Baer, T. J.Phys.Chem.A 2004, 108, 5956-5961.
(50) Sztáray, B.; Baer, T. J.Am.Chem.Soc. 2000, 122, 9219-9226.
(51) Weitzel, K. M.; Booze, J. A.; Baer, T. Int.J.Mass Spectrom.Ion.Proc. 1991, 107, 301-317.
CHAPTER 2:
Experimental Description
2.1. Experimental Apparatus
2.1.1. Threshold Photoelectron Photoion Coincidence (TPEPICO)
The threshold photoelectron photoion coincidence (TPEPICO) mass spectrometer, has been described in detail in several previous publications2;52-54. The TPEPICO apparatus consists of a vacuum ultraviolet light source, a monochromator and an experimental chamber housing either a reflecting or linear time-of-flight mass spectrometer. Room−temperature sample vapor is introduced into the ionization region of the experimental chamber through a small stainless steel capillary such that the chamber reaches a constant pressure of 8x10⁻⁶ torr. The sample is ionized with vacuum ultraviolet (VUV) light from a hydrogen discharge lamp dispersed by a 1m normal incidence monochromator. Thus, vacuum ultraviolet light in a continuous energy range from 7-14 eV is obtained in the form of a “many-line” spectrum. The resolution is 9 meV at a photon energy of 10.0 eV. The VUV wavelengths are calibrated by using the Lyman−α and β emissions at 1215.67 and 1025.72 Å, respectively, which are intense lines in the hydrogen lamp spectrum.
velocity focus threshold electrons onto a 1.4 mm aperture at the end of the electron drift region, where a Channeltron detects them. At the same time, energetic electrons focused to concentric rings around the central hole are collected by a second Channeltron after they pass through a 3x5 mm opening located close to the central 1.4 mm hole. This provides a measure of the hot electron signal which contaminates the threshold signal.
The electron and ion signals provide the start and stop signals, respectively for the time-of-flight measurement. The raw output of the detector (channeltron for electrons, MCPs for ions) is amplified and the noise is suppressed by a discriminator. The amplified signal is sent to a time-to-pulse-height converter and finally on to a data acquisition card. Each channeltron (center collector for threshold electrons and ring collector for energetic electrons) is linked to a separate data acquisition card so that two complete time-of-flight distributions are recorded at each photon energy. The ion stop signal is sent to both acquisition cards simultaneously. The TPEPICO counts are recorded and stored in integer bins or channels in the data acquisition software.
2.1.1.1. Reflecting Time-of-Flight Mass Spectrometer (ReTOF)
100 102 104 106 114 116 118 120
metastable
daughter
drift peak
13
C
Parent Ion
TPEPI
C
O
C
ount
s (
a
rb
. uni
ts
)
TOF (
µs)
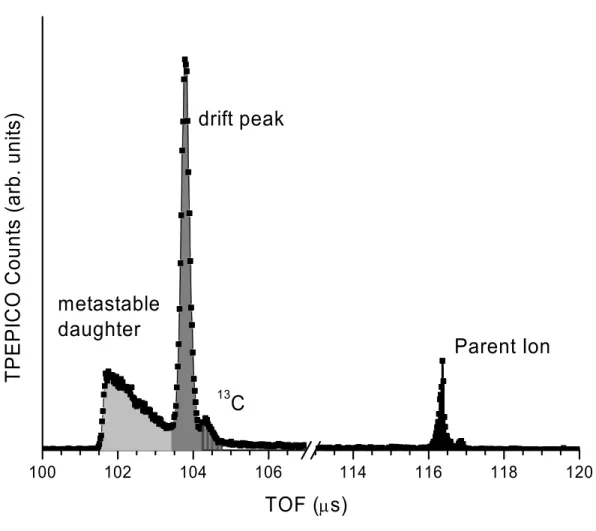
essential to measure the dissociation rate constant as a function of the energy. The experimental rate curve, k(E) can be modeled with the RRKM statistical theory and extrapolated to the E0. A typical TOF distribution for a slow dissociation is shown in Figure 2.1. The light grey region highlights ions which dissociate while being accelerated, giving rise to the asymmetry of the peak. If the rate constant is sufficiently low, some ions will not have time to dissociate in the acceleration region, but will do so in the first drift region. Ions that dissociate in the first drift region do not penetrate as deeply into the reflectron as parent ions and will therefore have a shorted time-of-flight. These ions (dark grey) are thus separated from the parent ions (black) and appear as a drift peak; a sharp, symmetric peak just after the corresponding metastable daughter ion peak. The 13C peak is also present at a slightly higher TOF (dark grey). The rate constant can be determined from the ratio of TOF peak areas through the equation:
∫
∫
∞ − − = 0 2 1 ) ( ) ( dt e dt e total Area drift Area kt kt τ τ (2.1)the daughter ion loss becomes significant. As a result, several of the experiments were carried out in both the ReTOF and the LinTOF systems.
2.1.1.2. Linear Time-of-Flight Mass Spectrometer (LinTOF)
In the LinTOF, ions are accelerated to 100 eV in the first 5 cm long acceleration region and to 280 eV in a short second acceleration region after which they travel 40 cm in the first drift region. The ions are then decelerated and travel through a 7.5 cm second drift region before being collected by a tandem multichannel plate ion detector. The deceleration serves to separate ions which have dissociated in the first drift region from ions which do not dissociate. The drift peak appears as a broad peak at a higher TOF than the parent ion.
2.1.2. Photoelectron Spectroscopy
Photoelectron spectroscopy (PES) is a useful tool for the determination of ionization energies and electronic states of ions. Fixed energy light is used to ionize a molecule and the spectrum is obtained by energy analysis of the ejected photoelectrons. When a molecule is ionized, the remaining energy (above the IE) is partitioned between the kinetic energy of the electron and the internal energy of the ion (2.2).
Eint = hν – IE – KE(e−) (2.2)
Thus, the ion spectrum is obtained by measuring the distribution of electron energies. Another approach is to use a tunable light source and collect electrons with a fixed energy. This variation is called threshold photoelectron spectroscopy (TPES).
2.1.2.1. Threshold Photoelectron Spectroscopy (TPES)
that the ion internal energy is associated directly with the photon energy. The major advantage of this technique is that zero energy electrons are easily focused to the electron detector while most of the energetic electrons can be suppressed by angular discrimination. Because some energetic electrons have an initial velocity vector directed at the detector there is always a background of energetic electron signal in the real signal. This accounts for a few percent of the real signal.
Energetic electrons can be suppressed by their time-of-flight if a pulsed source is used. Another approach is to subtract the contribution of energetic electrons from the threshold signal. This is done by collecting two spectra, one associated with the threshold signal (center) and one associated with energetic electrons (off-center). The off-center spectrum is used to measure the contribution of energetic electrons in the threshold signal. The true threshold spectrum can be obtained by subtracting a fraction of the off-center signal from the center signal..
2.1.2.2. Ultraviolet Photoelectron Spectroscopy (UPS)
The UPS spectrum is obtained by ionizing the neutral precursor with a fixed frequency laser or discharge lamp. The kinetic energy of the ejected photoelectrons is analyzed in order to obtain the PES. Electrons are typical collected using an electrostatic energy analyzer, and the choice of a specific analyzer depends on the ion source geometry. The main drawback is that the collection efficiency is quite low because only a small solid angle of electrons are directed at the detector.
applied. The ionization energies of most species fall in the range of 6-20 eV, making He I an ideal choice.
2.2. Detailed information about the TPEPICO experiment
2.2.1. Implementation of a Temperature Controlled Inlet system
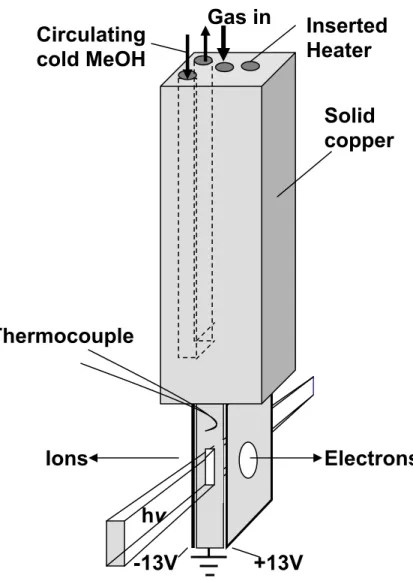
Figure 2.2. Schematic diagram of the temperature controlled inlet system. Cold methanol circulated through a channel provides the cooling. The inlet is heated using a cartridge heater. Temperatures in the range of 220 – 400K can be achived.
Electrons
Ions
Gas in
Inserted
Heater
Circulating
cold MeOH
Thermocouple
h
v
-13V +13V
not be controlled with the Isotemp bath, rather it was monitored and controlled by a hands on approach. In all cases, the temperature was monitored with K type thermocouples at the inlet and outlet of the cooling line as well as directly above the ionization region. The recorded temperature drift is <1 degree over the course of an experiment.
2.2.2. Velocity Focusing
A major problem associated with the selection of threshold electrons is the inability to suppress energetic electrons whose initial velocity vector is in the direction of the detector. Because the ionization region is several millimeters wide, the use of an electrostatic energy analyzer is of limited help. The range of electron energies formed is much wider than the desired 10meV resolution.
Energetic electrons have been successfully suppressed using time-of-flight based approaches with pulsed synchrotron radiation. The main disadvantage here is that very low extraction fields, on the order of 1 V/cm, are unfavorable for ion mass resolution.
concentric rings around the central spot. The radius of the rings is determined by the initial off-axis velocity. Figure 2.3 is an illustration of the ionization region and electron drift tube. Electron trajectories for several positions in the ionization region and two initial velocities (0 and 38 meV) were calculated using the SimION modeling program suite. The electrons were launched from five different vertical positions and 3 different horizontal positions. The electrons were given three initial energies as well, 0 and 38 meV in both up and down directions. It is evident from figure 2.3. that the zero energy electrons are tightly focused to the central spot while the energetic electrons are tightly focused to a ring around the central spot.
2.2.3. Subtraction of Energetic Electrons
The primary TPEPICO experimental data consist of ion TOF distributions at various photon energies. From these we can construct a breakdown diagram, which is the fractional abundance of parent and the various daughter ions as a function of the photon energy. In addition, we analyze the shape of the ion TOF distributions at photon energies where the dissociation rate constants are in the range of 103 – 107 s−1. The subtraction of the hot electron signal for breakdown diagram as described by Fogleman et al. involves subtracting a fraction of the TOF peak areas in the hot TPEPICO signal from those in the threshold TPEPICO TOF data. The corrected peak areas are then given by:
Tn = Cn−F Rn, (2.2)
parent ion signal in the center TOF spectrum should be zero and any non−zero area is due solely to hot electron contamination.
For the TOF distributions, the asymmetric peak shape must be conserved, and therefore a point by point subtraction is employed. Because the two spectra have been recorded using two different time-to-pulse-height converters they are not aligned. A second order fitting algorithm is used to align the spectra before the subtraction. This requires selecting three matching peaks in both TOF spectra, C1, C2, C3, R1, R2, and R3, so that C1 and R1 represent the parent ion peak (for example) in the center and ring spectrum, respectively. The TOF spectra are subtracted using a cubic spline algorithm, where the “steps” are along the center channels. The ring channel corresponding to the desired center channel is calculated via equation 2.3,
Rchn = a(Cchn)2 + bCchn + c (2.3) where a, b, and c are coefficients determined from the selected matching peaks (C1, R1…)
The determined Rchn will not be an integer channel number, so the intensity of the ring signal is determined using the same approach as above. Coefficients a, b, and c, are determined by fitting I[RIchn-1], I[RIchn], I[RIchn+1], RIchn-1, RIchn, RIchn+1, where I[RIchn] is the intensity (counts) at an integer channel RIchn. The intensity is then computed via equation 2.4.
4000 4200 4400 4600 4800 5000
Pare
nt Ion
(Cen
ter & Su
btra cted ) Daug hter Ion (Ring) Pare
nt Io
n
(Rin
g)
Daug
hter I
on
(Cen
ter & Su
btra cted) Center Ring Subtracted T P E P IC O C o u n ts ( a rb . u n its ) Channel Number
Figure 2.4 shows the normalized TOF spectra for the center (black), ring (dark grey) and subtracted (light grey fill). It is evident from figure 2.4 that parent ion is more abundant in the ring spectrum compared to the center (threshold) spectrum. This is because the total energy available is divided between the kinetic energy of the electron and the internal energy of the parent ion. For center (threshold) electrons, the parent ion retains the total available energy and will therefore have more energy to dissociate.
2.3. Theoretical Approach
2.3.1. Modeling
2.3.2. Computational Support
2.3.2.1. Ionization Energies
The adiabatic and vertical ionization energies aid in the modeling of the TPEPICO data. The adiabatic ionization energy is the energy from the neutral to ion ground state, while the vertical energy represents a “vertical” transition from the neutral ground state an the ion state with the same geometry. In either case, the IE is given by the difference between the ion and neutral energy. The structures and energies for the adiabatic ionization are easily obtained via geometry optimizations at the desired level of theory. The ion structure and energy for a vertical transition was determined by fixing the geometry at the optimized structure of the neutral and removing one electron.
2.3.2.2. Thermochemistry
With the development of computational resources, it is the norm these days to support experimental findings with theoretical calculations. Experimental heats of formation can be calculated through atomization energies, Eatomization, and isodesmic reactions. The Eatomization is the energy required to completely dissociate a target molecule.
one in which the number and type of formal bonds on each side of a reaction is conserved. For example,
C2H6 + C2H4 → H3C−CH=CH2 + CH4 (2.7)
There is one C−C bond, one C=C bond and ten C−H bonds on each side of reaction 2.7. Although the advantage is that systematic errors are canceled, the main disadvantage is that the total energies of four large molecules need to be calculated.
2.3.2.3. Potential Energy Surfaces
CHAPTER 3:
Temperature Controlled TPEPICO Experiments
3.1. Introduction
Photoelectron photoion coincidence (PEPICO) spectroscopy is an established tool for the determination of thermochemical properties of gaseous ions, neutrals and radicals1-10. PEPICO experiments are most commonly carried out with room temperature samples using a time-of-flight based approach for mass selection. By measuring ions in coincidence with energy selected electrons, the ion internal energy is determined. Time-of-flight (TOF) distributions are collected at several photon energies and the results are easily visualized in the form of a breakdown diagram, which is the fractional abundance of all the ions as a function of the photon energy.
adjusted between 290 and 310K11-13. However, the fit is clearly dependent on the assumed vibrational frequencies so that errors in these values could be compensated for by varying the assumed temperature. The newly developed temperature controlled inlet allows this assumption to be tested at more than one temperature and thus to test this assumption more rigorously.
Investigations of halogen loss reactions from haloalkanes are prominent
throughout the literature14-17. One reasons is that they provide a means to determine gas-phase neutral or ionic heats of formation based on the thermochemical relation
E0 = ∆fHo0K[R+] + ∆fHo0K[X•] −∆fHo0K[RX] (3.1) for the reaction
RX + hν → R+ + X• (3.2)
where R = CH3, C2H5, etc, and X = Cl, I, or Br. E0 is the 0K dissociation limit and ∆fHo0K is the 0K heat of formation. The halogen radical heats of formation are well known, so if either of the other species is known, the third can be determined.
The previous studies18 on these systems uncovered the role of H-atom scrambling in the halogen loss reactions from propyl- and butylhalides. For example, chlorobutane ions dissociate via HCl loss and the four isomers of bromo and iodobutanes (1-, 2-, iso-, and t-) produce only two product C4H9+ isomers. The 1- and butylhalides yield the 2-butyl cations (2-C4H9+) while the iso- and t-butylhalides yield the t-butyl cation (t- C4H9+).
The data analysis, including RRKM rate constant calculations, requires knowledge of the vibrational frequencies of the starting molecule, the molecular ion, as well as the transition state. The calculations on these three species were carried out using the Gaussian 03 program suite19 provided by the ITS Research computing facility at the University of North Carolina at Chapel Hill. The geometry and vibrational frequencies of all molecules studied were calculated using the Becke 3-parameter exchange functional20, the electron correlation functional of Lee-Yang-Parr (B3LYP)21 with the 6−311+G* basis set and are listed in Table 3.1. No scale factor was applied to the vibrational frequencies of the stable species. The transition states were determined by the QST3 method, using the same level of theory and basis set. This provides a starting set of frequencies for modeling the data. The four lowest frequencies in the transition state are treated as adjustable parameters, as described below.
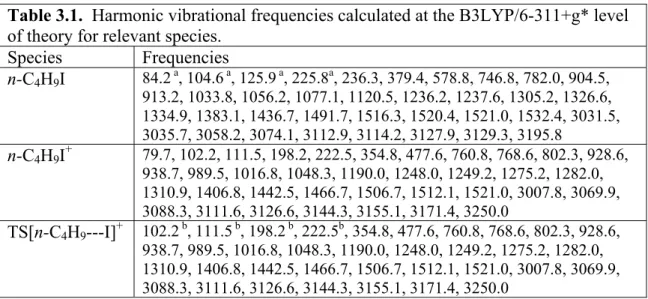
Table 3.1. Harmonic vibrational frequencies calculated at the B3LYP/6-311+g* level of theory for relevant species.
Species Frequencies
n-C4H9I 84.2 a, 104.6 a, 125.9 a, 225.8a, 236.3, 379.4, 578.8, 746.8, 782.0, 904.5,
913.2, 1033.8, 1056.2, 1077.1, 1120.5, 1236.2, 1237.6, 1305.2, 1326.6, 1334.9, 1383.1, 1436.7, 1491.7, 1516.3, 1520.4, 1521.0, 1532.4, 3031.5, 3035.7, 3058.2, 3074.1, 3112.9, 3114.2, 3127.9, 3129.3, 3195.8
n-C4H9I+ 79.7, 102.2, 111.5, 198.2, 222.5, 354.8, 477.6, 760.8, 768.6, 802.3, 928.6, 938.7, 989.5, 1016.8, 1048.3, 1190.0, 1248.0, 1249.2, 1275.2, 1282.0, 1310.9, 1406.8, 1442.5, 1466.7, 1506.7, 1512.1, 1521.0, 3007.8, 3069.9, 3088.3, 3111.6, 3126.6, 3144.3, 3155.1, 3171.4, 3250.0
TS[n-C4H9---I]+ 102.2 b, 111.5 b, 198.2 b, 222.5b, 354.8, 477.6, 760.8, 768.6, 802.3, 928.6, 938.7, 989.5, 1016.8, 1048.3, 1190.0, 1248.0, 1249.2, 1275.2, 1282.0, 1310.9, 1406.8, 1442.5, 1466.7, 1506.7, 1512.1, 1521.0, 3007.8, 3069.9, 3088.3, 3111.6, 3126.6, 3144.3, 3155.1, 3171.4, 3250.0
Table 3.1. a) Denotes neutral frequencies scaled in 275K simulations. b) Denotes frequencies scaled in modeling asymmetric TOF profiles at 298K.
3.3.1. Ion Time of Flight Distributions
Normalized time-of-flight (TOF) distributions at 9.61 eV for the central electron collector at each temperature are given in Figure 3.1. These spectra have not been corrected for the hot electron contamination and therefore the parent ion is over-represented as compared to the breakdown diagrams. The 1-C4H9I+ parent ion is the symmetric peak centered at 31.3 µs and the 2-C4H9+ is the slightly asymmetric peak at 17.2 µs. At 220K (black), the TOF distribution is dominated by the molecular ion 1-C4H9I+. The daughter ion, 2-C4H9+ is hardly visible. The 2-C4H9+ is more pronounced at 273K (dark grey) and the asymmetry of the peak is observed, but the TOF distribution is still dominated by 1-C4H9I+. By 298K (grey), the 2-C4H9+ intensity is strong and the peak is clearly, although only slightly, asymmetric. The TOF spectrum at 400K (light grey) shows an equal abundance of both 1-C4H9I+ and 2-C4H9+.
3.3.2. Breakdown Diagrams
15
20
25
30
35 9.61 eV
n-C4H9+
n-C4H9I+
400K 300K 273K 220 K
T
P
E
P
IC
O
C
ou
n
ts
Time-of-flight (µ s)
9.45 9.50 9.55 9.60 9.65 9.70 9.75 9.80 0
10 20 30 40 50 60 70 80 90 100
220K 275K 298K 400K Simulation open n-C4H9I+ solid n-C4H9+
E0= 9.738 eV
F
ract
ional
Ion Abundance
(%
)
Photon Energy (eV)
400K (squares). Additionally, the crossover points, where the 1-C4H9I+ and 2-C4H9+ abundances are 50%, shifts to lower photon energies as the temperature increases. Although the shapes of all four breakdown curves differ, the 1-C4H9I+ signal disappears at the same energy.
3.3.3. Modeling
The first step in modeling the experimental results is the calculation of the 1-C4H9I+ internal energy, which is given by the photon energy, hν, plus the thermal energy, P(E) ≈ ρ(E)exp(−E/RT), where ρ(E) is the rovibrational density of states. The thermal energy, P(E), is calculated using harmonic vibrational frequencies and the temperature. Once P(E) is obtained, the breakdown curve can be calculated from equations (3.3) and (3.4), (3.4) ) ( ) ( (3.3) ) ( ) ( 0 0 0
∫
∫
∞ − − = = ν ν ν ν h E h E dE E P h D dE E P h Pwhere P(hν) is the parent ion signal, D(hν) is the daughter ion signal, E is the total energy and E0 is the dissociation onset. The only adjustable parameter is the E0. This method works quite well for fast dissociations.
When modeling the asymmetric TOF profiles resulting from slow dissociations, absolute rate information is obtained. In this case, the TPEPICO data are modeled within the RRKM framework using the well known equation:
(3.5) ) ( ) ( ) ( 0 E h E E N E k ρ σ − = m
the symmetry number. The RRKM framework is used to account for a kinetic shift associated with slowly dissociating ions. If the ions do not have time to dissociate during mass analysis, then the will appear as parent ions. This results in an overrepresentation of parent ion in the breakdown curve, which would lead to a higher E0. By modeling both the breakdown curve and TOF distributions simultaneously, a unique k(E) curve is obtained and the E0 can be extrapolated to the dissociation onset. The molecular ion density of states, ρ(E), is easily calculated from the vibrational frequencies and is strictly given. Therefore, in order to optimize k(E), the 2 lowest transition state vibrational frequencies are adjusted, along with the E0.
3.3.3.1. Room Temperature (298K)
Table 3.2). This is consistent with a reaction that involves a rearrangement, rather than a simple dissociation reaction.
3.3.3.2. Dry Ice/Acetone (220K)
The breakdown curve at 220K is given as the diamonds in Figure 3.2 and the solid line is the fit. Several temperatures from 210 to 230 K were modeled and the best fit was obtained at 220K with an E0 of 9.736 ± 0.017 eV. The much larger error is due to temperature fluctuation during the course of the experiment. As mentioned above, the temperature could not be controlled digitally and thus depended on the acetone/dry ice ratio. Since the fractional abundances of the ions change depending on the temperature, as evident from Figure 3.2, the breakdown curve has more scatter leading to the larger error in the onset determination. Nevertheless, the resulting E0 agrees to within 4 meV of the room temperature experiment.
3.3.3.3. Ice Water (273K)
The breakdown curve at 275K is given as the squares in Figure 3.2 and the solid line is the fit. The temperature of the isotemp bath was held constant at 273 K, though the temperature at the inlet was 275K. Several temperatures from 260 to 280 K were modeled and the best fit was obtained at 275K with an E0 of 9.738 ± 0.010 eV.
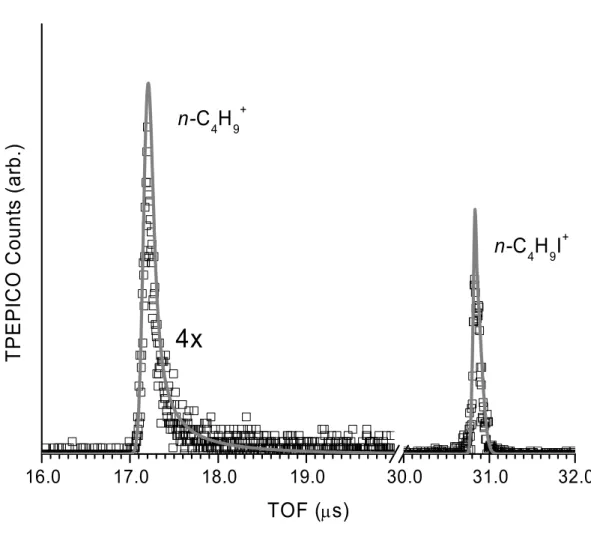
16.0 17.0 18.0 19.0 30.0 31.0 32.0
4x
n-
C
4H
9+n-
C
4H
9I
+T
P
E
P
IC
O
C
ount
s (
a
rb
.)
TOF (
µs)
These frequencies, along with one other which corresponded to an internal rotation were scaled by 10%, 20% and 30%. The P(E) distributions for the 3 scaled simulations, as well as the original are given in Figure 3.4. The maximum in the distribution is plotted as the inset in Figure 3.4 from 7.2 to X eV. The separation of the 4 distributions is more clearly visible. The E0s resulting from these simulations range from 9.738 (no scaling) to 9.745 eV (30%). The range of E0s is within the experimental uncertainty, however there is a noticeable worsening of the fit to the breakdown curve when comparing the simulation using the frequencies scaled by 30% to the simulations with the original set of frequencies.
3.3.3.4. Heated (400K)
The breakdown curve at 400K is given as the triangles in Figure 3.2, with the solid line as the fit. Several temperatures from 380 to 410 K were modeled and the best fit was obtained at 400K with an E0 of 9.738 ± 0.009 eV. Accurately determining the temperature is done by modeling the experimental curve at low photon energies. In this case, the first experimental point is approximately 50% daughter and parent. This makes determining the temperature a little harder. Nonetheless, the simulated curve fits very nicely over the entire energy range of the breakdown curve and the determined E0 agrees very nicely with the three other measurements.
3.4. Implications and Discussion
3.4.1. The Role of Thermal Energy in Ionization
0.6 0.7 0.8 0.9 1.0 1.1 1.2
0.72 0.74 0.76 0.78 0.80 0.82 0.84
275K
original: 10%: 20%: 30%:
Popul
a
tion
Ion Internal Energy, P(E-IE), (eV)
breakdown diagram for a molecule, it is possible to determine directly its internal energy distribution. There is no other experiment that allows one to measure such a distribution for a large polyatomic molecule. Gas phase heat capacities, which are very difficult to measure, are certainly sensitive to the vibrational modes, but only in an average sense. Similarly, sound velocity depends on γ=Cp/Cv, which for large molecules approach 1, and are thus very insensitive. The use of breakdown diagrams to determine the internal energy distribution my become useful for very large molecules, especially those having long carbon chains, which have many low frequencies that are difficult to calculate by ab initio methods.
electron changes the geometry and permits preparation of the ion at any photon energy, not just at the ionization energy.
Consider now the situation in which the neutral and ion geometries are very different., as is the case in ammonia. The photoelectron spectrum of NH3 exhibits a long progression of vibrational peaks in the umbrella mode23. Clearly, the Franck-Condon factors favor production of the high v states, which permits photon absorption to produce more highly excited ionic states by ∆v > 0 transitions. Based on simple diatomic displaced harmonic oscillator Franck Condon factors24, we note that the transition probabilities for a series of v′ – v = n (v = 0, 1, 2, ..) excitations permits us to excite ions to higher energies. A series of equal photon energy transitions for a diatomic species in which the neutral has a frequency of 200 cm-1 and the ion 100 cm-1shows that the Franck-Condon factors are not equal, but that they do not differ wildly. Based on this vibrational mode alone, we would not expect that the thermal energy distribution in the neutral state is faithfully transposed to the ion.
Table 3.2. Iodobutane neutral and ion frequencies (<1000cm-1) and the contribution to the overall thermal energy.
Freq-N E-Ave E-Total % of Total Freq-I Diff
84.2 166.76 166.7600233 18.32528 79.7 4.5
104.6 158.1071 324.8671556 35.69969 102.2 2.4
125.9 149.4226 474.2897293 52.11975 111.5 14.4
225.8 113.3237 587.6134476 64.57291 198.2 27.6
236.3 109.9577 697.5711751 76.65617 222.5 13.8
379.4 71.48306 769.0542303 84.51145 354.8 24.6
578.8 37.09048 806.1447137 88.58733 477.6 101.2
746.8 20.44133 826.5860404 90.83363 760.8 -14
782 17.96548 844.5515192 92.80786 768.6 13.4
904.5 11.34837 855.8998891 94.05493 802.3 102.2
However, in most polyatomic molecules, only a small number of vibrational modes are directly excited. Only those that are symmetric and change significantly from neutral to ion manifold can be excited by ∆v = 2, 3, 4, etc. All other modes follow the ∆v = 0 propensity. In Table 3.2, we list all the iodobutane frequencies below 1000 cm-1. These are the ones that provide 95% of the 910 cm-1 total thermal energy at T = 298K. The last column shows the difference in the ion and neutral frequencies. It is evident, that only two frequencies change significantly (≈ 100 cm-1), and of these only the 578.8 cm-1 neutral frequency is significantly populated at room temperature. This modes then provides the ability to excite the ion to high vibrational levels by ∆v > 0 transitions. All the other frequencies will change by the usual ∆v = 0 propensity and thus simply transpose the thermal energy to the ionic manifold without changing it. It is significant that the lowest five frequencies contribute 75% of the thermal energy. It is because of these low frequencies that carry 75% of the thermal energy and are dominated by ∆v = 0 transitions, that we observe a simple transposing of the neutral thermal energy into the ionic manifold.
3.4.2. Reaction Mechanism
3.5. Conclusions
List of References (1) Baer, T. Int.J.Mass Spectrom. 2000, 200, 443-457.
(2) Baer, T.; Booze, J. A.; Weitzel, K. M. Photoelectron photoion coincidence studies of ion dissociation dynamics; In Vacuum ultraviolet photoionization and
photodissociation of molecules and clusters; Ng, C. Y., ed. World Scientific: Singapore, 1991; pp 259-298.
(3) Bombach, R.; Dannacher, J.; Stadelmann, J. P. J.Am.Chem.Soc. 1983, 105, 1824-1829.
(4) Dannacher, J. Chem.Phys. 1978, 29, 339-344.
(5) Li, Y.; Sztáray, B.; Baer, T. J.Am.Chem.Soc. 2001, 123, 9388-9396. (6) Mayer, P. M.; Baer, T. Chem.Phys.Lett. 1996, 261, 155-159.
(7) Riley, J.; Baer, T. J.Am.Soc.Mass Spectrom. 1991, 2, 464-469.
(8) Rosenstock, H. M.; Stockbauer, R.; Parr, A. C. J.Chem.Phys. 1980, 73, 773-777. (9) Sztáray, B.; Baer, T. J.Am.Chem.Soc. 2000, 122, 9219-9226.
(10) Weitzel, K. M.; Booze, J. A.; Baer, T. Int.J.Mass Spectrom.Ion.Proc. 1991, 107, 301-317.
(11) Bodi, A.; Kercher, J. P.; Baer, T.; Sztáray, B. J.Phys.Chem.B 2005, 109, 8393-8399.
(12) Fogleman, E. A.; Koizumi, H.; Kercher, J. P.; Sztáray, B.; Baer, T. J.Phys.Chem.A 2004, 108, 5288-5294.
(13) Lago, A. F.; Kercher, J. P.; Bodi, A.; Sztáray, B.; Miller, B. E.; Wurzelmann, D.; Baer, T. J.Phys.Chem.A 2005, 109, 1802-1809.
(14) Werner, A. S.; Tsai, B. P.; Baer, T. J.Chem.Phys. 1974, 60, 3650-3657.
(15) Holmes, J. L.; Lossing, F. P.; McFarlane, R. A. Int.J.Mass Spectrom.Ion.Proc.
1988, 86, 209-215.
(16) Chiang, S. Y.; Bahou, M.; Sankaran, K.; Lee, Y. P.; Lu, H. F.; Su, M. D. J.Chem.Phys. 2003, 118, 62-68.
(17) Tsai, B. P.; Baer, T.; Werner, A. S.; Lin, S. F. J.Phys.Chem. 1975, 79, 570-574. (18) Oliveira, M. C.; Baer, T.; Olesik, S.; Almoster Ferreira, M. A. Int.J.Mass
(19) Frisch, M. J., Trucks, G. W., Schlegel, H. B., Scuseria, G. E., Robb, M. A., Cheeseman, J. R., Montgomery, J. A., Vreven, T., Kudin, K. N., Burant, J. C., Millam, J. M., Iyengar, S. S., Tomasi, J., Barone, V., Mennucci, B., Cossi, M., Scalmani, G., Rega, N., Petersson, G. A., Nakatsuji, H., Hada, M., Ehara, M., Toyota, K, Fukuda, R., Hasegawa, J, Ishida, M., Nakajima, T, Honda, Y., Kitao, O., Nakai, H., Klene, M., Li, X., Knox, J. E., Hratchian, H. P., Cross, J. B., Adamo, C., Jaramillo, J., Gomperts, R., Stratmann, F., Yazyev, O., Austin, A. J., Cammi, R., Pomelli, C., Ochterski, J. W., Ayala, P. Y., Morokuma, K., Voth, G. A., Salvador, P., Dannenberg, J. J., Zakrzewski, V. G., Dapprich, S., Daniels, A. D., Strain, M. C., Farkas, Ö., Malick, D. K., Rabuck, A. D., Raghavachari, K., Foresman, J. B., Ortiz, J. V., Cui, Q., Baboul, A. G., Clifford, S., Cioslowski, J., Stefanov, B. B., Liu, G., Liashenko, A., Piskorz, P., Komáromi, I., Martin, R. L., Fox, D. J., Keith, T., Al-Laham, M. A., Peng, C. Y., Nanayakkara, A.,
Challacombe, M., Gill, P. M. W., Johnson, B., Chen, W., Wong, M. W.,
Gonzalez, C., and Pople, J. A. Gaussian 03, Revision C.02. 2004. Pittsburgh PA, Gaussian, Inc.
Ref Type: Computer Program
(20) Becke, A. D. J.Chem.Phys. 1993, 98, 5648-5652.
(21) Lee, C.; Yang, W.; Parr, R. G. Phys.Rev. 1988, B37, 785-789. (22) Sztáray, B.; Baer, T. Rev.Sci.Instrum. 2003, 74, 3763-3768.
(23) Reiser, G.; Habenicht, W.; Muller-Dethlefs, K. J.Chem.Phys. 1993, 98, 8462-8468.
CHAPTER 4:
The Heat of formation of the Acetyl Radical and Iona
4.1. Introduction
The heats of formation of the acetyl radical, CH3CO• and its closed shell ion, CH3CO+ are important species because they are related to a number of important thermochemical quantities, such as the C-H bond energy in acetaldehyde and the C-CH3 bond energy in acetone. It is thus of some importance to establish these quantities to the same level of accuracy as the heats of formation of the related acetaldehyde and acetone molecules. There are several methods for determining bond energies and radical heats of formation, which have been summarized and compared by Berkowitz et al.1 and Blanksby and Ellison.2 Among these are negative and positive ion thermochemical cycles as well as methods based on neutral kinetics. All of these approaches for determining a radical or ion heat of formation depend on the accuracy of other measurements. The various approaches thus differ not only in their experimental techniques, but also in their dependence on ancillary thermochemical information. It is thus important to determine these thermochemical quantities by several methods. In this paper we present new experimental data that serve to establish the heats of formation of the acetyl radical and ion to a precision of less than 2 kJ/mol.
H2C=C=O + H+ → CH3CO+ ∆E = PA(H2C=C=O) (4.1)
The gas-phase proton affinity is generally measured as a relative quantity by equilibrium methods in high-pressure mass spectrometry, and its accuracy depends on a knowledge of the proton affinity of neighboring molecules in the scale.3 The 298 K proton affinity of ketene as listed in the NIST webbook is 825.3 kJ/mol,4 a number that was verified by high level ab initio calculations of Smith and Radom5 (825.0 kJ/mol). On the basis of the 0 K value of 819.1 kJ/mol and the heat of formation of ketene and H+,6 the 0 K acetyl ion heat of formation is 664.2 ± 4 kJ/mol. The error limits are difficult to determine because they are based on the reliability of the PA scale in the vicinity of ketene. We estimate it to be 4 kJ/mol.
Because the sample usually has a room temperature thermal energy distribution, the onset must be carefully modeled by taking this into account, as suggested by Asher et al.11 This was not done in the previous photoionization studies.
The main information about the CH3CO• radical heat of formation has come from neutral kinetic methods. Niiranen et al.12 investigated the forward and backward rate constants for the reaction: CH3CO• + HBr ↔ CH3CHO + Br• as a function of temperature. Knowing the heat of formation of acetaldehyde, HBr, and the bromine atom, permitted them to extract a 298 K acetyl radical heat of formation of –10.0 ± 1.2 kJ/mol. A subsequent critical review of various kinetic methods led Tsang13 to propose a 298 K heat of formation of the acetyl radical of –12.0 ± 3 kJ/mol.
In principle, the acetyl free radical heat of formation can be determined through a positive ion cycle. If the acetyl ion heat of formation is known, the radical ionization energy would provide a measure of the radical heat of formation. However, the CH3CO• ionization energy has not been determined and would be rather difficult to measure with great precision unless it was done with a very cold sample and at very high resolution so that the adiabatic ionization energy could be extracted.
In the negative ion cycle, the gas-phase acidity of CH3CHO is combined with the CH3CO• electron affinity:
CH3CHO → CH3CO - + H+ ∆E = ∆acidHo(CH3CHO) (4.2) CH3CO• + e-→ CH3CO - ∆E = −EA(CH3CO•) (4.3)
8 kJ/mol was estimated by DePuy et al.14 in a flowing afterglow instrument. A direct measurement was not reported because the acetyl anion is less stable than the isomeric acetaldehyde enolate anion, so that determining this by reaction kinetics was not possible. The electron affinity of the acetyl radical of 0.423 ± 0.038 eV was reported by Nimlos et al.15 from the CH3CO- photoelectron spectrum. Because of the considerable change in the geometry upon electron detachment, the PES consists of a broad band of resolved vibrational peaks in which it is difficult to identify the adiabatic onset from hot bands. Thus the adiabatic EA could be either the published value of 0.423 or 0.481 ± 0.037 eV.16 Making matters still more uncertain is the heat of formation aceteldhyde, which Pedley17 lists as –166.1 ± 0.5 kJ/mol, and Wiberg et al.18 report as –170.7 ± 1.5 kJ/mol. Thus by combining the various possible values, we can obtain 298 K CH3CO• heats of formation ranging from –17.2 to –27.9 kJ/mol. These are all considerably lower than the –10.0 kJ/mol value reported by Niiranen et al.12
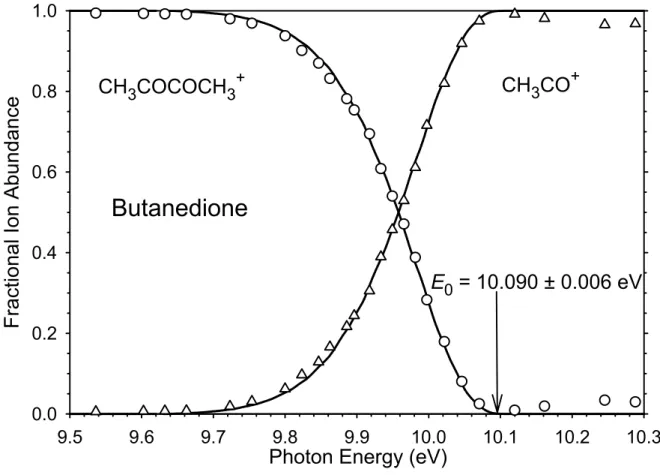
A final route to the acetyl radical heat of formation is through the dissociative photoionization of butanedione, which yields CH3CO+ + CH3CO•. If the acetyl ion heat of formation is known, then the radical energy can be determined. Traeger et al.7 reported the photoionization onset for the acetyl ion to be 9.88 eV, from which Traeger and Kompe8 determined the 298 K heat of formation of the acetyl radical to be –11.1 ±
value derived from the ketene proton affinity. In the case of the acetyl radical heat of formation, the kinetic methods yield values that are 12 kJ/mol higher than the value from the negative ion cycle. On the other hand the photoionization and kinetic methods agree quite well.
We present in this paper photoionization data that provide new values for these heats of formation with overall error limits of ± 2 kJ/mol. In this study the dissociative photoionization onsets of acetone to give CH3CO+ + CH3 and butanedione to yield CH3CO+ + CH3CO• are used to establish the acetyl ion and radical heats of formation.
The experimental development that has made such a precision in determining the dissociation limits possible is a recently implemented threshold photoelectron photoion coincidence experiment that is free from the contribution of energetic electrons, and thus provides an unambiguous and accurate method for determining the 0K dissociation onset.19;20
4.2. Results
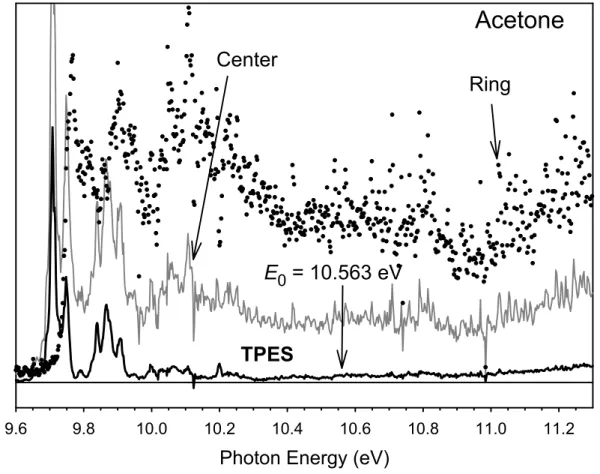
4.2.1. Threshold Photoelectron Spectra
Acetone
Photon Energy (eV)
9.6 9.8 10.0 10.2 10.4 10.6 10.8 11.0 11.2
Elect
ron Count
s
0 1
Ring
Center
TPES
E
0= 10.563 eV
TOF spectrum at an energy of about 11 eV, well above the dissociation limit for •CH3 loss. At this energy, all parent ion signal in the center spectrum is the result of hot electrons. Thus the factor can be set equal to the ratio of parent ion signal in the ring and central electrode TOF distributions, which is 0.278. The ionization energy of 9.708 ±
0.004 eV agrees perfectly with the most accurate measurement of the acetone ionization energy obtained in a ZEKE/PFI study of Wiedmann et al.21 who reported an IE of 9.7080
± 0.0001 eV. This IE is slightly higher than the 9.703 ± 0.006 eV value listed in the NIST data base,22 and 12 meV higher than the 9.696 ± 0.006 eV reported by Trott et al.10 on the basis of their molecular beam photoionization study. It is evident that the yield of threshold electrons in the Franck-Condon gap region beyond about 10 eV is very weak, and that most of the center electrode signal is a result of hot electrons. This makes determination of the dissociation onset, which lies in this region, challenging. Indeed, Traeger pointed out the very weak CH3CO+ signal in the vicinity of its appearance energy.7;8
Butanedione
Photon Energy (eV)
9.0 9.2 9.4 9.6 9.8 10.0 10.2 10.4
Ele
ctr
on Coun
ts
0 1