Honors Thesis
The effect of multiple anesthesia exposures on white matter microstructure in the rhesus macaque during the early postnatal phase
by Jeffrey Young
Senior Honors Thesis Department of Computer Science University of North Carolina at Chapel Hill
Honors Thesis The effect of multiple anesthesia exposures on white matter microstructure in the rhesus
macaque during the early postnatal phase
Jeffrey Young
Introduction
Brain maturation is a complex process driven by myelination, growth of neurons, and the development of their connections during the first years of life. The increase in brain connections is followed by a process of dendritic pruning and loss of synaptic contacts, presumably shaping and sculpting a more efficient network of connections that are continuously remodeled
throughout life (Engert & Bonhoeffer, 1999; Lebel, Walker, Leemans, Phillips, & Beaulieu, 2008; Stepanyants, Hof, & Chklovskii, 2002). Although brain maturation has been studied extensively, both at a functional level (behavior) and at a structural and mediating level (cellular physiology), information at the level of neuroanatomical structure and connectivity during the early childhood to pubertal years is not as comprehensive. However, this information is of special interest because it provides insight into a different perspective of the anatomical substrates and captures major changes in brain development. Furthermore, understanding developmental brain changes will ultimately help us to better diagnose neurodevelopmental conditions that first present clearly in adolescence, such as attention deficit hyperactivity disorder, depression, and schizophrenia, and devise targeted therapies for these brain disorders.
Nonhuman Primate Models in Brain Development
Nonhuman primate models are widely used to provide comparative information
associated with human neuropathology (Barr & Goldman, 2006; Bennett, 2008; Glatzel, Pekarik, Lührs, Dittami, & Aguzzi, 2002; Grant & Bennett, 2003; Lebherz et al., 2005; Lubach & Coe, 2006; Machado & Bachevalier, 2003; R. et al., 2008; Segerstrom, Lubach, & Coe, 2006;
Sullivan et al., 2005). Advantages include the biological similarity of monkeys and humans, such as the gestation of a single offspring, a prolonged in utero development, and the maturational stage of the neonatal brain at birth. Among nonhuman primate models, the rhesus macaque (Macaca mulatta) has been the most widely used monkey to investigate the neural substrates of human behavior, due to its phylogenetic closeness to humans (Lacreuse & Herndon, 2009) and the potential to examine more complex cognitive functions and social behavior associated with encephalization (Price & Coe, 2000). Furthermore, primate models allow for brain imaging at the very early, critical stages of neurodevelopment when it is challenging to recruit and image young human participants. The use of monkeys in a laboratory setting also facilitates genetically and environmentally controlled studies. Additionally, rhesus macaques show hemispheric asymmetry and sex differences in their brains during adolescence similar to humans. For more than forty years, this species has also been used to evaluate how disturbances of the rearing environment can induce atypical behavior and brain development (Harlow, Harlow, & Suomi, 1971).
Honors Thesis changes that occur during the early childhood through the peripubertal years. While there are detailed neuroanatomical descriptions of prenatal brain maturation in the monkey (Rakic, Bourgeois, Eckenhoff, Zecevic, & Goldman-Rakic, 1986), less information on the typical
postnatal maturation of the monkey brain is available, with the exception of certain brain regions, such as the visual cortex. The prevailing view from human studies is that the total brain volume undergoes a rapid non-linear increase during childhood and reaches a maximum around puberty. Gray and white matter follow distinct developmental trajectories (J N Giedd et al., 1999;
Gilmore, Lin, Corouge, et al., 2007; Jernigan & Tallal, 1990; Knickmeyer et al., 2008; Reiss et al., 1996; Schaefer et al., 1990). The only MRI study of juvenile and adolescent brain
development in the rhesus macaque reported that, as in humans, they attain a maximum total brain volume around sexual maturity and then and have an extended period of white matter growth into adulthood (Malkova, Heuer, & Saunders, 2006). While human studies suggest that postnatal cortical development is heterochronous, postmortem studies suggest that cortical development in monkeys is more synchronous (Bourgeois & Rakic, 1993; Rakic et al., 1986)
Studies in humans indicate that there is marked sexual dimorphism in the central nervous system during childhood and adulthood. The most consistent findings include: greater volume of the cerebrum in males, higher proportion of gray matter to white matter in females, relatively greater volume of the amygdala in males, and relatively greater volume of the caudate and hippocampus in females (Allen, Damasio, Grabowski, Bruss, & Zhang, 2003; Caviness et al., 1996; de Bellis et al., 2001; Dekaban, 1978; Filipek, Richelme, Kennedy, & Caviness Jr., 1994; Filipek, 1999; J N Giedd et al., 1996; Jay N. Giedd, Castellanos, Rajapakse, Vaituzis, &
Rapoport, 1997; Gilmore, Lin, Prastawa, et al., 2007; Goldstein et al., 2001; Good et al., 2001; R. C. Gur et al., 1999; Knickmeyer et al., 2008; Nopoulos, Flaum, & Andreasen, 1997; Reiss et al., 1996). Males and females also differ in specific developmental growth trajectories. Total cerebral volume, caudate volume, and gray matter volume in the frontal and parietal lobes peak earlier in girls than in boys (ages vary depending on region), a pattern which may relate to sex differences in timing of puberty. In adolescence, white matter increases more rapidly in males than females (Lenroot et al., 2007). These sex differences in neurobiology may be highly relevant to neurodevelopmental pathologies, which frequently show marked sex differences in risk, phenotypic expression, and treatment response (Baird et al., 2006; Chakrabarti &
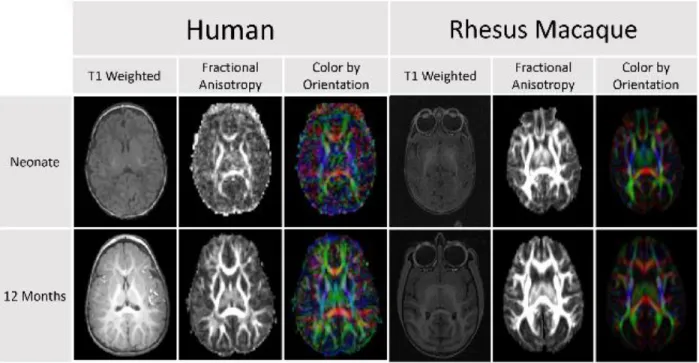
Honors Thesis As also portrayed in Figure 1, white matter changes are observed throughout the first decades of life in humans (Lebel et al., 2008) and can be measured by diffusion tensor imaging (DTI). Few developmental studies using DTI have been published for non-human primates. Makris et al. (Makris et al., 2007) investigated changes in white matter fiber bundles with aging, but this study was done in elderly macaques. They reported reductions in fractional anisotropy (FA) in cortico-cortical association fibers with age and general agreement with observations in humans. Styner et al. (Styner, Knickmeyer, Coe, Short, & Gilmore, 2008) explored changes in the developing macaque brain using an atlas-driven brain parcellation approach and showed increases in FA, particularly in the corpus callosum, as well as a decrease in mean diffusivity. Combining structural MRI and DTI is particularly useful to investigate brain development over the full range of neurodevelopment. While DTI provides sufficient white matter contrast at the earliest stages of brain development, it is more difficult to analyze the fetal and young infant brain with structural MRI due to weak intensity contrast and contrast inversion.
Anesthesia in Early Development
The impact of anesthesia on development has become an area of active research over the past two decades. In 2009, the Food and Drug Administration formed a working group to
analyze the growing literature and in 2012 they released a statement recommending that elective surgical procedures be avoided in children under three years of age (Rappaport, Suresh, Hertz, Evers, & Orser, 2015). Studies initially focused on rodent models but have progressed to non-human primate and non-human models as the effects have become better understood (Wise-Faberowski, Quinonez, & Hammer, 2014).
Figure 1. Comparison of DTI scans for humans and rhesus macaques demonstrates that diffusion anisotropy is observable before a clear distinction between the white and gray matter is visible in the T1 weighted image. This difference in clarity and
Honors Thesis Rodent models were the first to establish a potential neurotoxicity and cognitive
impairment for anesthetics like isoflurane and sevoflurane (Brosnan & Bickler, 2013; Deng et al., 2014; Istaphanous et al., 2011; Kodama et al., 2011). In macaques, cognitive studies have shown that long term exposure (24 hours) to ketamine causes long lasting deficits in a battery of cognitive tests (Paule et al., 2011). Furthermore, even a five hour ketamine or isoflurane
exposure was enough to cause widespread neuroapoptosis in postmortem studies of postnatal day (PND) 5 macaques (A M Brambrink et al., 2012; Ansgar M Brambrink et al., 2010). The effect of exposure in fetal macaques was found to be even more severe (Creeley et al., 2014). The effect of multiple exposures was investigated in Raper et al. and three, four hour exposures of sevoflurane was found to alter emotional reactivity to stress (Raper, Alvarado, Murphy, & Baxter, 2015).
In humans, studies have been limited to retrospective analyses and all suffer from the fundamental limitation of being unable to completely control for the initial indication for surgery requiring anesthesia in the statistical analyses. A large, matched cohort study showed that
multiple, but not single exposures to anesthesia increased the risk of developing learning disabilities (Flick et al., 2011). Backeljauw et al. used a voxel based morphometry approach to study structural changes and found limited group differences, however, the study lacked power to compare different anesthetics and did not control for the underlying indication for surgery (Backeljauw, Holland, Altaye, & Loepke, 2015).
Research examining anesthesia effects on neurodevelopment in young children is still limited, and the effects have not been widely studied using MRI or DTI. Furthermore, the FDA has specifically called for more research investigating whether dexmedetomidine in combination with reduced doses of standard anesthetics, like ketamine and isoflurane, improves outcomes (Rappaport et al., 2015). In this study, we present both a detailed examination on the
neurotoxicity of multiple exposures to anesthesia in relation to white matter development using diffusion MRI and whether this modified protocol suggested by the FDA mitigates the
deleterious effects seen with other anesthetics.
Methods
The cohort of subjects analyzed is a subset taken from the UNC-Wisconsin Neurodevelopment Database1 (Figure 3). Information regarding the subjects and their exposure history can be seen in Figure 2 and
Table 1.
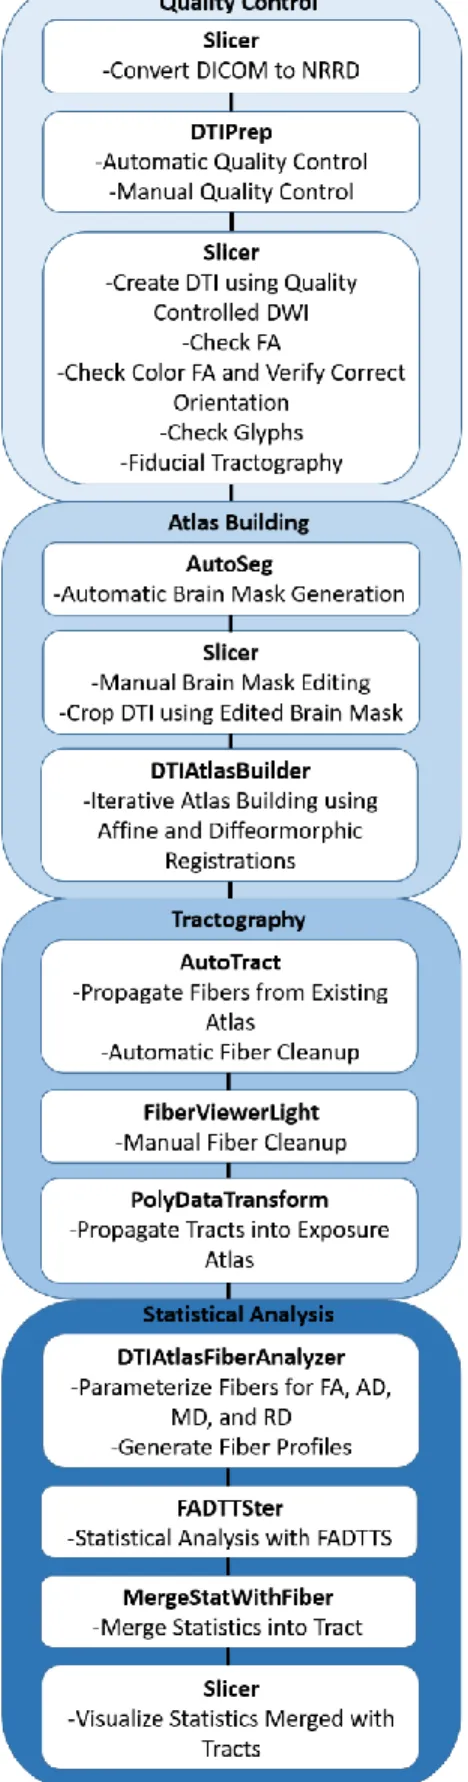
The methods described below are adapted from the UNC-Utah NA-MIC pipeline (Verde et al., 2014). A visual representation of the pipeline is presented in Figure 4.
Honors Thesis
Figure 2. All subjects were approximately 10-14 months of age when scanned. Blue dots represent the individual subjects and orange dots denote the average age at scan for each group. A two tailed t-test was used to test the significance of the age differences between groups. Asterisks denote significance at a p < 0.05. Significance was found between the three and four and two and four exposure groups.
Honors Thesis
Honors Thesis Table 1. Exposure Atlas Subject Demographics
Number of Prior Exposures
0 (n = 2) 1 (n = 4) 2 (n = 13) 3 (n = 8) 4 (n = 11) Average Age at
Scan (postnatal days)
361.5 ± 1.5 345.5 ± 30.2 362.8 ± 39.2 333.3 ± 28.2 398.0 ± 33.5
Average Weight
at Scan (kg) 2.06 ± 0.16 2.20 ± 0.09 2.28 ± 0.29 2.11 ± 0.18 2.37 ± 0.24
Average Age at First Exposure (postnatal days)
361.5 ± 1.5 226.3 ± 30.4 121.0 ± 43.0 45.6 ± 17.5 36.5 ± 20.8
Gender Ratio
(Male:Female) 1:1 2:2 6:7 5:3 8:3
Subjects
Rhesus monkeys (Macaca mulatta) bred and housed at the Harlow Primate Laboratory (HPL) at the University of Wisconsin-Madison were studied. The HPL maintains a 500+
monkey colony dedicated to producing infants, with a capacity for generating approximately 70-100 infants per year. Complete rearing and health histories, as well as pedigrees, are known for all animals. Females were mated with a single sire to ensure the required number of subjects was met. Their offspring comprised of healthy infants and juveniles were assigned to this project.
The housing consisted of double rows of stainless steel caging (each 0.9 × 0.9 × 0.9 m) where each female monkey lived with her infant either individually or as a pair with another adult female in double cages. The housing arrangement is conducive to rigorous experimental control over pregnancy conditions and food consumption. All infants were reared normally by their mothers until weaning occurred at six to seven months of age. Afterwards, the subjects were housed in small social groups or as a pair to provide companionship. This rearing and housing strategy was designed to facilitate their normal socialization and ensure the
standardization of rearing conditions.
Animals were fed a standardized diet of commercial biscuits and fruit supplements with foraging devices for enrichment. Water was available ad libitum, the temperature was controlled at 21.5°C, and the light:dark cycle was maintained at 14:10 with lights on at 06:00.
Honors Thesis Scans were performed on a GE MR750 3.0T scanner (General Electric Medical,
Milwaukee WI) using the human 8-channel brain array coil at the Waisman Laboratory for Brain Imaging and Behavior at the University of Wisconsin-Madison. The scanning protocol for animals younger than six months lasted approximately thirty minutes. For subjects older than six months of age, the scanning procedure was extended to slightly less than one hour to improve the signal-to-noise ratio on the diffusion weighted image (DWI) scan.
High-resolution 3D T1-weighted imaging was performed using an axial Inversion Recovery (IR) prepared fast gradient echo (fGRE) sequence (GE BRAVO) (TI = 450 ms, TR = 8.684 ms, TE = 3.652 ms, FOV = 140 × 140 mm, flip angle = 12°, matrix = 256 × 256, thickness = 0.8 mm, gap = -0.4 mm, 80 percent field-of-view in phase encoding direction, bandwidth = 31.25 kHz, 2 averages, total time = 10:46 minutes) provided an effective voxel resolution of 0.55 × 0.55 × 0.8 mm across the entire cranium. The T2-weighted scan was performed using a sagittal 3D CUBE FSE sequence (TR = 2500 ms, TE = 87 ms, FOV = 154 × 154 mm, flip angle = 90°, matrix = 256 × 256, 90 percent field of view in the phase encoding direction, slice thickness = 0.6 mm, gap = 0 mm, bandwidth = 62.5 kHz, ARC parallel imaging with a factor of two acceleration in both phase encoding and slice encoding directions, total time = 6:36 minutes) across the cranium was acquired with a voxel resolution of 0.6 mm isotropic.
The following DWI protocol was used in order to obtain the highest possible resolution for the DTI: TR = 8000 ms, TE = 65.7 ms, FOV = 16.7 mm, matrix = 128 × 128, 2.6 mm slice thickness with 1.3mm slice overlap (resolution 1.3 × 1.3 × 2.6 mm³), upsampled to a voxel dimension on the scanner of 0.65 × 0.65 × 1.3 mm³, ASSET parallel imaging with an acceleration factor of 2, and a coronal slice orientation. There were 120 unique gradient
directions acquired with b = 1000 s/mm² and ten baseline images with b = 0 s/mm². A scan time of approximately 17.5 minutes was required to obtain these images.
MRI Related Anesthesia Exposure
Subjects were given a preanesthetic (ketamine hydrochloride 10 mg/kg I.M.) for transport to the MRI facility. For infants younger than six months of age, immobilization was achieved with inhalant isoflurane. Older subjects were immobilized throughout the scanning procedure by an initial administration of ketamine hydrochloride (10 mg/kg I.M.) followed by
dexmedetomidine (0.01 mg/kg I.M.). The effects were reversed at the end of the scanning session by administering atipamezole (0.15 mg/kg I.V.). The plane of anesthesia was monitored with a pulse oximeter to track heart rate and oxygen saturation in both younger and older subjects. Overall exposure time was approximately 1.5 hours in subjects younger than six months of age and approximately two hours in older subjects.
All protocols involving the animals at the HPL are evaluated and approved by the Institutional Animal Care and Use Committee (IACUC). Care and treatment of the animals at HPL are designed to meet and exceed the guidelines promulgated by the National Institutes of Health Guide for the Care and Use of Laboratory Animals2.
Preprocessing
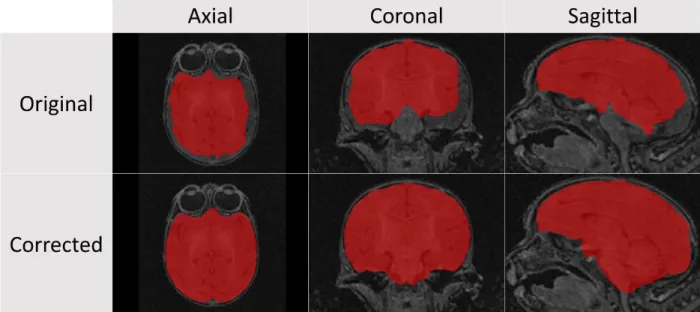
Honors Thesis DICOM images were first converted into the 3D volumetric NRRD file format3. Unlike the DICOM format, where each slice in a scan series is a separate file, the NRRD format allows these images to be assembled into a single file, with a human readable (ASCII) header that describes the data. The converted images were then first processed using the AutoSeg toolkit4 which applies a bias field correction to the T1 and T2 weighted images using N4 (Tustison et al., 2010), rigidly aligns the T1 weighted image to an existing reference atlas (in this case a twelve-month old macaque atlas from a previous study (in review) was used), then rigidly aligns the T2 weighted image to the T1 weighted image, and resamples both images in atlas space (resolution – 0.2375 mm). Next, Atlas Based Classification5 (ABC) was performed on the registered images to extract tissue-based classification maps of white matter, gray matter, cerebrospinal fluid, and background which were then used to create binary brain masks for each image (Van Leemput, Maes, Vandermeulen, & Suetens, 1999). The automatically generated brain mask was then manually corrected before moving on to the next step in processing (Figure 5). Younger subjects required significantly more manual corrections in part because of poor contrast between different tissue types. Contrast is typically lower in younger subjects due to the smaller overall size of the brain. The quality of the automatic segmentations in the younger subjects was also affected by the template atlas (a twelve-month atlas) used in the segmentation process. This atlas is not as comparable in terms of morphometry to a younger subject due to the rapid, nonlinear nature of brain development in the early stages of life.
Using our in-house tool, DTIPrep6, an automatic quality control of the diffusion weighted images (DWI) was applied to the raw diffusion data (Liu et al., 2010; Oguz et al., 2014).
Afterwards, a manual quality control step ensured the following: correct directional encoding, adequate signal to noise ratio (SNR), and presence of major tracts using fiducial tractography
3http://teem.sourceforge.net/nrrd/ 4https://www.nitrc.org/projects/autoseg/ 5https://www.nitrc.org/projects/abc/ 6https://www.nitrc.org/projects/dtiprep/
Honors Thesis (Verde et al., 2014). The DWIs were then converted to DTIs using the DTIProcess Toolkit7 using weighted least squares estimation. This toolkit also allowed for the computation of diffusion property maps, namely fractional anisotropy (𝐹𝐴 = √1
2√
(𝜆1−𝜆2)2+(𝜆2−𝜆3)2+(𝜆3−𝜆1)2
√𝜆12+𝜆 2 2+𝜆
3
2 ), mean
diffusivity (𝑀𝐷 =1
3∑ 𝜆𝑖 𝑖), axial diffusivity (𝐴𝐷 = 𝜆1), and radial diffusivity (𝑅𝐷 = 𝜆2+𝜆3
2 )
where 𝜆𝑖 is the i-th eigenvalue of the tensor matrix (Alexander, Lee, Lazar, & Field, 2007). Once this step was complete, the manually corrected brain masks from the structural images were affinely propagated to the DTI and diffusion property maps DTI by co-registering 𝑏 = 0
(baseline) images with the T2-weighted structural images. The propagated masks were used for the skull stripping of the DTI and diffusion property maps. A visual quality control inspection was performed once again, manually correcting the mask where necessary in preparation for the atlas building step. Figure 6 summarizes this process.
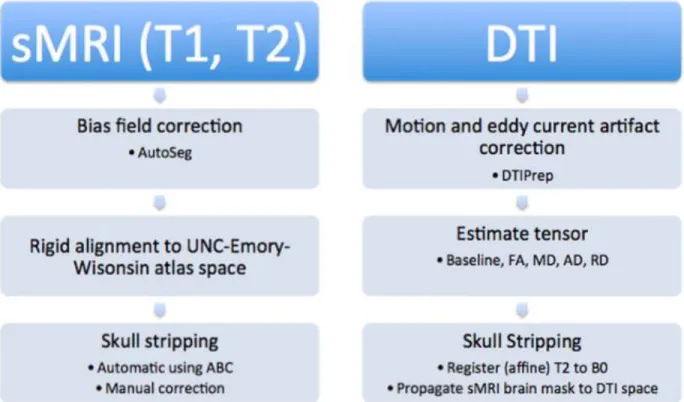
Figure 6. The structural data was first processed using AutoSeg, followed by an affine registration into the atlas space, and then automatically skull stripped with manual corrections. The diffusion data was first corrected with DTIPrep and converted to DTIs, then eigenvalue property masks were generated and the data was skull stripped by propagating the manual masks from the structural data.
Atlas Building
Using the DTIAtlasBuilder tool8 a subject-specific atlas was created for each of the 32 macaques in the cohort using the skull-stripped DTI images as inputs. This tool works in four
Honors Thesis main steps as summarized below (Verde et al., 2014) and visualized in Figure 7. Figure 8 shows the intermediate outputs of each step in the atlas building process.
Figure 7. DTIAtlasBuilder works in a four step process described here in detail. Following an affine registration, the atlas is further refined using a greedy, diffeomorphic transform to create the final atlas (Verde et al., 2014).
First, an affine atlas is created through an iterative process requiring two loops. In the first loop, the skull stripped, original FA maps, are affinely registered to an FA template. This affine transform is then applied to the DTI and the DTIs are then averaged together to create an affine DTI atlas. In the second iteration, the affine transform is computed between the original skull stripped FA and the FA map of the affine DTI atlas.
In steps two and three (see Figure 7), the affinely transformed FA maps and DTIs are used as inputs to construct an unbiased diffeomorphic FA and DTI map respectively (Joshi, Davis, Jomier, & Gerig, 2004).
Honors Thesis used in the registration process. The computed displacement fields allow each of the fiber tracts that are defined in atlas space to be mapped into individual subject space, which is a critical step in downstream analyses.
Figure 8: The affine atlas is computed in step one with only rigid deformations applied to the input dataset. In steps two and three, a nonlinear, diffeomorphic atlas is created using the affine atlas as a template. Finally, in step four the atlas is further processed to create a final, subject specific atlas.
Once the 32 subject-specific atlases were created, the next step was to consolidate these into a final, across subject atlas. This was done by providing the previously computed subject-specific atlases as inputs to DTIAtlasBuilder and computing an atlas once again. This final, across-subject atlas was where the fiber tracking was performed.
To facilitate our analysis of anesthesia exposure, an additional age-specific (“exposure”) atlas was then constructed encompassing only those subject scans between the age of ten and fourteen months (Figure 2). In this age range, there are subjects with anywhere between zero and four prior exposures allowing us to quantify and compare the effects of multiple exposures (see also Table 1). While the analysis can also be performed directly in the across-subject atlas space, this separate exposure atlas is expected to have improved mapping quality between the atlas and the specific scans selected for this exposure study.
Tractography
AutoTract9 was used to automate fiber tracking employing a prior macaque fiber atlas and perform initial cleaning of the resulting fibers (Calabrese et al., 2015; Prieto, Yang, Budin, & Styner, 2016). This approach is significantly more efficient as opposed to fiber tracking from scratch for most of the fibers presented here and ensures that tracts are similarly defined as in an existing prior atlas. AutoTract starts by coregistering an existing fiber atlas via the Advanced Normalization Tools10 (ANTS) software package, followed by a voxelization of the propagated fiber tracts into seed maps for fiber tractography.
Once the fibers have been tracked several processing steps are applied. First, the fibers are cropped at their ends wherever they extend past a white matter mask. This step effectively
Honors Thesis removes tract parts that extend into the gray matter. Then, fibers that pass through areas
containing cerebrospinal fluid (CSF) are removed. Next, fibers that are too short or too long when compared to the prior atlas tracts are removed as well. In the final processing step, the resulting tract and the propagated atlas tract are overlaid, and any tracked fibers that do not overlap at least 60% are excluded.
These automatically processed fibers were then manually inspected in a quality control phase and further pruned by defining regions of interest (ROIs) in the Slicer Tractography Display module based on anatomical information found from various sources (Hecht, Gutman, Bradley, Preuss, & Stout, 2015; Paxinos, Xu-Feng, & Toga, 1999; Rilling et al., 2008;
Schmahmann & Pandya, 2009). Fibers significantly shorter than the overall bundle, or those with a significantly different shape (as defined by the center of gravity of the fiber) were also
excluded using the FiberViewerLight11 tool. Figure 9 shows how much processing is required to create a usable tract. While the automatic processing does significantly prune the tract, a
substantial amount of time was still required in the manual quality control phase to finalize the tract definition.
Figure 9: Fiber definitions for first dorsal segment of the corpus callosum (cc1d) are shown below. Each stage of processing yields a more refined tract definition by excluding fibers that are either anatomically implausible or are part of other tracts. Fibers are also cropped when they begin to deviate significantly from the main bundle or enter into regions of gray matter or CSF. The tracts were colorized based on their FA values, with lower FA values corresponding to red and orange areas (at FA = 0.0) and higher values becoming progressively more green and blue (at FA = 1.0).
Tract Propagation
Once the fiber definitions were finalized in the overall, across-subject atlas space, they were propagated into the exposure atlas. This was accomplished by registering the exposure atlas to the across-subject atlas with the DTI-Reg application12 and using the resulting deformation field and the PolyDataTransform tool13 (part of the NIRAL Utilities software package) to propagate the tracts into the atlas space. Once the fiber tracts had been propagated, they were
Honors Thesis parameterized along their tract length and profiles of FA, MD, AD, and RD were extracted using the DTIAtlasFiberAnalyzer14 tool. The steps are described in detail below.
Execution of the program is driven by a comma separated values (CSV) file which is updated automatically after each step of the processing pipeline with the paths to the newly created files. Initially, this CSV provides the paths to the individual DTI images and the deformation fields describing the deformation needed to map each tract from the atlas space to the individual scan space. In the first step, DTIAtlasFiberAnalyzer performs this transformation by using the fiberprocess tool that is part of the DTIProcess toolkit. The CSV is updated after this step to include the paths to the newly propagated fibers.
Next, the fibers are parameterized along their length and average profiles of FA, MD, AD, and RD are extracted. This is done by defining an “origin” plane that intersects the fiber bundle and then stepping along the length of the fiber bundle with a fixed step size. At each step (at a given tract arc-length), the diffusion properties of interest are computed and averaged across all fibers. In most cases, the origin planes were defined automatically by computing the average median point over all fibers. However, for those tracts that were elliptical in shape (such as the fornix and stria terminalis) fiber planes were defined manually using FiberViewerLight to avoid situations where the plane intersected the tract at multiple points causing the parameterization to fail.
The output of the program is a fiber profile for each tract. These fiber profiles describe the average FA, MD, AD, and RD values along the arc length for every case.
Statistical Analysis
FADTTSter15 was used to perform the statistical analysis. It provides a convenient GUI that drives execution of the Functional Analysis of Diffusion Tensor (FADTTS) pipeline (Zhu et al., 2011).16 This tool allows for testing the association of different diffusion properties (FA, AD, MD, and RD) with a set of covariates of interest. Furthermore, FADTTSter allows for assessing the quality of the input diffusion profiles automatically. For each tract, a 0.850 correlation threshold was used.
To analyze the effect of multiple exposures to anesthesia a linear model was employed which included age, sex, and number of prior exposures as covariates of interest. Weight was also originally included, however it was eventually excluded to increase the statistical power and because omitting it did not change the pattern of significance in the results. The generalized linear model (GLM) [𝐴𝐷, 𝑀𝐷, 𝑅𝐷, 𝐹𝐴] = 𝛽0+ 𝛽1(𝑎𝑔𝑒) + 𝛽2(𝑠𝑒𝑥) +
𝛽3(# 𝑜𝑓 𝑝𝑟𝑖𝑜𝑟 𝑒𝑥𝑝𝑜𝑠𝑢𝑟𝑒𝑠) was employed for analysis, first in an omnibus model that tests all
four properties jointly, followed by post hoc tests for each diffusion property independently. The output of FADTTS, including omnibus and post hoc false discovery rate corrected (FDR) p-values and GLM betas, were merged back into the parameterized fibers using the
Honors Thesis MergeStatWithFiber tool. The merged statistics were then visualized using Slicer or
ShapePopulationViewer17.
Results
The major tracts that were defined and analyzed in this study are shown, along with their abbreviations and anatomical position, in the Appendix (Table 3 and Figure 14). The results of this study show that there was a significant correlation between the number of prior exposures and the white matter microstructure. Effects were seen across all of the diffusion properties analyzed (AD, MD, RD, and FA) both globally and locally.
Table 2 illustrates the global significance of each covariate by tract and shows that each was significant below an FDR-corrected p < 0.05 threshold in the omnibus GLM test. Table 2 further breaks down the p values of the post hoc analysis, showing that sex was not significant, whereas age and prior exposures were for each of the diffusion properties. This table also makes it apparent that no single property was solely responsible for the significance. Instead, all four were found individually to be significant.
Honors Thesis Table 2.Omnibus and Post hoc Diffusion Property Global p Values
Tract
Global p Value
Post hoc Global p Values
AD RD MD FA
ac sex age # exp sex age # exp sex age # exp sex age # exp
cc1d cc1v cc2v cc3d cc3v cc4d cc5v ccg_32 ccg_ant ccs cc_tapetum_inf cc_tapetum_sup cg_l cg_r cst_l_frontal cst_l_parietal cst_r_frontal cst_r_parietal fornix_l fornix_r icp_l icp_r ilf_l ilf_r opt_l opt_r optr_l_inferior optr_l_superior optr_r_inferior optr_r_superior scp_l scp_r st_l st_r uf_l_lateral uf_l_medial uf_r_lateral uf_r_medial vsc_l vsc_r
*Post hoc p values for each property are color coded by sex, age, and prior exposures respectively
Honors Thesis There was also widespread significance found with the local, omnibus FDR-corrected p values in Figure 11 with much at p < 0.001. Notably there are some areas found not to be significant, such as the medial portions of the corpus callosum tracts and ventral portions of the inferior cerebellar peduncle tracts.
As a point of reference Figure 10 displays the local FA values along the white matter tracts of a twelve-month old macaque with no prior exposures. Figure 12 shows the local betas merged onto the tracts, illustrating that multiple prior exposures to anesthesia corresponded to a decrease in FA in widespread areas throughout the brain. In most areas, this effect was as much as 0.01 per exposure (FA is measured on a scale from zero to one). When compared alongside Figure 10 this corresponds to as much as a 2-5% decrease most sections of the brain. There are notable exceptions to this however, with posterior portions of the optic tracts seeing an increase in FA associated with multiple exposures. These effects are seen with relative symmetry across hemispheres.
When the diffusion properties are tested individually, as in Figure 13, we see that the prior exposures covariate is still quite significant across the brain. However, FA showed much less significance compared to the other diffusion properties.
FA was the only diffusion property to show an inverse relationship with multiple prior exposures. For AD, MD, and RD a positive relationship was found across the whole brain, with each exposure corresponding to up to a 0.03 increase in diffusivity (Figure 12).
Figure 10. FA measured in a normally developing subject with zero prior exposures. There is variation throughout the brain and along each tract. When compared with Figure 12 this figure gives a sense of the magnitude of the effect a reduction in FA has in different regions.
Honors Thesis
Honors Thesis
Honors Thesis Discussion and Conclusion
In this study, we have shown that dexmedetomidine in combination with reduced doses of standard anesthetics like ketamine and isoflurane significantly alters the developmental trajectory of the white matter microstructure in developing macaques. This effect was observed in widespread areas throughout the brain as a decrease in FA as well as an increase in AD, MD, and RD along the major fiber tracts. The effect increases with the number of exposures to anesthesia.
Our study agrees with previously published results showing anesthetics given during critical early developmental periods lead to measurable changes in the brain even though this is a smaller exposure scheme (Backeljauw et al., 2015; A M Brambrink et al., 2012; Paule et al., 2011). However, unlike other studies this is the first to use DTI to quantify these in brain connectivity. Additionally, this study shows for the first time that a relatively short exposure, as few as one to two hours, is enough to cause an effect. Previously, the lowest tested threshold in macaques was four hours (Raper et al., 2015).
While our study seems to show a direct relationship between the number of exposures and its effects on white matter brain development, the current analysis cannot separate the timing and number of exposures, as these are directly correlated (those subjects with a higher number of exposures have also been exposed at a younger age, refer back to Table 1). Thus it is quite possible that the observed effects are actually related to the timing rather than the number or that we are observing a joint effect of both. This study also lacks a handled control group for
comparison. The maternal-infant separation as well as the injection of anesthetic necessary for each scan are significant stressors on the subject. Whether this has any impact on development and may have contributed to the effects we saw in this study remains unanswered.
Future studies are needed to test the cognitive effects of these structural changes to the white matter and if the effects seen in development diminish into adulthood. In the near future, we are planning to look at structural data from these same subjects that is also publicly available as part of the UNC-Wisconsin Neurodevelopment Database and examine effects relating to volumetrics, cortical thickness, and surface area. Many other questions still remain regarding the differential toxicity of anesthesia protocols, the exposure duration threshold when effects begin to manifest, and ways to mitigate the potential effects with postoperative interventions. In the meantime, this research further reinforces the notion that parents should carefully consult with their physicians and consider deferring elective surgeries in young children.
References
Alexander, A. L., Lee, J. E., Lazar, M., & Field, A. S. (2007). Diffusion tensor imaging of the brain. Neurotherapeutics : The Journal of the American Society for Experimental
NeuroTherapeutics, 4(3), 316–29. http://doi.org/10.1016/j.nurt.2007.05.011
Allen, J. S., Damasio, H., Grabowski, T. J., Bruss, J., & Zhang, W. (2003). Sexual dimorphism and asymmetries in the gray-white composition of the human cerebrum. NeuroImage, 18(4), 880–894. http://doi.org/10.1016/S1053-8119(03)00034-X
Honors Thesis http://doi.org/10.1542/peds.2014-3526
Baird, G., Simonoff, E., Pickles, A., Chandler, S., Loucas, T., Meldrum, D., & Charman, T. (2006). Prevalence of disorders of the autism spectrum in a population cohort of children in South Thames: the Special Needs and Autism Project (SNAP). Lancet, 368(9531), 210– 215. http://doi.org/10.1016/S0140-6736(06)69041-7
Barr, C. S., & Goldman, D. (2006). Non-human primate models of inheritance vulnerability to alcohol use disorders. Addiction Biology, 11(3-4), 374–385. Retrieved from <Go to ISI>://000240304700009
Bennett, A. (2008). Gene Environment Interplay: Nonhuman Primate Models in the Study of Resilience and Vulnerability . Dev Psychobiol.
Bourgeois, J. P., & Rakic, P. (1993). Changes of synaptic density in the primary visual cortex of the macaque monkey from fetal to adult stage. Journal of Neuroscience, 13(7), 2801–2820. Brambrink, A. M., Evers, A. S., Avidan, M. S., Farber, N. B., Smith, D. J., Martin, L. D., …
Olney, J. W. (2012). Ketamine-induced neuroapoptosis in the fetal and neonatal rhesus macaque brain. Anesthesiology, 116(2), 372–384.
http://doi.org/10.1097/ALN.0b013e318242b2cd
Brambrink, A. M., Evers, A. S., Avidan, M. S., Farber, N. B., Smith, D. J., Zhang, X., … Olney, J. W. (2010). Isoflurane-induced neuroapoptosis in the neonatal rhesus macaque brain. Anesthesiology, 112(4), 834–41. http://doi.org/10.1097/ALN.0b013e3181d049cd
Brosnan, H., & Bickler, P. E. (2013). Xenon neurotoxicity in rat hippocampal slice cultures Is Similar to Isoflurane and Sevoflurane. Anesthesiology, 119(2), 335.
http://doi.org/10.1097/ALN.0b013e31829417f0
Calabrese, E., Badea, A., Coe, C. L., Lubach, G. R., Shi, Y., Styner, M. A., & Johnson, G. A. (2015). A diffusion tensor MRI atlas of the postmortem rhesus macaque brain. NeuroImage, 117, 408–416. http://doi.org/10.1016/j.neuroimage.2015.05.072
Caviness, V. S., Kennedy, D. N., Richelme, C., Rademacher, J., & Filipek, P. A. (1996). The human brain age 7-11 years: A volumetric analysis based on magnetic resonance images. Cerebral Cortex, 6(5), 726–736. http://doi.org/10.1093/cercor/6.5.726
Chakrabarti, S., & Fombonne, E. (2001). Pervasive developmental disorders in preschool children. JAMA : The Journal of the American Medical Association, 285(24), 3093–3099. http://doi.org/10.1001/jama.285.24.3093
Courchesne, E., Chisum, H. J., Townsend, J., Cowles, A., Covington, J., Egaas, B., … Press, G. A. (2000). Normal brain development and aging: quantitative analysis at in vivo MR imaging in healthy volunteers. Radiology, 216(3), 672–682.
http://doi.org/10.1148/radiology.216.3.r00au37672
Creeley, C. E., Dikranian, K. T., Dissen, G. a, Back, S. a, Olney, J. W., & Brambrink, A. M. (2014). Isoflurane-induced apoptosis of neurons and oligodendrocytes in the fetal rhesus macaque brain. Anesthesiology, 120(3), 626–38.
Honors Thesis de Bellis, M. D., Keshavan, M. S., Beers, S. R., Hall, J., Frustaci, K., Masalehdan, A., … Boring,
A. M. (2001). Sex differences in brain maturation during childhood and adolescence. Cerebral Cortex, 11(6), 552–557.
Dekaban, A. S. (1978). Changes in brain weights during the span of human life: relation of brain weights to body heights and body weights. Annals of Neurology, 4(4), 345–356.
http://doi.org/10.1002/ana.410040410
Deng, M., Hofacer, R. D., Jiang, C., Joseph, B., Hughes, E. A., Jia, B., … Loepke, A. W. (2014). Brain regional vulnerability to anaesthesia-induced neuroapoptosis shifts with age at
exposure and extends into adulthood for some regions. British Journal of Anaesthesia, 113(3), 443–451. http://doi.org/10.1093/bja/aet469
Engert, F., & Bonhoeffer, T. (1999). Dendritic spine changes associated with hippocampal long-term synaptic plasticity. Nature, 399(6731), 66–70. http://doi.org/10.1038/19978
Falk, D., Froese, N., Sade, D. S., & Dudek, B. C. (1999). Sex differences in brain/body
relationships of Rhesus monkeys and humans. Journal of Human Evolution, 36(2), 233–8. http://doi.org/10.1006/jhev.1998.0273
Fedorov, A., Beichel, R., Kalpathy-Cramer, J., Finet, J., Fillion-Robin, J. C., Pujol, S., … Kikinis, R. (2012). 3D Slicer as an image computing platform for the Quantitative Imaging Network. Magnetic Resonance Imaging, 30(9), 1323–1341.
http://doi.org/10.1016/j.mri.2012.05.001
Filipek, P. A. (1999). Neuroimaging in the developmental disorders: the state of the science. Journal of Child Psychology and Psychiatry, and Allied Disciplines, 40(1), 113–128. http://doi.org/10.1111/1469-7610.00426
Filipek, P. A., Richelme, C., Kennedy, D. N., & Caviness Jr., V. S. (1994). The young adult human brain: An MRI-based morphometric analysis. Cereb Cortex, 4(4), 344–360. Retrieved from
http://www.ncbi.nlm.nih.gov/entrez/query.fcgi?cmd=Retrieve&db=PubMed&dopt=Citation &list_uids=7950308
Flick, R. P., Katusic, S. K., Colligan, R. C., Wilder, R. T., Voigt, R. G., Olson, M. D., …
Warner, D. O. (2011). Cognitive and behavioral outcomes after early exposure to anesthesia and surgery. Pediatrics, 128(5), e1053–61. http://doi.org/10.1542/peds.2011-0351
Franklin, M. S., Kraemer, G. W., Shelton, S. E., Baker, E., Kalin, N. H., & Uno, H. (2000). Gender differences in brain volume and size of corpus callosum and amygdala of rhesus monkey measured from MRI images. Brain Research, 852(2), 263–267.
http://doi.org/10.1016/S0006-8993(99)02093-4
Giedd, J. N., Blumenthal, J., Jeffries, N. O., Castellanos, F. X., Liu, H., Zijdenbos, A., … Rapoport, J. L. (1999). Brain development during childhood and adolescence: a longitudinal MRI study.Nature neuroscience (Vol. 2).
Giedd, J. N., Castellanos, F. X., Rajapakse, J. C., Vaituzis, A. C., & Rapoport, J. L. (1997). Sexual dimorphism of the developing human brain. Progress in
http://doi.org/10.1016/S0278-Honors Thesis 5846(97)00158-9
Giedd, J. N., Snell, J. W., Lange, N., Rajapakse, J. C., Casey, B. J., Kozuch, P. L., … Rapoport, J. L. (1996). Quantitative magnetic resonance imaging of human brain development: ages 4-18. Cereb Cortex, 6(4), 551–560. Retrieved from
http://www.ncbi.nlm.nih.gov/entrez/query.fcgi?cmd=Retrieve&db=PubMed&dopt=Citation &list_uids=8670681
Gilmore, J. H., Lin, W., Corouge, I., Vetsa, Y. S. K., Smith, J. K., Kang, C., … Gerig, G. (2007). Early postnatal development of corpus callosum and corticospinal white matter assessed with quantitative tractography. American Journal of Neuroradiology, 28(9), 1789–1795. http://doi.org/10.3174/ajnr.A0651
Gilmore, J. H., Lin, W., Prastawa, M. W., Looney, C. B., Vetsa, Y. S. K., Knickmeyer, R. C., … Gerig, G. (2007). Regional Gray Matter Growth, Sexual Dimorphism, and Cerebral
Asymmetry in the Neonatal Brain. The Journal of Neuroscience, 27(6), 1255 –1260. http://doi.org/10.1523/JNEUROSCI.3339-06.2007
Glatzel, M., Pekarik, V., Lührs, T., Dittami, J., & Aguzzi, A. (2002). Analysis of the prion protein in primates reveals a new polymorphism in codon 226 (Y226F). Biological Chemistry, 383(6), 1021–1025. http://doi.org/10.1515/BC.2002.109
Goldstein, J. M., Seidman, L. J., Horton, N. J., Makris, N., Kennedy, D. N., Caviness Jr., V. S., … Tsuang, M. T. (2001). Normal sexual dimorphism of the adult human brain assessed by in vivo magnetic resonance imaging. Cerebral Cortex, 11(6), 490–497.
Good, C. D., Johnsrude, I., Ashburner, J., Henson, R. N., Friston, K. J., & Frackowiak, R. S. (2001). Cerebral asymmetry and the effects of sex and handedness on brain structure: a voxel-based morphometric analysis of 465 normal adult human brains. NeuroImage, 14(3), 685–700. http://doi.org/10.1006/nimg.2001.0857
Grant, K. A., & Bennett, A. J. (2003). Advances in nonhuman primate alcohol abuse and alcoholism research. Pharmacology and Therapeutics.
http://doi.org/10.1016/j.pharmthera.2003.08.004
Gur, R. C., Turetsky, B. I., Matsui, M., Yan, M., Bilker, W., Hughett, P., & Gur, R. E. (1999). Sex differences in brain gray and white matter in healthy young adults: correlations with cognitive performance. Journal of Neuroscience, 19(10), 4065–4072.
Gur, R. E., Petty, R. G., Turetsky, B. I., & Gur, R. C. (1996). Schizophrenia throughout life: Sex differences in severity and profile of symptoms. Schizophrenia Research, 21(1), 1–12. http://doi.org/10.1016/0920-9964(96)00023-0
Häfner, H., Maurer, K., Löffler, W., An Der Heiden, W., Munk-Jørgensen, P., Hambrecht, M., & Riecher-Rössler, A. (1998). The ABC schizophrenia study: A preliminary overview of the results. In Social Psychiatry and Psychiatric Epidemiology (Vol. 33, pp. 380–386).
http://doi.org/10.1007/s001270050069
Honors Thesis Hecht, E. E., Gutman, D. A., Bradley, B. A., Preuss, T. M., & Stout, D. (2015). Virtual
dissection and comparative connectivity of the superior longitudinal fasciculus in chimpanzees and humans. NeuroImage, 108, 124–137.
http://doi.org/10.1016/j.neuroimage.2014.12.039
Istaphanous, G. K., Howard, J., Nan, X., Hughes, E. A., McCann, J. C., McAuliffe, J. J., … Loepke, A. W. (2011). Comparison of the neuroapoptotic properties of equipotent anesthetic concentrations of desflurane, isoflurane, or sevoflurane in neonatal mice. Anesthesiology, 114(3), 578–587. http://doi.org/10.1097/ALN.0b013e3182084a70 Jernigan, T. L., & Tallal, P. (1990). Late childhood changes in brain morphology observable
with MRI. Developmental Medicine and Child Neurology, 32(5), 379–385.
Joshi, S., Davis, B., Jomier, M., & Gerig, G. (2004). Unbiased diffeomorphic atlas construction for computational anatomy. In NeuroImage (Vol. 23).
http://doi.org/10.1016/j.neuroimage.2004.07.068
Knickmeyer, R. C., Gouttard, S., Kang, C., Evans, D., Wilber, K., Smith, J. K., … Gilmore, J. H. (2008). A Structural MRI Study of Human Brain Development from Birth to 2 Years. The Journal of Neuroscience, 28(47), 12176–12182. http://doi.org/10.1523/jneurosci.3479-08.2008
Kodama, M., Satoh, Y., Otsubo, Y., Araki, Y., Yonamine, R., Masui, K., & Kazama, T. (2011). Neonatal desflurane exposure induces more robust neuroapoptosis than do isoflurane and sevoflurane and impairs working memory. Anesthesiology, 115(5), 979–91.
http://doi.org/10.1097/ALN.0b013e318234228b
Kulkarni, J., Gurvich, C., Gilbert, H., Mehmedbegovic, F., Mu, L., Marston, N., … de Castella, A. Hormone modulation: a novel therapeutic approach for women with severe mental illness., 42 The Australian and New Zealand journal of psychiatry 83–88 (2008). http://doi.org/10.1080/00048670701732715
Lacreuse, A., & Herndon, J. G. (2009). Nonhuman Primate Models of Cognitive Aging. Animal Models of Human Cognitive Aging. http://doi.org/10.1007/978-1-59745-422-3
Lebel, C., Walker, L., Leemans, A., Phillips, L., & Beaulieu, C. (2008). Microstructural maturation of the human brain from childhood to adulthood. NeuroImage, 40(3), 1044– 1055. http://doi.org/10.1016/j.neuroimage.2007.12.053
Lebherz, C., Maguire, A. M., Auricchio, A., Tang, W., Aleman, T. S., Wei, Z., … Bennett, J. (2005). Nonhuman primate models for diabetic ocular neovascularization using AAV2-mediated overexpression of vascular endothelial growth factor. Diabetes, 54(4), 1141–1149. http://doi.org/10.2337/diabetes.54.4.1141
Lenroot, R. K., & Giedd, J. N. (2006). Brain development in children and adolescents: Insights from anatomical magnetic resonance imaging. Neuroscience and Biobehavioral Reviews. http://doi.org/10.1016/j.neubiorev.2006.06.001
Honors Thesis http://doi.org/10.1016/j.neuroimage.2007.03.053
Liu, Z., Wang, Y., Gerig, G., Gouttard, S., Tao, R., Fletcher, T., & Styner, M. (2010). Quality control of diffusion weighted images. Procedures of SPIE, 7628, 76280J.
http://doi.org/10.1117/12.844748
Lubach, G. R., & Coe, C. L. (2006). Preconception maternal iron status is a risk factor for iron deficiency in infant rhesus monkeys (Macaca mulatta). The Journal of Nutrition, 136(9), 2345–2349.
Machado, C. J., & Bachevalier, J. (2003). Non-human primate models of childhood psychopathology: The promise and the limitations. Journal of Child Psychology and Psychiatry and Allied Disciplines. http://doi.org/10.1111/1469-7610.00103
Makris, N., Papadimitriou, G. M., van der Kouwe, A., Kennedy, D. N., Hodge, S. M., Dale, A. M., … Rosene, D. L. (2007). Frontal connections and cognitive changes in normal aging rhesus monkeys: A DTI study. Neurobiology of Aging, 28(10), 1556–1567.
http://doi.org/10.1016/j.neurobiolaging.2006.07.005
Malkova, L., Heuer, E., & Saunders, R. C. (2006). Longitudinal magnetic resonance imaging study of rhesus monkey brain development. Eur J Neurosci, 24(11), 3204–3212.
http://doi.org/EJN5175 [pii]\r10.1111/j.1460-9568.2006.05175.x
Moffitt, T. E. (1990). Juvenile delinquency and attention deficit disorder: boys’ developmental trajectories from age 3 to age 15. Child Development, 61(3), 893–910.
http://doi.org/10.1111/j.1467-8624.1990.tb02830.x
Moffitt, T. E., & Caspi, A. (2001). Childhood predictors differentiate life-course persistent and adolescence-limited antisocial pathways among males and females. Development and Psychopathology, 13(2), 355–375. http://doi.org/10.1017/S0954579401002097
Nopoulos, P., Flaum, M., & Andreasen, N. C. (1997). Sex differences in brain morphology in schizophrenia. The American Journal of Psychiatry, 154(12), 1648–1654.
Oguz, I., Farzinfar, M., Matsui, J., Budin, F., Liu, Z., Gerig, G., … Styner, M. (2014). DTIPrep: quality control of diffusion-weighted images. Frontiers in Neuroinformatics, 8, 4.
http://doi.org/10.3389/fninf.2014.00004
Paule, M. G., Li, M., Allen, R. R., Liu, F., Zou, X., Hotchkiss, C., … Wang, C. (2011). Ketamine anesthesia during the first week of life can cause long-lasting cognitive deficits in rhesus monkeys. Neurotoxicology and Teratology, 33(2), 220–230.
http://doi.org/10.1016/j.ntt.2011.01.001
Paxinos, G., Xu-Feng, H., & Toga, A. (1999). The Rhesus Monkey Brain in Stereotaxic Coordinates (1st ed.). Academic Press.
Price, K. C., & Coe, C. L. (2000). Maternal constraint on fetal growth patterns in the rhesus monkey (Macaca mulatta): the intergenerational link between mothers and daughters. Human Reproduction (Oxford, England), 15(2), 452–457.
Honors Thesis 9784. http://doi.org/10.1117/12.2217293
R., W., S., B., P., S., D., P., A., K., & S., B. (2008). Nonhuman primate models of NeuroAIDS. Journal of NeuroVirology, 14(4), 292–300. Retrieved from
http://www.embase.com/search/results?subaction=viewrecord&from=export&id=L3523204 64\nhttp://dx.doi.org/10.1080/13550280802074539
Rakic, P., Bourgeois, J. P., Eckenhoff, M. F., Zecevic, N., & Goldman-Rakic, P. S. (1986). Concurrent overproduction of synapses in diverse regions of the primate cerebral cortex. Science (New York, N.Y.), 232(4747), 232–235. http://doi.org/10.1126/science.3952506 Raper, J., Alvarado, M. C., Murphy, K. L., & Baxter, M. G. (2015). Multiple anesthetic exposure
in infant monkeys alters emotional reactivity to an acute stressor. Anesthesiology, 123(5), 1084–1092. http://doi.org/10.1097/ALN.0000000000000851
Rappaport, B. A., Suresh, S., Hertz, S., Evers, A. S., & Orser, B. A. (2015). Anesthetic neurotoxicity--clinical implications of animal models. The New England Journal of Medicine, 372(9), 796–797. http://doi.org/10.1056/NEJMp1414786
Reiss, A. L., Abrams, M. T., Singer, H. S., Ross, J. L., & Denckla, M. B. (1996). Brain
development, gender and IQ in children. A volumetric imaging study. Brain, 119(5), 1763– 1774. http://doi.org/10.1093/brain/119.5.1763
Rilling, J. K., Glasser, M. F., Preuss, T. M., Ma, X., Zhao, T., Hu, X., & Behrens, T. E. J. (2008). The evolution of the arcuate fasciculus revealed with comparative DTI. Nature
Neuroscience, 11(4), 426–428. http://doi.org/10.1038/nn2072
Schaefer, G. B., Thompson Jr., J. N., Bodensteiner, J. B., Hamza, M., Tucker, R. R., Marks, W., … Wilson, D. (1990). Quantitative morphometric analysis of brain growth using magnetic resonance imaging. Journal of Child Neurology, 5, 127–130.
Schmahmann, J. D., & Pandya, D. N. (2009). Fiber Pathways of the Brain. Fiber Pathways of the Brain. http://doi.org/10.1093/acprof:oso/9780195104233.001.0001
Segerstrom, S. C., Lubach, G. R., & Coe, C. L. (2006). Identifying immune traits and
biobehavioral correlates: Generalizability and reliability of immune responses in rhesus macaques. Brain, Behavior, and Immunity, 20(4), 349–358.
http://doi.org/10.1016/j.bbi.2005.09.007
Sowell, E. R., Thompson, P. M., Leonard, C. M., Welcome, S. E., Kan, E., & Toga, A. W. (2004). Longitudinal Mapping of Cortical Thickness and Brain Growth in Normal Children. The Journal of Neuroscience, 24(38), 8223 –8231.
http://doi.org/10.1523/JNEUROSCI.1798-04.2004
Stepanyants, A., Hof, P. R., & Chklovskii, D. B. (2002). Geometry and structural plasticity of synaptic connectivity. Neuron, 34(2), 275–288.
http://doi.org/10.1016/S0896-6273(02)00652-9
Honors Thesis PHOTO-OPTICAL INSTRUMENTATION ENGINEERS (SPIE); Medical Imaging 2008 Conference, 6914, K9142–K9142. http://doi.org/10.1117/12.772353
Sullivan, E. V, Sable, H. J. K., Strother, W. N., Friedman, D. P., Davenport, A., Tillman-Smith, H., … Grant, K. A. (2005). Neuroimaging of rodent and primate models of alcoholism: initial reports from the integrative neuroscience initiative on alcoholism. Alcoholism,
Clinical and Experimental Research. http://doi.org/10.1097/01.ALC.0000153546.39946.EC Szatmari, P., Offord, D. R., & Boyle, M. H. (1989). Ontario Child Health Study: prevalence of
attention deficit disorder with hyperactivity. The Journal of Child Psychology and Psychiatry and Allied Disciplines, 30(2), 219–230. Retrieved from
http://www.ncbi.nlm.nih.gov/pubmed/2708462
Tustison, N. J., Avants, B. B., Cook, P. A., Zheng, Y., Egan, A., Yushkevich, P. A., & Gee, J. C. (2010). N4ITK: Improved N3 bias correction. IEEE Transactions on Medical Imaging, 29(6), 1310–1320. http://doi.org/10.1109/TMI.2010.2046908
Van Leemput, K., Maes, F., Vandermeulen, D., & Suetens, P. (1999). Automated model-based tissue classification of MR images of the brain. IEEE Transactions on Medical Imaging, 18(10), 885–896. http://doi.org/10.1109/42.811268
Verde, A. R., Budin, F., Berger, J.-B., Gupta, A., Farzinfar, M., Kaiser, A., … Styner, M. (2014). UNC-Utah NA-MIC framework for DTI fiber tract analysis. Frontiers in Neuroinformatics, 7(January), 51. http://doi.org/10.3389/fninf.2013.00051
Wise-Faberowski, L., Quinonez, Z. A., & Hammer, G. B. (2014). Anesthesia and the developing brain: relevance to the pediatric cardiac surgery. Brain Sciences, 4(2), 295–310.
http://doi.org/10.3390/brainsci4020295
Honors Thesis Appendix
Table 3. White Matter Fiber Tract Abbreviations
Tract Abbreviation
anterior commissure ac
corpus callosum segment 1 dorsal cc1d
corpus callosum segment 1 ventral cc1v
corpus callosum segment 2 ventral cc2v
corpus callosum segment 3 dorsal cc3d
corpus callosum segment 3 ventral cc3v
corpus callosum segment 4 dorsal cc4d
corpus callosum segment 5 ventral cc5v
corpus callosum genu grey matter area 32 insertion ccg_32 corpus callosum genu anterior segment ccg_ant
corpus callosum splenium ccs
tapetum of the corpus callosum inferior segment cc_tapetum_inf tapetum of the corpus callosum superior segment cc_tapetum_sup
cingulum* cg
corticospinal tracts frontal lobe origin* cst_frontal corticospinal tracts parietal lobe origin* cst_parietal
fornix* fornix
inferior cerebellar peduncle* icp
inferior longitudinal fasciculus* ilf
optic tract* opt
optic radiation inferior segment* optr_inf
optic radiation superior segment* optr_sup
superior cerebellar peduncle* scp
stria terminalis* st
uncinate fasciculus lateral segment* uf_lateral uncinate fasciculus medial segment* uf_medial
ventral spinocerebellar tract* vsc
Honors Thesis