The Role of Pyruvate Kinase Isoform M2 (PkM2) in the Survivorship of Smoothened-driven Mouse Models of Medulloblastoma
By Taylor Fish
Senior Honors Thesis Department of Biology
University of North Carolina at Chapel Hill
April 2015
Approved:
INTRODUCTION
Medulloblastoma is the most common malignant pediatric brain tumor. This cerebellar neoplasm affects an estimated 1 in 150,000 children1. Medulloblastoma arises from the aberrant
proliferation of cerebellar granule neuron progenitors (CGNPs) located in the external granule cell layer (EGL) of the cerebellum2,3. Current therapy for medulloblastoma involves surgical resection, where possible, and aggressive radiation therapy and chemotherapy4,5. With this standard of treatment, long-term survival of up to 80% has been achieved for patients without high-risk criteria4. Despite recent advancements, medulloblastoma is still incurable in
approximately one third of patients5, and the high toxicity of the aggressive therapy often has detrimental effects on survivors, most notably measurable cognitive decline4,5. Understanding the cellular mechanisms mediating cancer growth may lead to less toxic targeted cancer therapies for medulloblastoma.
The Warburg effect in cancer is influenced by the preferential expression of the embryonic isoform M2 of pyruvate kinase (PkM2) over the adult isoform M1 (PkM1)3,7,8,9. Pyruvate kinase is the enzyme responsible for catalyzing the dephosphorylation of
phosphoenolpyruvate (PEP) into pyruvate during the final step of glycolysis7,9. PkM1 and PkM2 isoforms are produced through alternative splicing of mutually exclusive exons within the PkM gene7,9. PkM1 predominates in normal, non-proliferating cells and its expression supports high ATP production through oxidative phosphorylation of the pyruvate produced in glycolysis7,9. Unlike the constitutively active PkM1, the activity of PkM2 is tightly regulated7,8. Allosteric
binding of fructose-1,6-bisphosphate (FBP) activates tetramerization of PkM2, causing the enzyme to produce pyruvate for oxidative phosphorylation7,9. However, binding of tyrosine-phosphorylated peptides to PkM2 has been found to catalyze the release of FBP8. The release of FBP reverts PkM2 to its less active dimer, which promotes aerobic glycolysis and lactate
production7,9. Cancerous cells likely preferentially express PkM2 in order to take advantage of
this complex system of regulation. Negative regulation of PkM2 may be responsible for the build-up of biomass in cancerous cells, as the glycolytic intermediates upstream from the pyruvate kinase reaction could be redistributed to other anabolic pathways3,6,7.
A variety of mouse lines have been created to study the biology of medulloblastoma; two of such models, SmoA1 and SmoM2, were used in this study. Both lines take advantage of the Sonic Hedgehog (Shh) pathway1,2,3,10, one of the cellular pathways implicated in
medulloblastoma development2,4,5. In these murine models, a mutated form of the protein Smoothened (Smo) is constitutively activated through a transgenic W539L point mutation11,12. This mutation occurs in the seventh transmembrane domain of Smo, and is thought to disrupt the ability of Patched to inhibit Smo activity12. The resulting constitutive activation of Smo increases the activity of its downstream effectors, including Gli family transcription factors4,5,12 and
D-cyclins1,10. These effectors, which normally attenuate at the end of development, are responsible for driving the cell cycle forward. The resulting increased cellular proliferation supports tumor development.
While both the SmoA1 and SmoM2 lines model medulloblastoma development, the lines have some key differences. The SmoA1 model expresses a constitutively active mutant allele of Smo under the control of the NeuroD2 promoter1. NeuroD2 is specifically expressed in the CGNPs of the EGL, and expression of the SmoA1 allele under this promoter results in
with the SmoM2 allele13,14. Tumor onset and progression in this mouse line is much faster than that of the SmoA1 line, with medulloblastoma development occurring by P123.
The purpose of this project was to determine the relationship between a conditional deletion of PkM2 and survival rates of mice within these two medulloblastoma models. In addition, PkM2 and PkM1 expression was compared between the two murine models used, and any differences in phenotype resulting from the deletion of PkM2 in each model was analyzed. MATERIALS AND METHODS
Animals
Mice were handled in compliance with Institutional Animal Care and Use Committee (IUCAC) regulations. NeuroD2:SmoA1 mice were provided by Dr. James Olson (Fred Hutchinson Cancer Research Center, Seattle WA). Math1-Cre mice were provided by David Rowitch (University of California at San Francisco, San Francisco, CA). SmoM2 mice were obtained from Jackson Laboratories (Bar Harbor, ME). hGFAP-Cre mice were provided by Dr. Evan Anton (University of North Carolina, Chapel Hill, NC). PkM2fl/fl mice were provided by Matthew Vander Heiden (Massachusetts Institute of Technology, Cambridge, MA). These mice had Lox P sites flanking either end of exon 10 of the PkM gene, such that this exon would be deleted in the presence of a Cre recombinase. This deletion was found to prevent the expression of PkM2 without interfering with PkM1 expression9.
Genotyping
One toe from each mouse was clipped between the ages of P5-P8; a different toe was clipped from each mouse to allow for future identification. Each toe was placed in 80 uL of tail lysis buffer and incubated at 55oC overnight to allow for the digestion of the tissue and release of DNA. Next, the genotypes of interest were determined by amplification of the DNA
corresponding to the gene of interest (PkM2, SmoA1, SmoM2, hGFAP-Cre, etc.) by PCR. Platinum Blue Mastermix was used as the DNA polymerase for the SmoA1 PCR reaction, while Apex Mastermix was used as the DNA polymerase in all other reactions. The PCR product was run by electrophoresis on a 1.3% agarose gel, containing 1.2 uL of SYBR-green for
visualization, at 150V for 50 min. The separated bands of DNA in the gel were then visualized under a UV-light illuminator and imaged. The genotype of each mouse was determined from interpretation of this gel and recorded.
Kaplan-Meier Survival Curve
Histology and Immunohistochemistry
For each of the animals sacrificed due to poor health, a brain hemisphere was harvested and fixed in 4% PFA for 24 hours. The hemispheres were then transferred to solutions of 1X PBS, 50% EtOH/50% PBS, and 70% EtOH for approximately 24 hours each. These samples were then sent to the UNC Center for Gastrointestinal Biology and Disease (CGIBD) Histology Core to be embedded in paraffin wax, sagittally sectioned at 5 um, and mounted onto glass slides. Once generated, one slide from each sample was H&E stained by UNC CGIBD. The remaining slides for each sample were sent to the UNC Translational Pathology Laboratory (TPL) to be stained for PkM1 and PkM2. The stained slides were then imaged and uploaded onto Aperio eSlide Manager Online Database by UNC TPL.
Quantitative RT-PCR
For each of the animals sacrificed due to their health, a tumor tissue lysate was harvested and flash frozen on dry ice. Total RNA from these tissue samples was then isolated using the RNeasy Mini Kit (Qiagen). Once isolated, concentration of RNA in the stock samples was determined using a NanoDrop spectrophotometer. Using this concentration for each sample, 1 ug of mRNA was used to synthesize first strand cDNA using the Invitrogen Superscript III Reverse Transcriptase Kit (Life Sciences). cDNA corresponding to PkM1, PkM2, and total PkM primers was then amplified and quantified by an Applied Biosystems 7500Fast RT PCR system, using BioRad SYBER Green Super Mix. The obtained CT values were normalized, and fold change in
PkM1, PkM2, and total PkM expression for each of the genotype variants was determined relative to wild-type. GAPDH expression was used as an endogenous control.
RESULTS
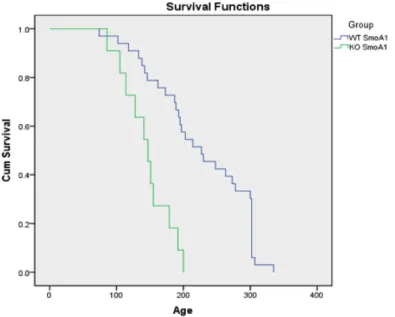
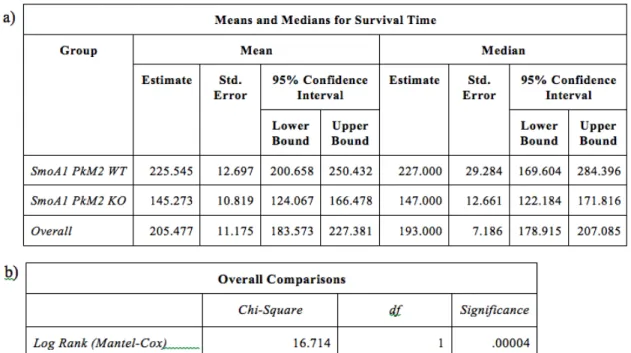
To determine the relationship between the survival of SmoA1 mice and the loss of PkM2, a survival experiment was performed resulting in a Kaplan-Meier survival curve with statistical analysis. A survival table was constructed from the raw data of mouse PkM2 genotype and age of death (Appendix I). The probability of survival for any given PkM2 genotype at a given time point was calculated and shown on this table. From these probabilities, a survival curve for each of the PkM2 genotypes was graphed (Fig. 1). The mean and median age of death for mice within each PkM2 genotype was determined (Fig. 2a), and statistical comparisons made (Fig. 2b). Whereas SmoA1 mice with a wild-type PkM2 gene survived to a median age of death of P227, SmoA1 mice with a conditional deletion in the PkM2 gene died much earlier, with a median age of death of P147. This difference in survivorship shows that the rate of death, and therefore the rate of tumor growth is significantly accelerated in mice with a conditional deletion of PkM2. This indicates that a PkM2 deletion confers a survival disadvantage in the transgenic SmoA1 mouse model.
Figure 2. a) Kaplan-Meier survival data for SmoA1tg/+ mice with (KO) or without (WT) a conditional deletion of PkM2 with mean and median age of death and a 95% confidence interval. b) Statistical analysis of the relationship between the conditional deletion of PkM2 and the age of death in SmoA1tg/+ mice. The data illustrates a statistically significant decrease in the survival rates of SmoA1tg/+ mice with a conditional deletion of PkM2 relative to mice with WT PkM2.
SmoM2 Survivorship
An identical survival experiment was performed to determine the relationship between the survival of hGFAP-Cretg/+ SmoM2f/w mice and the loss of PkM2, again resulting in a Kaplan-Meier survival curve with statistical analysis. The raw data of mouse PkM2 genotype and age of death was used to construct a table of survival probabilities for any given PkM2 genotype at a given time point for the hGFAP-Cretg/+ SmoM2f/w mouse line (Appendix II). A survival curve for each of the PkM2 genotypes was created using these probabilities (Fig. 3). Average age of death for mice within each PkM2 genotype was determined (Fig. 4a), and statistical comparisons made (Fig. 4b). As seen in the curve, rate of death, and therefore rate of tumor growth, is not
Thus, the data indicates that a PkM2 deletion does not confer any survival advantage or disadvantage in the hGFAP-Cre induced SmoM2 mouse model.
Figure 3. Kaplan-Meier survival curve for hGFAP-Cretg/+ SmoM2fl/w mice with (KO) or without (WT) a conditional deletion of PkM2. The data does not illustrate any marked change in survival rates for hGFAP-Cretg/+ SmoM2fl/w mice with a conditional deletion of PkM2.
Histology and Immunohistochemistry
To test the effect of the conditional deletion on protein expression between the two models, tissue sections harvested from mice from each survivorship study were stained for PkM1 and PkM2 expression (Fig. 5 & 6). In the SmoA1 model, PkM1 expression was found to be high in the non-proliferating, differentiated cells of the cerebrum and cerebellum, and low in the cancerous cells in the cerebellum (Fig. 5ab). There was not a significant change in PkM1
expression between the mice with the conditional deletion of PkM2 (Fig. 5b), and the mice wild-type for PkM2 (Fig. 5a). PkM2 expression was higher in the cancerous cells of the cerebellum relative to the differentiated cells of the cerebrum in the PkM2 wild-type mice (Fig. 5c). The mice with a conditional deletion for PkM2 however exhibited a marked reduction in PkM2 expression in the whole brain (Fig. 5d). In the SmoA1 model, it is also evident that the
conditional deletion of PkM2 results in a larger tumor size and a decreased amount of normally developed cerebellum in the PkM2 KO mice (Fig. 5bd) relative to the PkM2 WT mice (Fig. 5ac).
decreased differentiation are evident with the PkM2 conditional deletion. a) SmoA1 PkM2 WT mouse brain stained for PkM1, b) SmoA1 PkM2 KO mouse brain stained for PkM1, c) SmoA1 PkM2 WT mouse brain stained for PkM2, d) SmoA1 PkM2 KO mouse brain stained for PkM2
The pattern of expression for PkM1 and PkM2 in the SmoM2 model was found to be the same as the SmoA1 model. PkM1 expression was higher in the non-proliferating cells of the cerebrum (Fig. 6ab) and PkM2 expression was higher in the cancerous cells in the cerebellum (Fig. 6c). The conditional deletion of PkM2 also did not significantly change PkM1 expression (Fig. 6ab) but did result in a marked reduction in PkM2 expression (Fig. 6cd). In contrast however, PkM2 conditional deletion did not result in an apparent increased tumor size and decreased normal cerebellar tissue (Fig. 6), as it did in the SmoA1 model.
Figure 6. Immunohistochemistry (IHC) stains for PkM1 and PkM2 from hGFAP-Cre SmoM2 mice with a conditional deletion of PkM2. The slides show that the conditional deletion of PkM2 does not significantly affect PkM1 expression. However, PkM2 expression significantly decreases with the PkM2 conditional deletion. a) hGFAP-Cre SmoM2 PkM2 WT mouse brain stained for PkM1, b) hGFAP-Cre SmoM2 PkM2 KO mouse brain stained for PkM1, c) hGFAP-Cre SmoM2 PkM2 WT mouse brain stained for PkM2, d) hGFAP-Cre SmoM2 PkM2 KO mouse brain stained for PkM2
Quantitative RT-PCR
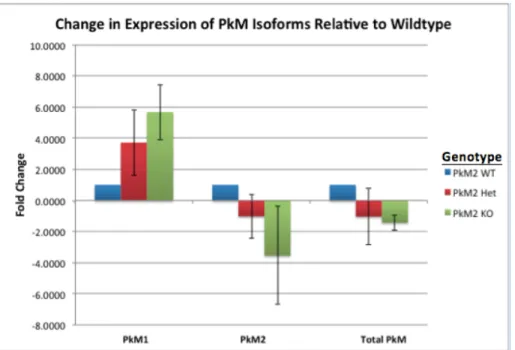
from sacrificed mice from the survivorship study. These tissue lysates were analyzed for changes in PkM1, PkM2, and total PkM expression with the conditional deletion of PkM2 (Fig. 7). The results indicate a relative pattern of increased PkM1 expression and decreased PkM2 expression with the conditional deletion of PkM2 in medulloblastoma. Despite this relative pattern, the relationship between these differences and the conditional deletion did not reach statistical significance, except in the case of the comparison of PkM2 expression between PkM2 Het and PkM2 KO tumor tissues (p = 0.017). The conditional deletion slightly decreased the overall expression of M-isoform pyruvate kinases (PkM1/2), but this decrease also did not reach statistical significance.
Figure 7. Fold change for expression of PkM1, PkM2 and total M-isoform pyruvate kinases (PkM1/2) for each of the PkM2 genotype variants relative to wild-type (WT=1). Fold change was determined using the equation 2–ΔΔCt relative to PkM2 WT.GAPDH was used as an endogenous control to determine ΔCT. The data illustrates the relative pattern of decreased PkM2 and increased PkM1 expression with the conditional deletion of PkM2.
DISCUSSION
cells within a tumor gives these cells an advantage that allows them to more rapidly progress through the cell cycle, thus promoting tumor growth6,9. Multiple studies have implicated the role of PkM2 expression in tumorigenesis. High PkM2 expression is associated with worse clinical outcomes of patients with gastric cancers7. Additionally, the conditional deletion of PkM2 was found to accelerate tumor formation in Brca-driven breast cancer models9. The role of PkM2 in the tumor development of medulloblastoma, which had not previously been elucidated, was expected to follow a similar pattern.
In contrast, the survivorship data from the study on the hGFAP-Cretg/+ SmoM2f/w medulloblastoma model did not show any significant change in survivorship due to the conditional deletion of PkM2 (Fig. 3). Additionally, there was no change in the rate at which tumor growth occurred. This might have been the result of the speed at which tumors progress in this murine model. The majority of the mice, regardless of their PkM2 genotype, died between the ages of P15 and P25. Because hGFAP-Cre is activated very early in the development of the mouse, these tumors begin forming at a much earlier age, and thus result in the death of the mouse at a much earlier age. Therefore, it is possible that PkM2 has the same effect on tumor growth in the SmoM2 model as it does in the SmoA1 model, but that the SmoM2 mouse dies from its tumor before any effect from the differential expression of PkM2 can be observed. Unpublished data by the Gershon Lab has shown that a SmoM2 medulloblastoma model promoted by Math1-Cre, rather than hGFAP-Cre, also showed no change in survival time with the conditional deletion of PkM2. These results indicate that a lack of survival difference based on PkM2 genotype for the hGFAP-Cretg/+ SmoM2f/w mice is more likely due to the speed and potency of tumorigenesis of the SmoM2 medulloblastoma model masking the effect of the PkM2 deletion, than to a complete lack of an effect of PkM2 deletion on tumorigenesis in this model.
expressed higher levels of PkM2. Additionally, the conditional deletion of PkM2 in both models resulted in a marked decrease in PkM2 expression within the whole of the brain, illustrating the effectiveness of the PkM2 deletion by Cre recombinase. A similarly significant decrease in fold change of PkM2 expression was observed between the PkM2 KO genotype and the PkM2 Het genotype from qPCR analysis (Fig 7).
While no key differences in PkM1 and PkM2 expression were observed between the two models, the IHC data illustrated a differential phenotype in morphology between the models. From this data, the deletion of PkM2 in SmoA1 model appears to results in larger tumor and a lower amount of differentiated cerebellar tissue compared to the PkM2 WT within this model (Fig 5). This indicates that the inhibition of pyruvate kinase activity could provide a mechanism that accelerates proliferation and decelerates, or even inhibits, differentiation of normal tissue. The presence of such a mechanism could explain the basis for the increased tumor malignancy and reduction in life expectancy seen in the survival curve for SmoA1.
as the tissue lysates from which mRNA was extracted for qPCR were collected on the date of death of the mouse, rather than at a uniform time point. The resulting high variability in protein expression within genotype variants was likely responsible for the observed high standard deviation and low values of statistical significance. An increased sample size could compensate for such variability and potentially allow the patterns of differential expression observed in the qPCR data to reach statistical significance in future experiments. Repeating this experiment for tumor tissue lysates harvested from animals from the SmoM2 survivorship study would provide an additional look at potential differences in protein expression between the two models.
Because very similar expression patterns for PkM1 and PkM2 are seen between the two models, the differential survival phenotype observed in the survivorship studies is not likely due to differences in the way in which PkM2 expression is controlled in the models. Rather, these differences likely result from the differential rates for tumor growth, which, as discussed earlier, are a function of the manner in which the constituent activation of Smo is promoted. The
In addition to this investigative power, each model has other factors that influence how ideal of a model it is for a given study. Although the SmoM2 model is not as effective at studying tumor accelerating mutations, this model offers the benefit of a high degree of control over tumor formation on the part of the experimenter. The host tissue and developmental time point in which tumor formation will occur can be controlled by the selection of a variety of promoters to express the Cre recombinase. Additionally, this model offers a ~100% tumor development rate for offspring with both mutated Smo alleles and the Cre recombinase
expressing allele. In contrast, the SmoA1 model offers less control over tumor development on the part of the investigator. While the relative location and time of tumor development can be controlled by the selection of a promoter for the mutated Smo allele, the model requires that the breeder mice possess the gene for tumor development. Because the breeders are at risk for developing tumors, and productivity of reproduction is affected by the lifespan of the mice, the potential for genetic drift and selection against tumor growth is a possibility in this model. All of these factors must be weighed in the choice of a model to investigate the effect of a particular mutation.
The elucidation of the effect of PkM2 on tumor development implicates it as a potential target for targeted medulloblastoma therapies. Since the deletion of PkM2 was found to
CONCLUSION
The conditional deletion of PkM2 was found to accelerate tumor formation and decrease survival rates of mice in the SmoA1 medulloblastoma model but not the SmoM2 model. This data suggests that PkM2 catalytic activity is not a requirement for the formation of
medulloblastoma and supports the theory that PkM2 preference in tumors is the result of its ability to be regulated in its glycolytic function and not due to any oncogenic transcriptional properties. Additionally, the lack of significant differential expression of PkM1 and PkM2 between the models indicates that the observed differences in phenotype derive from the nature of the models themselves.
LITERATURE CITED
1. Hallahan, A. R. The SmoA1 Mouse Model Reveals That Notch Signaling Is Critical for the Growth and Survival of Sonic Hedgehog-Induced Medulloblastomas. Cancer Res. (2004) 64: 7794-7800.
2. Gershon, T.R. et. al. Hexokinase-2-mediated Aerobic Glycolysis Is Integral to Cerebellar Neurogenesis and Pathogenesis of Medulloblastoma. Cancer Metabolism. (2013), 1:2. 3. Tech, K. et. al. Adaptations of energy metabolism during cerebellar neurogenesis are
co-opted in medulloblastoma. Cancer Lett. (2014), 356: 268-272
4. Gershon, T.R. & Becher, O.J. Medulloblastoma: therapy and biologic considerations.
Curr Neurol Neurosci Rep. (2006), 6: 200-216
5. Gilbertson, R.J. Medulloblastoma: Signalling a Change in Treatment. Lancet Oncol. (2004), 5: 209-218.
7. Wong, N. et. al. PKM2, a Central Point of Regulation in Cancer Metabolism. Int J Cell Bio. (2013), 2013 : 1-11.
8. Christofk, H. et. al. Pyruvate kinase M2 is a phosphotyrosine-binding protein. Nature. (2008), 452: 181-186
9. Israelsen, W.J., et. al. PKM2 Isoform-Specific Deletion Reveals a Differential Requirement for Pyruvate Kinase in Tumor Cells. Cell. (2013), 155: 397-409.
10.Mao, J. et. al. A Novel Somatic Mouse Model to Survey Tumorigenic Potential Applied to the Hedgehog Pathway. Cancer Res. (2006) 66: 10171-10178.
11.Taipale, J. et. al. Effects of oncogenic mutations in Smoothened and Patched can be reversed by cyclopamine. Nature. (2000), 406: 1005-1009.
12.Xie, J. et. al. Activating Smoothened Mutations in Sporadic Basal-cell Carcinoma. Nature (London). (1998), 391: 90-92.
13.Zhuo, L. et. al. hGFAP-cre Transgenic Mice for Manipulation of Glial and Neuronal Function in Vivo. Genesis. (2001), 31: 85-94.
14.Schuler, U. et. al. Acquisition of granule neuron precursor identity is a critical
APPENDICES
I) SmoA1 Survivorship Probability Table
Survival Table
Genotype Time (days)
Cumulative Proportion Surviving at the Time
N of Cumulative Events N of Remaining Cases Estimate Std. Error
SmoA1 PkM2 WT
1 74.000 .970 .030 1 32
2 102.000 .939 .042 2 31
3 118.000 .909 .050 3 30
4 133.000 .879 .057 4 29
5 138.000 .848 .062 5 28
6 142.000 .818 .067 6 27
7 146.000 .788 .071 7 26
8 162.000 .758 .075 8 25
9 173.000 .727 .078 9 24
10 187.000 .697 .080 10 23 11 189.000 .667 .082 11 22 12 193.000 .636 .084 12 21 13 195.000 .606 .085 13 20 14 197.000 .576 .086 14 19 15 203.000 .545 .087 15 18 16 214.000 .515 .087 16 17 17 227.000 .485 .087 17 16 18 230.000 .455 .087 18 15 19 248.000 .424 .086 19 14 20 263.000 .394 .085 20 13 21 273.000 .364 .084 21 12 22 278.000 .333 .082 22 11 23 300.000 .303 .080 23 10
25 302.000 . . 25 8
26 302.000 . . 26 7
27 302.000 . . 27 6
28 302.000 . . 28 5
29 302.000 . . 29 4
30 302.000 . . 30 3
31 302.000 .061 .042 31 2
32 307.000 .030 .030 32 1
33 335.000 .000 .000 33 0
SmoA1 PkM2 KO
1 86.000 .909 .087 1 10
2 105.000 .818 .116 2 9
3 114.000 .727 .134 3 8
4 128.000 .636 .145 4 7
5 141.000 .545 .150 5 6
6 147.000 .455 .150 6 5
7 151.000 .364 .145 7 4
8 155.000 .273 .134 8 3
9 179.000 .182 .116 9 2
10 192.000 .091 .087 10 1
11 200.000 .000 .000 11 0
II) SmoM2 Survivorship Probability Table
Survival Table
Genotype Time (days)
Cumulative Proportion Surviving at the Time
N of Cumulative Events
N of Remaining Cases
Estimate Std. Error
hGFAP-Cre SmoM2 PkM2 WT
1 13.000 .857 .132 1 6
2 14.000 .714 .171 2 5
3 18.000 .571 .187 3 4
5 22.000 .286 .171 5 2
6 25.000 .143 .132 6 1
7 36.000 .000 .000 7 0
hGFAP-Cre SmoM2 PkM2 KO
1 13.000 .960 .039 1 24
2 14.000 . . 2 23
3 14.000 .880 .065 3 22
4 15.000 . . 4 21
5 15.000 .800 .080 5 20
6 16.000 . . 6 19
7 16.000 .720 .090 7 18
8 17.000 . . 8 17
9 17.000 . . 9 16
10 17.000 . . 10 15
11 17.000 . . 11 14
12 17.000 . . 12 13
13 17.000 .480 .100 13 12
14 18.000 . . 14 11
15 18.000 . . 15 10
16 18.000 . . 16 9
17 18.000 .320 .093 17 8
18 19.000 .280 .090 18 7
19 20.000 .240 .085 19 6
20 21.000 . . 20 5
21 21.000 . . 21 4
22 21.000 .120 .065 22 3
23 23.000 .080 .054 23 2
24 28.000 .040 .039 24 1