Haoyang Li. Amazon Product Reviews Helpfulness Prediction. A Master’s Paper for the M.S. in IS degree. April, 2017. 43 pages. Advisor: Jaime Arguello
E-commerce business become successful by offering people convenient online experience as well as providing tens of thousands of crowd-sourced reviews that are written by customers and users about their experiences and opinions regarding the products or the services they paid for. For an online shopping website, such as Amazon.com, it is very important to recommend high-quality product reviews to the website users because customers make decisions based on what they read from the reviews. However, there are simply way too many reviews out there, and it would be a dreadful task for anyone to read them all. In this paper, we try to build a logistic regression model that canthan predict helpfulness of reviews.
Headings:
E-commerce Product Reviews
AMAZON PRODUCT REVIEWS HELPFULNESS PREDICTION
by Haoyang Li
A Master’s paper submitted to the faculty of the School of Information and Library Science of the University of North Carolina at Chapel Hill
in partial fulfillment of the requirements for the degree of Master of Science in
Information Science.
Chapel Hill, North Carolina
April 2017
Approved by
_______________________________________
Contents
I. Introduction ... 2
Background ... 2
Problems of Quantity and Quality ... 3
II. Background ... 5
Product Review Helpfulness Definition ... 5
Quantitative and Qualitative Factors of Product Review Helpfulness ... 6
Product Review Helpfulness Predictive Models ... 7
Project Concept & Hypnoses ... 13
Definition of Helpfulness ... 14
III. Method ... 15
Data set ... 15
The Statistical Aspects of the Review Data ... 19
Pre-processing ... 21
Structural Features... 21
Reviewer Features ... 23
Meta-data Features ... 25
Logistic Regression Model... 26
IV. Evaluation ... 28
VI. Conclusion ... 34
VI. Future Work ... 36
I. Introduction
Background
Reviews are evaluations about various things, ranging from tangible items, such as
books, cars, and electronics, to intangible items, such as movies, video games, and
websites. According to the Cambridge Dictionary, a product review is “a report in a
newspaper, magazine, or programme in which an expert gives an opinion about a product
or compares various similar products (Cambridge Dictionary).” As the web2.0 (O'Reilly,
2005) has enriched people’s online experience with higher levels of user participation by
allowing us to evaluate, review, comment, tag, and so forth, the definition of product
review has expanded to “a report about a product written by a customer on a commercial
website to help people decide if they want to buy it (Cambridge Dictionary),” which is
the main focus of this study.
Retail websites, such as Ebay.com and Amazon.com, allow all users to rate
products in the form of numerical star ratings on the scale of 1 to 5 along with textual
comments. Some researchers (Kumar & Benbasat, 2006) pointed out the relationship
between the presence of customer reviews on a website and customers’ perceptions of
the usefulness of the product. In the same study, Kuma& Benbasat argue that the product
reviews help with increasing users’ time spent on the website, namely the “stickiness.”
Also, the social presence of the website is reinforced as a sense of community is created
the quality of product reviews can improve consumers' purchasing intention, and 2)
as the number of reviews increases, the purchasing intention increases as well (Park, Lee,
&Han, 2007). The value of online product reviews is recognized not only by businesses,
but not all of the reviews can help with shoppers make decisions.
Problems of Quantity and Quality
As much as customers would love to fully utilize convenience of the product
reviews, there are two limitations: the quantity of the reviews and the quality of the
reviews, which are mentioned in many research articles (Liu & etc 2008; Qing & etc
2011). As the availability and popularity of the product reviews increase, the quantity of
product reviews has grown so much that it would take one person forever to read each
and every review. Also, since product reviews are crow-scoured, meaning that everyone
are welcome to write their own at any time, the reviews are of inconsistent quality.
First of all, there are too many reviews and too little time. For example, at the time
of writing this proposal, the top seller under the “pet supplies” category on Amazon.com,
a cat litter product, has over 10,000 reviews. Moreover, there are 1,224 items if we search
“cat litter” on Amazon.com, so it would be a rather daunting task to go over reviews of
each cat litter to pick the best one (Amazon.com). Second of all, not all reviews are born
“equal.” There are “good” reviews coming from real and unbiased users, but there are
also “bad” reviews coming from auto generators or biased reviewers. Also, there are
complained about might have been fixed now, but such improvement has not been
II. Background
Product Review Helpfulness Definition
According to Qing, “product review usefulness is the subjective evaluation of
reviews by their characteristics or ability of providing useful assistance given by peers
(Qing, Wenjing, & Qiwei, 2011).” Major E-commerce Websites, such as
TripAdvisor.com and Amazon.com, ask users questions like “Was this review helpful to
you?” to gather peer to peer evaluations on product reviews with a binomial variable of
“yes” or “no.” The helpfulness data of each review is then accumulated and displayed it
in a sentence like “717 people found this helpful,” and the most helpful reviews rated by
customers are usually listed first.
Figure 1 A snapshot of a product review on the Amazon.com
As the Figure 1 above shows, on the bottom of each product review on
found this helpful,” and the question, “Was this review helpful to you?” The users can
click on the “Yes” or “No” button to either endorse or disagree with other people’s
reviews. Other websites like Yelp.com gathers helpfulness vote in the similar way as
Amazon.com.
Some of the websites let users sort reviews by ratings, date of written, and also by
sentiment (“positive” or “critical”). The value of using product reviews is recognized by
business as well as researchers, who deem that product reviews aid decision making and
branding management (Georg Lackermair, Daniel Kailer, Kenan Kanmaz, 2013).
Quantitative and Qualitative Factors of
Product Review Helpfulness
Depending on the datasets, the models, and the research questions, we observe
that helpfulness is usually studied differently from case to case. Many earlier studies and
a few recent ones prefer the quantitative approach, such as word count, star ratings, and
helpfulness ratio. For example, Korfiatisa and his colleagues defined the quality of the
product review as “the number of people who found it helpful out of the total number of
people who had read and evaluated the view (Korfiatisa, García-Bariocanalb, &
Sánchez-Alonso, 2012).” Similarly, Pang et. al. focus on the thumbs up and down to classify,
analyze, and rank the quality of the reviews (Pang, Lee, & Vaithyanathan, 2002).
On the other hand, more recent studies recognize the importance of measuring
qualitative factors such as product categories, reviewer impact, and cumulative
expected fraction of people who will find the review helpful,” and this implies that
review quality is a number between zero to one with higher values indicating more
helpfulness. (Liu, Huang, An, & Yu, Modeling and Predicting the Helpfulness of Online
Reviews, 2008) However, Liu and others’ work relies largely on qualitative factors of
review such as the writing style and timeliness. Another example is Huang and others’
published work last year, which found quantitative factors such as word count have a
threshold type of effect on review quality, meaning that the improvements on the review
helpfulness turns out to be rather negligible after the length of reviews passing a certain
number. Huang and others’ definition is that the review helpfulness “represents the
subjective valuation of the review judged by others, and is also the aggregate perceived
utility of the information contained in the review (Huanga, Chenb, Yenc, & Tran, 2015).”
Product Review Helpfulness Predictive Models
The review quality can be rather complex given its multi-dimensional nature, and
the predictive modelling designs demonstrate even larger variability as researchers
weight review quality and quantitative versus qualitative factors differently. The research
conducted by Pan and Zhang used a mixed effect logistic model with random intercepts
because logistics model is deemed appropriate for the binominal distribution of data
(“Was this review helpful to you? Yes or No?”), which is reflected by the way
helpfulness score is calculated (Pan & Zhang, 2011). The authors claim that the data was
collected from Amazon.com because the website has more reviews than any other
retailer, the volume of “reviews of reviews” (review quality information) is also larger
alternatives (Pan & Zhang, 2011). Pan and Zhang claim that the review characteristics,
product types, variability across categories should be accounted for. As a result, they
chose to extract reviews of six different “experiential” and “utilitarian” products, such as
CDs, Video Games, GPS, and food supplements. Also, for each category of product, only
the top 50 best sellers are chosen instead of random samples of goods because the
distribution of reviews is heavily skewed toward the best sellers, and random sampling all
published reviews can be “extremely difficult. (Pan & Zhang, 2011)” There are seven
variables used to compute summary statistics of the review data, and some of them are:
the number of available reviews of a product, the Age of a review (time elapsed in days),
and Customer rating (number of stars) (Pan & Zhang, 2011). The mathematical
representation of the model is as follow:
𝑌𝑖𝑗𝑘~𝐵𝑖𝑛𝑜𝑚𝑖𝑎𝑙(𝑛𝑖𝑗𝑘, 𝜋𝑖𝑗𝑘)
𝐼𝑛 [ 𝜋𝑖𝑗𝑘
1 − 𝜋𝑖𝑗𝑘] = (𝛼 + 𝜇𝑖) + 𝑋𝑖𝑗𝑘
′ × 𝛽
where is the number of reviewers who think review k of product j in product
category i to be helpful; refers to the number of reviewers who have rated this
review; refers to the probability that this review is deemed helpful by costumers; α
defines the intercept; is the transposed vector of independent variables; β is the
vector of parameters; and is a random component that varies by product category (Pan
between review length and review helpfulness, but such positive bias may alter
depending on the users if, for example, consumers have limited product options and are
forced to consider sub-optimal products, and the unfavorable product predispositions may
lead to a negative bias (Pan & Zhang, 2011). The limitations of this study come from the
small choices of review characteristics, little information about reviewer reputations, lack
of ways to measure to detect fake reviews or reviews done by programs.
To address the challenges of the size and quality of the product reviews, some
progresses are made toward building models that can evaluate the quality of reviews
automatically. One of the earlier works (Kim, Pantel, Chklovski, & Pennacchiotti, 2006 )
describes a system that can rank Amazon product reviews based on helpfulness using
SVM regression, and the paper also presents an in-depth analysis of the importance of the
structural, lexical, syntactic, semantic, and meta-data features to review helpfulness. The
work defines the review helpfulness function h as:
ℎ(𝑟 ∈ 𝑅) = 𝑟𝑎𝑡𝑖𝑛𝑔+(𝑟)
𝑟𝑎𝑡𝑖𝑛𝑔+(𝑟) + 𝑟𝑎𝑡𝑖𝑛𝑔−(𝑟)
The rating+(r) is the number of people who deem the review is helpful and
rating-(r) is the number of people who deem the review unhelpful. There are a few interesting
features they come up with, such as “HTML,” “Product-Feature,” and “General-Inquirer
(Kim, Pantel, Chklovski, & Pennacchiotti, 2006 ).” The “HTML” counts the number of
bold tags <b> and line breaks <br>. The paper does not explain in detail that why the
bold tags and the line breaks are chosen, but we speculate that these two tags can
too little of the two could make reviews difficult to read and understand, and the
perceived helpfulness might suffer as the result. As the name suggests, the
“Product-Feature” is about features of products that reviews contain, such as “weight” and
“memory size (Kim, Pantel, Chklovski, & Pennacchiotti, 2006 ).” The researchers
automatically extract product features from the “Pro and Con” that are listed on the
Epinions.com, which is a general consumer review site. The “Product-Feature” counts the
total number of lexical matches between the reviews and the “Pro and Con” list. The
“General-Inquirer” sums the positive and negative sentiment words from the reviews
based on the General Inquirer Dictionaries (Kim, Pantel, Chklovski, & Pennacchiotti,
2006 ). The SVM regression tool “𝑆𝑉𝑀𝑙𝑖𝑔ℎ𝑡” is applied to 10 sets of randomly sorted
training sets for 10-fold cross validation. The trained SVM model automatically return
the helpfulness score and rankings based on the list of features selected. The result shows
that the rank receives a correlation of 0.66 when combining review length, unigram, and
star ratings (Kim, Pantel, Chklovski, & Pennacchiotti, 2006 ). We think there are two
areas that this work can improve on. First of all, the researchers can choose to include
more product categories to test the effectiveness of the top influencers they come up with
in different domains of products. Second of all, since the authors mention their hope of
advancing user experiences with their automatic product reviews accessing and ranking
system, they can conduct some studies to investigate if user interactions and experiences
are truly improved after the implementation of the system.
Some of the more recent works build their automatic prediction models with
contextual features and user preferences as a result of the wide adoptions of social
time. A conference preceding in 2010 introduces a framework that joins social context
information with traditional text-based predictions (Lu, Tsaparas, Ntoulas, & Polanyi,
2010). This review system that has three sets of entities, set I of N items (products,
events, or services), set R of n reviews over these items, and a set U of m reviewers/users
who wrote the reviews. Each review r is mapped with a unique item 𝑖𝑟 = M(r), and each
review r is also matched to a unique reviewer 𝑈𝑟 = A(r). The relation, S ⊂ U × U, defines
the social network relationships between users (Lu, Tsaparas, Ntoulas, & Polanyi, 2010).
The group models the social network relation as a directed graph 𝐺𝑆 = (𝑈, 𝑆) with
adjacency matrix S, where 𝑆𝑢𝑣 = 1 if there is a link or edge from u to v and zero
otherwise. There are five social network features this work focus on, and they are (1)
“ReviewNum,” (2) “AvgRating,” (3) “In-Degree,” (4) “Out-Degree,” and (5) PageRank.
The (1) and (2) both belong to “Author” type of features. The ReviewNum shows the
number of reviews by the author, and the AvgRating shows past rating in average by the
author (Lu, Tsaparas, Ntoulas, & Polanyi, 2010). The (3) to (5) are considered as
“SocialNetwork” type of features. The In-Degree and Out-Degree describe in and out
degree of the author in the social network, and the PageRank shows the score of the
author. The “text-based” features consist of structural, syntactic, sentiment, and
conformity features. The more interesting one here is the conformity feature, the
“KLall,” and it compares a review r with other reviews by calculating the Kl-divergence
between the unigram model of the r and the unigram of the all reviews in the collection
(Lu, Tsaparas, Ntoulas, & Polanyi, 2010). It is defined as follow, where w are the tokens
of the unigram models.
With the above feature set f, a linear regression model is formulated as:
𝑄(𝑟) = 𝑤𝑇𝑟
Where 𝑤𝑇the transpose of the vector, and w is the weight vector, which maps
with a unique Q(r) and vice versa. The text-based forecasting model is then added with a
regularization parameter 𝛼, which is non-negative. The aim then becomes to find the
f-dimensional weight vector 𝑤̂, which can minimize the following objective function.
𝛺(𝑤) = 1
𝑛𝑙∑ 𝐿(𝑤
𝑇𝑟 𝑖, 𝑞𝑖) + 𝑛𝑙
𝑖=1
𝛼𝑤𝑇𝑤
L : loss function that calculates distance of the predicted quality 𝑄(𝑟𝑖) =
𝑤𝑇𝑟 𝑖
𝑞𝑖 : true quality value
𝑛𝑙 : the number of training examples
The experiment is based on a 50/50 split of a data set from a crowd-sourced
review website called “Ciao UK. (Lu, Tsaparas, Ntoulas, & Polanyi, 2010)” In order to
examine the effect of various sizes of training data, a sub-sampling of the training set is
performed. Then the effectiveness of the models are measured with Mean Squared Error
(MSE). The result shows that social context features are not effective if there is not
sufficient training data available. However, the regularization would perform well when
Project Concept & Hypnoses
Our project is an attempt toward identifying helpful reviews out of thousands of
user reviews via predictive modeling based on qualitative and quantitative factors of
reviews led by statistical analysis. The project should be able to reveal a combined
logistics model between factors and review quality. The motivations of conducting such
project mainly are three:
1. To help websites like Amazon.com with providing more relevant review search
layout and results.
2. To assist e-commerce websites and their users by filtering out low quality or
spam reviews.
3. To give recommendations for how to write helpful reviews.
As we proceed working on this project, there are a few hypnoses and assumptions
we come up with, and they are:
H1: the reviews that have more characters, words, or sentences are more helpful
because they contain more information regarding the products and user experiences.
H2: the audience perceive reviews with better readability and subjectivity more
helpful.
H3: the reviews that are written by the reviewers who have written more
reviews, been more active, or received more helpfulness endorsements are more
helpful.
H4: the reviews that are given more time to expose to the audience have a better
H5: The reviews of products with high star ratings (4 and above) are more helpful
H6: the reviews of best sellers are more helpful.
Definition of Helpfulness
The dependent variable, review helpfulness score, is define by the percentage of
people who found the review helpful:
𝐻𝑒𝑙𝑝𝑓𝑢𝑙𝑛𝑒𝑠𝑠 𝑆𝑐𝑜𝑟𝑒 = 𝐻𝑒𝑙𝑝𝑓𝑢𝑙 𝑉𝑜𝑡𝑒𝑠 ÷ 𝑇𝑜𝑡𝑎𝑙 𝑉𝑜𝑡𝑒𝑠
If 𝐻𝑒𝑙𝑝𝑓𝑢𝑙𝑛𝑒𝑠𝑠 𝑆𝑐𝑜𝑟𝑒 ≥ 0.6 → 𝑇ℎ𝑒 𝑟𝑒𝑣𝑖𝑒𝑤 𝑖𝑠 ℎ𝑒𝑙𝑝𝑓𝑢𝑙, helpfulness = 1
Else If 𝐻𝑒𝑙𝑝𝑓𝑢𝑙𝑛𝑒𝑠𝑠 𝑆𝑐𝑜𝑟𝑒 ≤ 0.4 → 𝑇ℎ𝑒 𝑟𝑒𝑣𝑖𝑒𝑤 𝑖𝑠 𝑁𝑜𝑛 − ℎ𝑒𝑙𝑝𝑓𝑢𝑙, helpfulness = 0
Else → remove the review from the collection
The helpfulness score should be a ratio that is between zero and one, and a larger
values means more helpfulness one review is. Also, since we aim at constructing a binary
classier, the ambiguous reviews that has a helpfulness score between 0.4 and 0.6 are
III. Method
Data set
The data set we focus on is a subset of a published data set called “Amazon
Product Data” (Julian, Rahul, & Jure, 2015). This superset, the “Amazon Product Data”
contains 143 million pieces of reviews as well as a huge data set of product meta-data
information crawled from Amazon.com. The superset is named as “raw review
data (20gb) (Julian, Rahul, & Jure, 2015),” and it contains most if not all of the reviews
spanning from 1996 to 2014, but many of those reviews are duplicated because Amazon
merges the reviews of identical products throughout the time, such as the hard copies and
electronic versions of the same book or movie. The first obvious problem about the
superset is the duplication of reviews, and the second problem is the data is rather messy
and not properly cataloged by product categories or reviewers.
Fortunately, the recent updates from that research group brought us a few more
usable subsets (Julian, Rahul, & Jure, 2015):
"User review data” has 83.68 million pieces of reviews and is sorted by reviewer ID
with duplicate reviews removed.
"Product review data” has also 83.68 million pieces of reviews but is sorted by
“Ratings only” has 3.2 Gigabyte of non-duplicate reviews in the “.csv” form without
reviews text or product metadata. We think this subset can be helpful in terms of
building an aggregated data set about the 18-year-history of Amazon reviewers.
“5-core” is a 9.9 GB collection with 41.13 million reviews, and all users and items it
contains have at least 5 reviews.
“Aggressively deduplicated data” has 18 GB non-duplicate of data (82.83 million
reviews) and is format as one-review-per-line a “.json” file. The data set has users
with multiple accounts and fake reviews removed, and that is why it is “aggressive”.
When we take a deeper look at each of those data set later on, we deem that the
“5-core” data set is particularly suitable for our project. We also extract part of meta-data
information from the “metadata,” which contains 3.1GB of metadata for 9.4 million
products. To be more specific, we filter out the reviews data first, and it contains a list of
product Id, then we match the list with sales rank and categories information of metadata
data set.
The product review data contains ratings, text, and helpfulness votes (by Amazon
users). The meta-data contains descriptions, categories, price, brand, image features,
co-view link, and co-purchasing link. The following are two snapshots of the “5-core” and
Figure 2 A snapshot of one piece of product review
reviewerID – reviewer’s Id, asin – product’s Id,
reviewerName – reviewer’s user name, helpful – [helpful endorsement, total vote], reviewText - text of the review
overall – product’s rating (the “star rating” from 1~5) summary - summary of the review
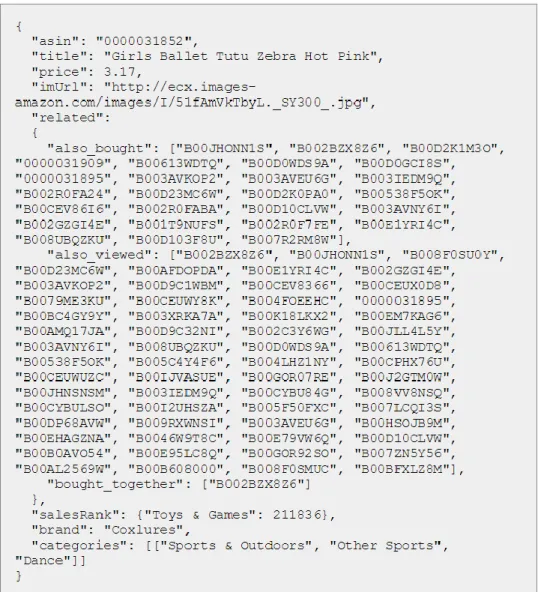
Figure 3 A snapshot of one piece of product meta-data information
asin – product Id title – product Name
price – product price in us dollar imUrl - product image’s url
related - also bought, also viewed, bought together, buy after viewing salesRank - sales rank information
brand – brand name
The Statistical Aspects of the Review Data
As we conduct an initial statistical analysis of the data sets that we have, we
quickly discover some important facts: (1) most of reviews do not contain any
helpfulness vote at all; (2) most of products have none product review let alone any
helpfulness vote; (3) most of reviews were written between 2008 and 2012.
For instance, below are several snapshots of the product category, “Grocery and
Gourmet Food.”
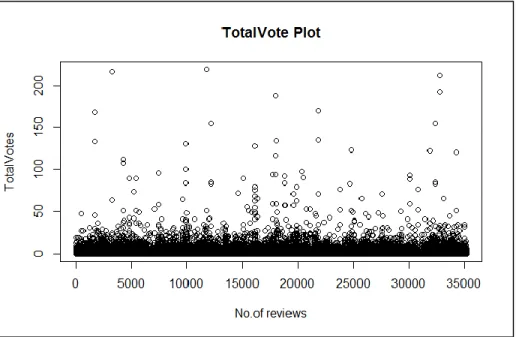
Figure 4 Frequency Analysis about total vote
Figure 5 Statistical Summary of the total vote
The “TotalVote Plot” above shows that most of the product reviews cluster
50 votes. This means we ought to filter out the products that have no reviews and reviews
that have a limited number of helpfulness votes.
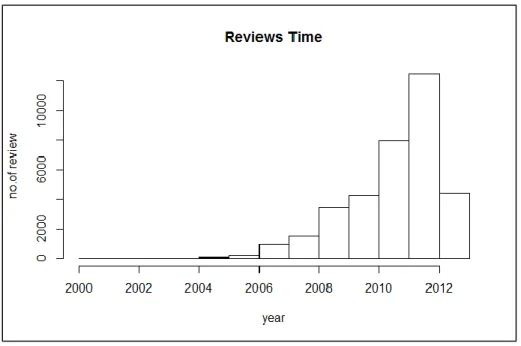
Figure 6 Frequency Analysis about the year the review is written
Figure 7 Statistical Summary of the year the review is written
The “Reviews Time” plot above shows that most of the reviews were created
between 2010 and 2012. Another fact that we notice is that the earliest food review goes
back to 2000 instead of 1996, and we think this is okay as soon as we restrain our
experiment based on one single category of products instead of a couple of them. As we
hypothesize, the reviews that have longer time or more exposure to the audience might
gather more helpfulness vote. Thus, we ought to consider limit the time span of the
Pre-processing
Given the time constrain of time and resource, the scope of this master paper must
be reasonable and practical. We decide to limit the product category to one specific type,
the “Grocery and Gourmet Food,” which we refer as “the Food” throughout the following
part of the report. The Food has 35,173 pieces of reviews of 74,258 distinct products that
have a size of 300 MB.
Since the Food exhibits the similar skew distribution as “5 core”, we end up only
keeping the products that have at least 5 product reviews and the reviews that have at
least 10 helpfulness votes.
To alleviate the “unfair” advantages some of the “older” reviews may have
because of more exposure or longer existence on the Amazon.com, we also decide to
filter out food reviews that are written before 2010 or after 2011.
Moreover, there are a small portion of reviews that have only a few words, such
as “great taste” or “horrible taste,” but they somehow receive more than 10 helpfulness
vote. We are uncertain if those are indeed fake votes, or there are some users prefer
concise comments over paragraphs of stories. Therefore, we did not filter out reviews that
have limited number of words as soon as they meet the two thresholds.
After performing the procedure above, there are 5,578 pieces of reviews left that
have 10 or more helpfulness vote and are written between 2010 and 2011.
Character count
Word count
Sentence count
Number of question and exclamation marks
Typo count
Readability
The above list of structural features can capture the textual and token-based
characteristics of the food reviews. As we hypothesize, longer reviews may contain more
information about the products, which the reviewers might find useful. Obviously, a long
review tends to have more characters, words, and sentences. Thus, we invite these three
on the top of the list to the party.
We sense that the “Number of question and exclamation marks” might be able to
represent how extreme the reviewers’ sentiments are when they write the product
reviews. We expect the reviews with more extreme emotions to be deemed non-helpful
because of lack of subjectivity.
The “Typo count” gives a rough estimate of how careful the review is written,
which may reduce the perceived helpfulness of the review to some audience. We reckon
that some people tend to evaluate the helpfulness of a review based on writing
proficiency, so the audience may judge the review quality negatively if the review is
written with a lot of typos or many grammatical errors.
The “Readability” is measure by calculating the Automated Readability Index
ARI = 4.71 × (Characters ÷ words) + 0.5 × (𝑤𝑜𝑟𝑑𝑠 ÷ 𝑠𝑒𝑛𝑡𝑒𝑛𝑐𝑒𝑠) − 21.43
Characters: the number of letters and numbers,
Words: the number of spaces,
Sentences: the number of sentences
According to the ARI guidance (E. A. SMITH; R. J. SENTER, 1967), the
reviews’ ARI score is between 1 and 14 with decimal number rounding up to the closet
integer. For instance, a score of 9.1 and 9.8 should both be rounded to 10.
Reviewer Features
Reviewer’s total reviews count
Reviewer’s total helpful scores received
Reviewer’s average ratings of products
Reviewer’s account history
All four features above measure the expertise of product reviewers, and together,
they all favor “seasoned” reviewers than newbies or non-active reviews. We have to
calculate these four Reviewer features from the data set, “Ratings only,” for we do not
have any complete Amazon user data set available on hand. Also, we try to avoid getting
user data only from the Food because a great amount of reviewers has a diverse history of
writing reviews, and they do not necessarily “specialize” in a single category of product,
Food, but they have more than 10 reviews in the “Product review data.” More
importantly, a good portion of users only have less than 10 reviews at total.
The “Reviewer’s total reviews count” is the summation of the number of all
product reviews he or she ever written. We deem that the more one writes, the better one
will get in terms of delivering high quality reviews. The similar reasoning goes to the
“Reviewer’s total helpful scores received,” which is calculated by adding all helpfulness
endorsements the reviewer has ever got.
We are interested in figuring out firstly, are there “sweet reviewers” who are more
tolerant about flaws of products reviews and willing to give more “yes” to other people’s
reviews. Secondly, how do we divide “sweet” and “bitter” reviewers? We reckon it
might be helpful to look at the average star scores a user gives with a higher than 3 stars
indicating the “sweetness” and an equal or lower than 3 starts indicating the “bitterness”,
and that is the motivation behind the “Reviewer’s average ratings of products.”
The “Reviewer’s account history” shows how active a reviewer is by looking at
how many reviews per day throughout the entire user history that he or she has on
Amazon.com. It is calculated by:
𝑨𝒋 = 𝑹𝒋 𝟎÷ (𝑻𝒋 𝟎− 𝑻𝒋 𝟏)
𝑨𝒋 : the account history score of the reviewer j
𝑹𝒋 𝟎: the reviewer j’s total reviews count, is an integer value
𝑻𝒋 𝟏: the time when the reviewer j’s first product review is finished
For instance, the reviewer John Blue has a total of 100 product reviews, wrote his
first Amazon reviews 100 days ago, and his latest review was written 5 days ago. Then
his Reviewer’s account history = 100 ÷ (100 - 5) ≈ 1.05. In the actual calculation, we
convert the UNIX time stamp conversion to elapsed days.
Meta-data Features
Product star score
Review lasting time
Sales Rank
The “Product score rating” is an integer value from 0 to 5 indicating how many
“starts” in average product reviewers give to a product. We are curious to see if there is
any relationship between score ratings and review helpfulness. For instance, a product
with higher star scores indicates its success among users, and there might be a positive
perception about the product even before the potential buyers reading reviews of the
product. Such positive perception might affect the audience to endorse those positive
reviews about the successful products and undermine the negative product reviews’
helpfulness.
We expect that it is important for a review to “last longer” to receive more
helpfulness votes. The “Review lasting time” feature is measure in the Unix time stamp
𝑳𝒋 = (𝑻𝒋 𝟎 − 𝑻𝒋 𝟏 ) / 𝑻𝒋 𝟎
𝑳𝒋 ∶ the review j’s lasting time
𝑻𝒋 𝟏∶ the time when the review j is written
𝑻𝒋 𝟎∶ the time of 23:59:59 on December 31 2011, which is the time threshold we set
for the data collection
For instance, review j is written at 1288915200, so its lasting time is
(1325375940-1288915200)/ 1325375940 ≈ 0.028.
The “Sales Rank” shows product’s rank in terms of sales against other product in
the same category, which is “Grocery and Gourmet Food” is our case. The value’s the
Sales Rank is 1.0 if it is the top 100 best sellers, and 0 if not.
Logistic Regression Model
Our model is a Logistic Regression model because we treat the Helpfulness score
as a non-negative binary value, which is if helpful and non-helpful. Our result model
looks like below:
𝑷̂ = (𝒆𝒋 𝜷𝟎+𝜷𝟏𝒙𝟏+𝜷𝟐𝒙𝟐+𝜷𝟑𝒙𝟑+𝜺_𝒋) ÷ (𝟏 + 𝒆𝜷𝟎+𝜷𝟏𝒙𝟏+𝜷𝟐𝒙𝟐+𝜷𝟑𝒙𝟑+𝜺_𝒋)
𝑷̂𝒋: Estimated probability of review j is helpful. If ≥0.6, then helpful; Else, then
𝜷_𝟎 is the constant coefficient
𝜷𝟏~𝟑 are the fixed regression coefficients
𝑿𝟏~𝟑are the review features, review features, and meta-data info
IV. Evaluation
Before conducting experiments with our two models, we try to balance the 5,578
pieces of food reviews by diving the two classes equally, so that there are equal number
of helpful and non-helpful reviews. We conduct a 90/10 split with 90% of training data
and 10% of test data. Due to our selection of product category, thresholds of total votes
and time stamp, we end up only have a bit over 700 non-helpful reviews and a bit over
4800 helpful reviews. We conduct the experiment with 630 helpful reviews, 630
non-helpful reviews, and test the result with 180 reviews that equal number of non-helpful and
non-helpful reviews. With the same training and test data set, we conduct another run of
experiment with a Naïve Bayes Classifier, which is treated as the baseline model. Our
Logistic Regression Model achieves the accuracy of 0.79, precision of 0.6, and recall of
0.98. The baseline model receives accuracy of 0.56, precision of 0.43, and recall of 0.74.
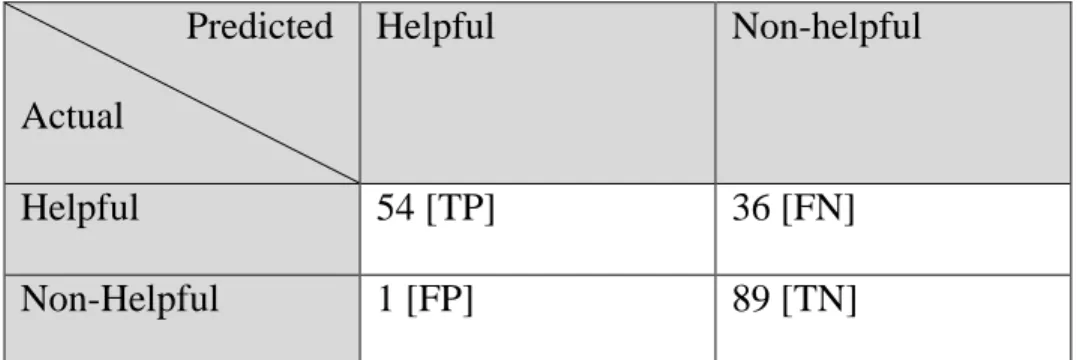
The Table 1 below shows the confusion matrix of the result of our regression model.
Predicted
Actual
Helpful Non-helpful
Helpful 54 [TP] 36 [FN]
Non-Helpful 1 [FP] 89 [TN]
The Recall R and the Precision P of are as follow:
𝑹 = 𝒕𝒑 ÷ (𝒕𝒑 + 𝒇𝒏) = 54 / (54+36) = 0.60
R: recall
tp: true positive
fn: false negative
𝑷 = 𝒕𝒑 ÷ (𝒕𝒑 + 𝒇𝒑) = 54 / (54+1) = 0.98
P: precision
tp: true positive
fp: false positive
Compared to the baseline model, our Logistics Regression Model has decent
accuracy and recall, but there is still some potential for its precision value to grow.
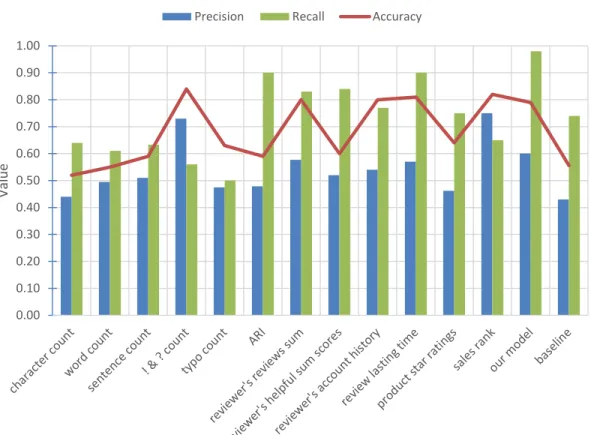
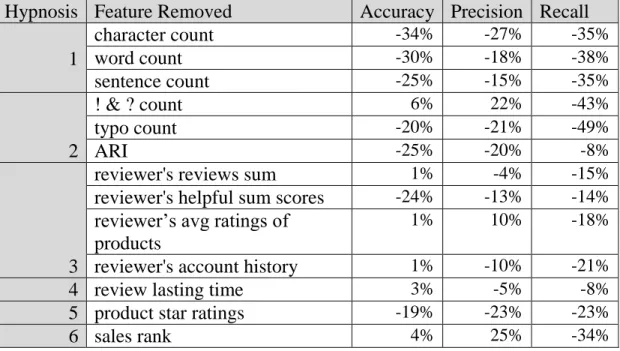
Then we conduct a set of experiments to test the “predictive power” of the features
we selected. The bar chart Figure 8 and Table 2 below compare the values of
precision, accuracy, and recall when we exclude a specific feature from our model.
As we can see, removing each feature has different effects on the model performance.
For instance, by removing sales rank, the accuracy and precision would both go up,
Figure 8 Features Evaluation Result
Hypnosis Feature Removed Accuracy Precision Recall
1
character count 0.52 0.44 0.64
word count 0.55 0.50 0.61
sentence count 0.59 0.51 0.63
2
! & ? count 0.84 0.73 0.56
typo count 0.63 0.48 0.50
ARI 0.59 0.48 0.90
3
reviewer's reviews sum 0.80 0.58 0.83
reviewer's helpful sum scores 0.60 0.52 0.84
reviewer’s avg ratings of products
0.80 0.66 0.80
reviewer's account history 0.80 0.54 0.77
4 review lasting time 0.81 0.57 0.90
5 product star ratings 0.64 0.46 0.75
6 sales rank 0.82 0.75 0.65
0.00 0.10 0.20 0.30 0.40 0.50 0.60 0.70 0.80 0.90 1.00 Valu e
Features Evaluation Result
Table 2 Features Evaluation Table
Hypnosis Feature Removed Accuracy Precision Recall
1
character count -34% -27% -35%
word count -30% -18% -38%
sentence count -25% -15% -35%
2
! & ? count 6% 22% -43%
typo count -20% -21% -49%
ARI -25% -20% -8%
3
reviewer's reviews sum 1% -4% -15%
reviewer's helpful sum scores -24% -13% -14%
reviewer’s avg ratings of products
1% 10% -18%
reviewer's account history 1% -10% -21%
4 review lasting time 3% -5% -8%
5 product star ratings -19% -23% -23%
6 sales rank 4% 25% -34%
Table 3 Features Predictive Power Changes
The Table 3 shows the percentage change in terms of the three attributes
compared to our original Logistics Regression Model. For instance, the performance of
the model without sales rank feature has an increment of 4% in accuracy, an increment of
25% of precision, and a decrement of 34% of recall comparing to our original model that
applies all features. If we primarily focus on reaching a higher accuracy, the accuracy
drops when we exclude these features from the model: character count, word count, and
sentence count, typo count and ARI, reviewers’ total helpful scores received, and product
star score. On the other hand, removing the following features can boost the accuracy of
our model: exclamation & question mark count, reviewer's reviews sum, reviewer’s
average ratings of products, reviewer’s account history, sales rank, and review lasting
Last but not least, the evaluation result only supports a part of our 6 assumptions.
To begin with, the predictive power of character count, word count, and sentence count
supports the H1, which links review length with helpfulness. Without these three
features, the accuracy, precision, and recall would all decrease for our model. Looking at
the readability and subjectivity, the H2 is partially supported by the effectiveness of the
readability features, the typo counts and ARI, but undermined by the exclamation and
question mark count. The typo counts and ARI show ability of increase the all three
attributes, but having removing exclamation and question mark count could actually
increase accuracy and precision. We still believe extreme emotions can damage the
subjectivity, which is one of the keys that influence perceived helpfulness. We deem that
there must be a better way of extracting how strong emotions are compared to counting
exclamation and question marks. With a focus on review writers’ influence on the
prediction, the H3 does not receive any strong support from the reviewer's reviews count
or the reviewer's account history, but it is justified by the reviewer's helpful sum scores.
The absence of the reviewer's reviews count and the reviewer's account history would
increase the accuracy by only 0.01, but both of the precision and recall would drop as the
result. Without reviewer's total helpful scores received, our model would loss nearly 20%
of accuracy, 8% of precision, and 14% of recall. Our reasoning behind this result is that
the reviewer data is aggregated and calculated from only a subset of the complete data, so
there might be missing data. The H4, which bets on older reviews, is partly supported
because our model would loss 3% of precision and 8% of recall by removing review
lasting time from the equation. Backing up the successful hot sellers on Amazon.com, the
15% of accuracy, 14% of precision, and 23% of recall. It seems that people love more
about the winners as well as the reviews describing them. Our last assumption, H6 is
contradicted by the sales rank features, which seems costs our model 3% of accuracy and
15% of precision.
VI. Conclusion
There are mainly three findings of our research about the helpfulness of Amazon
product reviews, and one of the three findings contradicts our assumptions. Below,
we will discuss each of the founding in detail.
To begin with, the more characters, words, and sentences one review has, the
more helpfulness it is. Thus, Amazon may consider recommend reviews that have at
least certain number of words to users. It may also consider filter out reviews that
have very limited number of words. Also, Amazon users should consider write longer
reviews with more information to increase the helpfulness.
Secondly, the product reviews with better readability are deemed more helpful
because typo count and ARI both have noticeable influence on the result. Yet less
exclamation and question marks increase perceived helpfulness. Therefore, the
website should rank higher the product reviews that have less typos and better ARI
scores, and it should not punish reviews with tons of question and exclamation marks.
The reviewers should craft fluent sentences and try not to misspell words, and it is
okay to write a number of question and exclamation marks.
Thirdly, the merit of reviewers do not show noticeable effect on the perceived
helpfulness of product reviews. However, we still would not suggest
the Amazon.com stop favoring more seasoned, active and trustworthy reviewers
because we would need more complete data to support such claim. Similarly, we
Additionally, we do recognize that the shortcomings of our analysis may emerge
during a more realistic setting. For instance, we cannot simply assume that longer
reviews are always better in real life because people might be deterred from reading
and voting for them if these reviews are pages long. Moreover, in real life, if a piece
of review has too many exclamation or question marks, the readability would suffer,
so we should not make simple assumption that subjectivity is not in effect when
determine review helpfulness. Also, in real life settings, “pro” reviewers and expert
reviewers have a lot of power that other users would value their opinions and reviews
VI. Future Work
The first extensions of this work is to include multiple of categories of products,
such as movies, electronics, and clothing, to further test our feature selections. We
believe that by limiting the product category to only “Groceries and Gourmet Food,” our
model gains some advantages already because there could be more noises caused by the
difference between various domains. Our model indeed lacks of the exposure to the real
challenge from the real world where it has to classify millions of reviews of hundreds of
categories of products in real time.
Moreover, due to our choices of thresholds, such as review time stamp and total
votes, the data set turns out to be rather limited after preprocessing. In the future, we can
“loosen up” some of the thresholds to include more samples. For instance, we can include
all reviews that (1) comes from a few different categories, (2) last for 1 year, and (3) have
total votes over 5. Additionally, we can try to re-define the threshold of class labelling.
For example, we can try move down the current helpfulness score threshold of 0.6 to
0.55. By having larger data set, we can experiment with more complex models and
training set splits.
Last but not least, our future work can benefit from including better subjectivity
detection and sentiment analysis instead of counting question and exclamation marks.
Also, we can consider analyze review comments, which contains the interactions between
reviewers, which is another way of looking at the reason behind pressing the “Yes” or
term frequency–inverse document frequency, or the TFIDF (Rajaraman, A.;
Acknowledgment
The completion of this report could not have been possible without the guidance of Professor Jaime Arguello and Mr. Heejun Kim.
Bibliography
(n.d.). Retrieved 10 21, 2016, from Cambridge Dictionary: http://dictionary.cambridge.org/
(n.d.). Retrieved 10 21, 2016, from Amazon.com: https://www.amazon.com/Best-Sellers-Pet-Supplies/zgbs/pet-supplies/ref=zg_bs_nav_0
Bennett, J., & Lanning, S. (2007). The Netflix Prize. Proceedings of KDD Cup and Workshop 2007.
Festa, P. (2002, 1 2). Amazon floats new service from Alexa buy. Retrieved 10 21, 2016, from CNET: https://www.cnet.com/news/amazon-floats-new-service-from-alexa-buy/
Huanga, A. H., Chenb, K., Yenc, D. C., & Tran, T. P. (2015). A study of factors that contribute to online review helpfulness. Computers in Human Behavior, 17-27.
Julian, M., Rahul, P., & Jure, L. (2015). Inferring Networks of Substitutable and Complementary Products. KDD '15 Proceedings of the 21th ACM SIGKDD International Conference on Knowledge Discovery and Data Mining (pp. 785-794 ). New York: ACM.
Korfiatisa, N., García-Bariocanalb, E., & Sánchez-Alonso, S. (2012). Evaluating content quality and helpfulness of online product reviews: The interplay of review helpfulness vs. review conten. Electronic Commerce Research and Applications, 205–217.
Kumar, N., & Benbasat, I. (2006). The Influence of Recommendations on Consumer Reviews on Evaluations of Websites. Information Systems Research , 425-439.
Liu, Y., Huang, X., An, A., & Yu, X. (2008). Modeling and Predicting the Helpfulness of Online Reviews. IEEE.
Liu, Y., Huang, X., An, A., & Yu, X. (2008). Modeling and Predicting the Helpfulness of Online Reviews. 2008 Eighth IEEE International Conference on Data Mining
(pp. 443 - 452 ). IEEE.
of the 20th ACM international conference on Information and knowledge management
(pp. 2249-2252). New York: ACM.
Mudambi, S. M., & Schuff, D. (2010). What Makes a Helpful Online Review? A Study of Customer Reviews on Amazon.com. MIS Quarterly, 185-200.
O'Reilly, T. (2005, 9 30). What Is Web 2.0: Design Patterns and Business Models for the Next Generation of Software. Retrieved 10 21, 2016, from oreilly.com:
http://www.oreilly.com/pub/a/web2/archive/what-is-web-20.html?page= 1
Pan, Y., & Zhang, J. Q. (2011). Born Unequal: A Study of the Helpfulness of User-Generated Product Reviews. Journal of Retailing, 598–612.
Pang, B., Lee, L., & Vaithyanathan, S. (2002). Thumbs up? Sentiment Classification using Machine Learning. ACL-02 conference onempirical methods in natural language processing (pp. 79-86). Philadelphia: ACL.
Park, D.-H., Lee, J., & Han, I. (2007). The Effect of On-Line Consumer Reviews on Consumer Purchasing Intention: The Moderating Role of Involvement.
International Journal of Electronic Commerce, 125-148.
Perrine, R. M., & Osbourne, H. L. (2015). Personality Characteristics of Dog and Cat Persons. A multidisciplinary journal of the interactions of people and animals , 33-40.
Qing, C., Wenjing, D., & Qiwei, G. (2011). Exploring determinants of voting for the “helpfulness” of online user reviews: A text mining approach. Decision Support Systems, 511–521.
Caoa, Q., Duanb, W., & Gana, Q. (2011). Exploring determinants of voting for the “helpfulness” of online user reviews: A text mining approach. Decision Support Systems, 511–521.
E. A. SMITH; R. J. SENTER. (1967). AUTOMATED READABILITY INDEX. Wright-Patterson Air Force Base, 8-10.
Georg Lackermair, Daniel Kailer, Kenan Kanmaz. (2013). Importance of Online Product Reviews. Advances in Economics and Business, 1-5.
Hong, Y., Lu, J., Yao, J., Zhu, Q., & Zhou, G. (2012). What reviews are satisfactory: novel features for automatic helpfulness voting. ACM SIGIR conference on Research and development in information retrieval (pp. 495-504). New York, NY, USA: ACM.
Kim, S.-M., Pantel, P., Chklovski, T., & Pennacchiotti, M. (2006 ). Automatically assessing review helpfulness. Conference on Empirical Methods in Natural Language Processing (pp. 423-430). Sydney, Australia: Association for Computational Linguistics.
Lu, Y., Tsaparas, P., Ntoulas, A., & Polanyi, L. (2010). Exploiting social context for review quality prediction. World wide web (pp. 691-700). New York, NY, USA: ACM.