R E S E A R C H A R T I C L E
Open Access
GWAS and transcriptional analysis prioritize
ITPR1
and
CNTN4
for a serum uric acid
3p26 QTL in Mexican Americans
Geetha Chittoor
1,2, Jack W. Kent Jr
3, Marcio Almeida
4, Sobha Puppala
3, Vidya S. Farook
4, Shelley A. Cole
3,
Karin Haack
3, Harald H. H. Göring
4, Jean W. MacCluer
3, Joanne E. Curran
4, Melanie A. Carless
3,
Matthew P. Johnson
4, Eric K. Moses
5, Laura Almasy
4, Michael C. Mahaney
4, Donna M. Lehman
6,
Ravindranath Duggirala
4, Anthony G. Comuzzie
3, John Blangero
4and Venkata Saroja Voruganti
1,2*Abstract
Background:
The variation in serum uric acid concentrations is under significant genetic influence. Elevated SUA
concentrations have been linked to increased risk for gout, kidney stones, chronic kidney disease, and cardiovascular
disease whereas reduced serum uric acid concentrations have been linked to multiple sclerosis, Parkinson
’
s disease
and Alzheimer
’
s disease. Previously, we identified a novel locus on chromosome 3p26 affecting serum uric
acid concentrations in Mexican Americans from San Antonio Family Heart Study. As a follow up, we examined
genome-wide single nucleotide polymorphism data in an extended cohort of 1281 Mexican Americans from
multigenerational families of the San Antonio Family Heart Study and the San Antonio Family Diabetes/
Gallbladder Study. We used a linear regression-based joint linkage/association test under an additive model of
allelic effect, while accounting for non-independence among family members via a kinship variance component.
Results:
Univariate genetic analysis indicated serum uric acid concentrations to be significant heritable (
h
2= 0.50 ± 0.05,
p
< 4 × 10
−35), and linkage analysis of serum uric acid concentrations confirmed our previous finding of a novel locus on
3p26 (LOD = 4.9,
p
< 1 × 10
−5) in the extended sample. Additionally, we observed strong association of serum uric acid
concentrations with variants in following candidate genes in the 3p26 region; inositol 1,4,5-trisphosphate receptor, type 1
(
ITPR1
), contactin 4 (
CNTN4
), decapping mRNA 1A (
DCP1A
); transglutaminase 4 (
TGM4
) and rho guanine nucleotide
exchange factor (GEF) 26 (
ARHGEF26
) [
p
< 3 × 10
−7; minor allele frequencies ranged between 0.003 and 0.42] and
evidence of
cis
-regulation for ITPR1 transcripts.
Conclusion:
Our results confirm the importance of the chromosome 3p26 locus and genetic variants in this region in the
regulation of serum uric acid concentrations.
Keywords:
Joint linkage/association approach,
CNTN4
,
ITPR1
, Family-based study
Background
The end product of purine metabolism in humans and
higher order primates is uric acid, which cannot be further
broken down because of lack of uricase [1]. Elevated
serum uric acid (SUA) levels or hyperuricemia, a metabolic
risk factor for gout and cardio-renal diseases, has been
increasing in prevalence worldwide [2–8]. As other
cardio-vascular and renal disease risk factors, hyperuricemia also
has a strong genetic basis [9–11]. SUA is a complex trait,
and its pattern of inheritance suggests that several genes
may influence it. Numerous genome-wide and candidate
gene studies have found various genes, mostly uric acid
transporters, to be significantly associated with SUA in
several populations, such as solute carrier protein 2 family,
member 9 (
SLC2A9
) [12–17], solute carrier protein 22
family, member 11 (
SLC22A11
), solute carrier protein 17
family members 1 and 3 (
SLC17A1, SLC17A3
), solute
* Correspondence:[email protected]1
Department of Nutrition, University of North Carolina at Chapel Hill, Chapel Hill, NC, USA
2UNC Nutrition Research Institute, University of North Carolina at Chapel Hill,
500 Laureate Way, Kannapolis, NC 28081, USA
Full list of author information is available at the end of the article
carrier protein 16 family member 9 (
SLC16A9
) and
ATP-binding cassette, subfamily G. member 2 (
ABCG2
)
[18–21].
In a previous linkage study in 632 Mexican Americans
of the San Antonio Family Heart Study, we found strong
evidence of linkage for SUA concentrations on 3p26
(LOD = 4.2) [9] and suggestive evidence of association
with the positional candidate gene contactin 4 (
CNTN4
)
[22]. Other candidate genes in this region are inositol
1,4,5-trisphosphate receptor, type 1 (
ITPR1
), decapping
mRNA 1A (
DCP1A
); transglutaminase 4 (TGM4) and
rho guanine nucleotide exchange factor (GEF) 26 (
ARH-GEF26
). The one LOD-confidence interval on 3p26 falls
within the candidate region for 3p deletion syndrome
whose features include developmental delays and mental
retardation [21]. In particular, disruption of
CNTN4
and
ITPR1
seem to contribute to the 3p deletion syndrome
phenotype and may have a causal relationship [22, 23].
SUA is also known as a biomarker for neurodegenerative
diseases such as dementia, stroke, Parkinson’s disease
and multiple sclerosis [24–28].
Given that we previously identified 3p26 quantitative trait
locus (QTL) regulating SUA concentrations, a detailed
un-derstanding of the genetic architecture of all candidate
genes/variants within this 3p region and its association with
SUA is crucial. The aim of this study was to assess the
asso-ciation of variants in the chromosome 3p region in an
expanded cohort of 1281 Mexican Americans from the San
Antonio Family Heart Study (SAFHS) and the San Antonio
Family Diabetes/Gallbladder study (SAFDGS).
Results
The mean ± SD of age and SUA levels of participating
individuals (
n
= 1281) were 46.64 ± 15.8 years and 5.80 ±
1.6 mg/dl, respectively, with men having higher levels of
SUA than women (6.68 ± 1.6 vs. 5.28 ± 1.4) (Table 1).
Significant heritability was detected for SUA levels
(
h
2= 0.50 ± 0.05,
p
= 3.2 × 10
−35) with age, sex, and
inter-action between age and sex as covariates.
Genome-wide joint linkage/Association analysis
Prior to genetic analysis, SUA was rank-inverse-normal
transformed and regressed on age, sex, and interaction
between age and sex. Joint linkage analysis (JLA) results
confirmed our previous findings [9] with the strongest
evidence for linkage of SUA on 3p26 (LOD = 4.9,
p
=
1 × 10
−6) (Fig. 1). We observed strong association between
SUA concentrations and SNPs in candidate genes in the
one-LOD confidence interval of 3p26; inositol
1,4,5-tris-phosphate receptor, type 1 (
ITPR1
), rs11916691 (A):
decap-ping mRNA 1A (
DCP1A
), rs1395388 (G): transglutaminase
4 (
TGM4
)
,
and contactin 4 (
CNTN4
) (Table 2). The minor
alleles of eight of these SNPs are associated with lower
levels of SUA concentrations. The minor allele frequencies
(MAFs) (range 0.3 to 43 %), and results of association
ana-lysis of these SNPs with SUA are given in Table 2.
Genotypic-specific mean values of SUA for significant and
suggestive associated SNPs are given in Table 3. In addition,
the genome-wide linkage screen localized suggestive
evi-dence of linkage of SUA with QTLs on chromosomes 8, 9,
16, and 20, respectively (LOD
≥
2.0) (Fig. 2).
Genetic analysis of expression levels of genes in the
chromosome 3p region
As a next step, we performed genetic analysis to
esti-mate heritabilities of gene expression of candidate genes
in chromosome 3p26 region. Significant heritabilities
were observed for
ITPR1
(
h
2= 0.21 ± 0.5,
p
= 3 × 10
−7).
Previously, transcriptomic analysis in SAFHS [29]
identi-fied several
cis
-regulated transcripts including
ITPR1
.
Genome-wide association analysis provided evidence of
association between
ITPR1
expression and
ITPR1
SNPs,
and sodium channel, voltage gated, type VIII alpha subunit
(
SCN8A
) genes (p between 10
−5and 10
−7). In addition,
ITPR1
showed suggestive associations with SNPs in
inter-genic regions in chromosomes 1, 2, 10 and 12 (Table 4).
Discussion
Our results demonstrate the importance of chromosome
3p26 genetic variants in the regulation of SUA
concentra-tions in Mexican Americans. We identified a QTL with
sig-nificant evidence of linkage on chromosome 3 (LOD = 4.9)
for SUA in an expanded cohort, confirming our previous
linkage of a novel QTL on chromosome 3p26 affecting
SUA and better reflecting pedigree-specific effects. This
re-gion has been reported to harbor positional candidate genes
with potential relevance to cardiovascular disease,
hyper-tension, obesity, and metabolic syndrome [2–5].
CNTN4
, a
candidate gene in the linkage region of 3p26, is a member
of the contactin subgroup of cell adhesion molecules of the
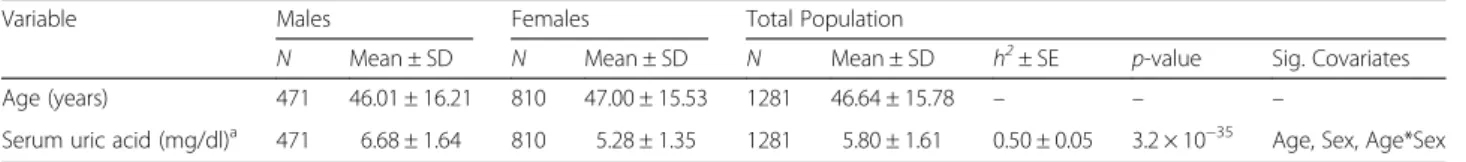
Table 1
Descriptive characteristics and heritability estimates of serum uric acid (mg/dl)
Variable Males Females Total Population
N Mean ± SD N Mean ± SD N Mean ± SD h2± SE p-value Sig. Covariates
Age (years) 471 46.01 ± 16.21 810 47.00 ± 15.53 1281 46.64 ± 15.78 – – –
Serum uric acid (mg/dl)a 471 6.68 ± 1.64 810 5.28 ± 1.35 1281 5.80 ± 1.61 0.50 ± 0.05 3.2 × 10⁻³⁵ Age, Sex, Age*Sex a
Rank-inverse-normal transformed data used for genetic analyses
immunoglobulin (Ig) superfamily and plays an important
role in maintenance and plasticity of functional neuronal
networks and central nervous system (CNS)
develop-ment [23]. The variants in this gene are associated
with developmental delays and mental retardation and
may be relevant to autism-related spectrum disorders
[30–32]. Disruption of
CNTN4
is also thought to
cause cognitive defects [33]. Our study showed strong
association of SUA concentrations with
CNTN4
SNPs.
Specifically, one
CNTN4
variant, rs9854606 is notable
with a minor allele frequency (T) of 0.4 %. Although,
SUA has not been associated with autism or related
disor-ders, it has been considered a biomarker for neurological
disorders such as Parkinson’s disease [34], multiple
scler-osis [35] and Alzheimer’s disease [36, 37] and cognitive
defects [38, 39].
Fig. 1Joint linkage association analysis of serum uric acid on chromosome 3p26 showing a strong signal (LOD = 4.9) in Mexican Americans
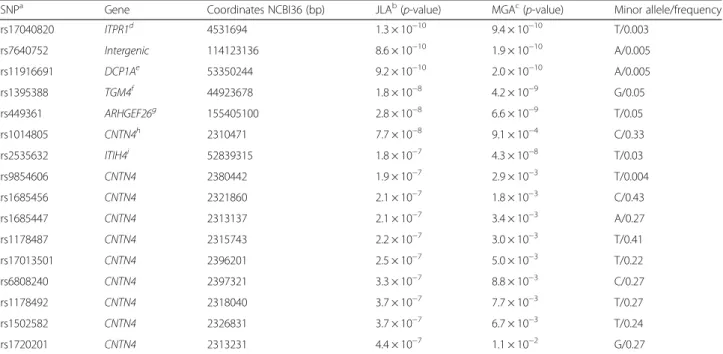
Table 2
Joint linkage-association analysis of serum uric acid (mg/dl) on chromosome 3
SNPa Gene Coordinates NCBI36 (bp) JLAb(p-value) MGAc(p-value) Minor allele/frequency
rs17040820 ITPR1d 4531694 1.3 × 10⁻¹⁰ 9.4 × 10⁻¹⁰ T/0.003
rs7640752 Intergenic 114123136 8.6 × 10⁻¹⁰ 1.9 × 10⁻¹⁰ A/0.005
rs11916691 DCP1Ae 53350244 9.2 × 10⁻¹⁰ 2.0 × 10⁻¹⁰ A/0.005
rs1395388 TGM4f 44923678 1.8 × 10⁻⁸ 4.2 × 10⁻⁹ G/0.05
rs449361 ARHGEF26g 155405100 2.8 × 10⁻⁸ 6.6 × 10⁻⁹ T/0.05
rs1014805 CNTN4h 2310471 7.7 × 10⁻⁸ 9.1 × 10⁻⁴ C/0.33
rs2535632 ITIH4i 52839315 1.8 × 10⁻⁷ 4.3 × 10⁻⁸ T/0.03
rs9854606 CNTN4 2380442 1.9 × 10⁻⁷ 2.9 × 10⁻³ T/0.004
rs1685456 CNTN4 2321860 2.1 × 10⁻⁷ 1.8 × 10⁻³ C/0.43
rs1685447 CNTN4 2313137 2.1 × 10⁻⁷ 3.4 × 10⁻³ A/0.27
rs1178487 CNTN4 2315743 2.2 × 10⁻⁷ 3.0 × 10⁻³ T/0.41
rs17013501 CNTN4 2396201 2.5 × 10⁻⁷ 5.0 × 10⁻³ T/0.22
rs6808240 CNTN4 2397321 3.3 × 10⁻⁷ 8.8 × 10⁻³ C/0.27
rs1178492 CNTN4 2318040 3.7 × 10⁻⁷ 7.7 × 10⁻³ T/0.27
rs1502582 CNTN4 2326831 3.7 × 10⁻⁷ 6.7 × 10⁻³ T/0.24
rs1720201 CNTN4 2313231 4.4 × 10⁻⁷ 1.1 × 10⁻² G/0.27
a
SNP: Single Nucleotide Polymorphism;b
JLA: Joint Linkage Association Analysis;c
MGA: Measured Genotype Analysis;d
ITPR1: inositol 1,4,5-trisphosphate receptor,
type 1;eDCP1A
: decapping mRNA 1A;fTGM4
: transglutaminase 4;gARHGEF26
: Rho guanine nucleotide exchange factor (GEF) 26;hCNTN4
: Contactin 4;iITIH4
Other genes in our QTL region,
ITPR1
,
DCP1A
and
TGM4
, do not seem to have functional relevance to SUA
concentrations. However, all of these genes are located in
or border the ~4.5 Mb region which is associated with a
syndrome known as 3p deletion syndrome. Individuals
with 3p deletion syndrome have a rare genetic disorder
characterized by developmental delay, growth retardation
and dysmorphic features [22].
ITPR1
encodes an
intracel-lular IP3-gated calcium channel involved in calcium
sig-naling [40]. Mutations in this gene have been associated
with spinocerebellar ataxia [41] and platelet signaling
pathways [42], and
DCP1A
is known to play a role in
mRNA decay and also in prematurely terminating protein
synthesis [43].
As described in the methods, the JLA approach has the
potential to amplify a signal taking into consideration
ran-dom effects of shared sequence identity (linkage) and the
fixed effects of marker genotypes (association), thus
maxi-mizing the information in a sample of related individuals
[12]. With this approach, we had previously found common
SNPs, MAF > 5 %, in
SLC2A9
to be significantly associated
with SUA levels in Mexican Americans [12]. Our JLA
approach also has the ability to detect rare variants which
were primarily from the chromosome 3p26 region showing
that rare or low frequency variants are more likely to be
identified by linkage rather than association. Of the top 6
significant SNPs, 5 of them had MAF
≤
5 %.
Family-based studies provide the best opportunity to identify
these rare variants, with Mendelian transmission from
parent to offspring offering a chance to maximize copies
of rare variants in the pedigree. This was supported by
our analyses when we found that about six families
contributed the most to the LOD score (~4.6). When we
conducted the linkage analysis removing these families,
the LOD score was reduced to zero, whereas, linkage
ana-lysis in just these families increased the LOD score to 5.5.
The association between SUA concentrations and
vari-ants in the chromosome 3p region has not been reported
in any population except a study in an isolated population
in Europe. This study reported epistasis between
SLC2A9
and
CNTN4
suggesting a link between SUA levels and
autism-related spectrum disorder. Purine metabolism
dis-orders have been reported in autism spectrum disdis-orders
[44, 45] particularly hyperuricosuric autism. Adenosine, a
precursor of uric acid in purine metabolic pathway, is
believed to be neuroprotective and known to promote
sleep and reduce seizures [46] indicating its potential as a
therapeutic agent for autism. Lack of replication of the
associations between SUA and
CNTN4
or
ITPR1
SNPs by
other studies is a limitation of the study. However,
consid-ering the role of purine metabolic disorders in autism, role
for
CNTN4
and
ITPR1
in the regulation of SUA seems
plausible and needs to be evaluated further.
To gain further support for the association with the
chromosome 3p26 region, we conducted JLA of
cis
-reg-ulated
ITPR1
transcript. Our best associations of these
transcript levels were with SNPs in
ITPR1
and
SCN8A
genes.
Cis
-regulated transcripts contain genetic variation
Table 3
Genotype-specific phenotype means of serum uric acid (mg/dl) concentrations for significant and suggestive associations
SNPa Genotype-specific phenotype means [Mean (SD)] Effect sizeb(%)
Minor/minor Minor/major Major/major
rs17040820 – 7.15 (1.2) 5.56 (1.5) 5.2
rs7640752 – 5.13 (1.8) 5.57 (1.5) 5.4
rs11916691 – 6.63 (0.8) 5.56 (1.5) 5.4
rs1395388 – 5.74 (1.6) 5.55 (1.5) 4.7
rs449361 4.3 (0.3) 5.76 (1.6) 5.56 (1.5) 4.7
rs1014805 5.82 (1.6) 5.89 (1.6) 5.70 (1.6) 0.6
rs2535632 – 5.27 (1.3) 5.58 (1.5) 4.4
rs9854606 – 6.77 (1.8) 5.53 (1.5) 1.1
rs1685456 5.93 (1.7) 5.83 (1.5) 5.66 (1.6) 0.7
rs1685447 5.30 (1.3) 5.69 (1.5) 5.52 (1.6) 0.8
rs1178487 5.93 (1.6) 5.82 (1.6) 5.70 (1.7) 0.6
rs17013501 5.69 (1.5) 5.65 (1.5) 5.89 (1.7) 0.5
rs6808240 6.00 (1.7) 5.93 (1.7) 5.66 (1.5) 0.4
rs1178492 5.70 (1.7) 5.90 (1.6) 5.73 (1.6) 0.5
rs1502582 5.71 (1.8) 5.91 (1.5) 5.74 (1.6) 0.4
rs1720201 5.77 (1.6) 5.88 (1.6) 5.74 (1.6) 0.4
rs1562692 – 4.92 (1.2) 5.61 (1.5) 3.7
a
SNP: Single Nucleotide Polymorphism;b
Effect size: Proportion of the residual phenotypic variance that is explained by the minor allele of the SNP
Table 4
Genome-wide association of
ITPR1
transcript levels
SNPa Geneb Chr Coordinates NCBI36 (bp) MGAc(p-value) JLAd(p-value) Effect sizee(%) Minor allele MAFf
rs877850 Intergenic 1 216328255 2.35 × 10⁻⁷ 9.05 × 10⁻⁷ 2.61 G 0.12
rs9311419 ITPR1 3 4855671 9.12 × 10⁻⁷ 3.37 × 10⁻⁶ 2.58 T 0.14
rs4685832 ITPR1 3 4859817 1.19 × 10⁻⁶ 4.37 × 10⁻⁶ 2.50 G 0.16
rs12581731 SCN8A 12 50311004 2.54 × 10⁻⁶ 8.89 × 10⁻⁶ 1.97 A 0.12
rs3805034 ITPR1 3 4855266 4.22 × 10⁻⁶ 1.48 × 10⁻⁶ 2.31 A 0.12
rs3805035 ITPR1 3 4855300 4.94 × 10⁻⁶ 1.72 × 10⁻⁶ 2.30 T 0.13
rs10886848 Intergenic 10 122831260 1.41 × 10⁻⁵ 3.44 × 10⁻⁵ 1.73 A 0.46
rs10170245 LOC105373893 2 220897407 1.61 × 10⁻⁵ 5.36 × 10⁻⁵ 1.67 A 0.09
rs4561600 Intergenic 2 142915296 1.71 × 10⁻⁵ 5.70 × 10⁻⁵ 1.58 G 0.17
rs4553758 Intergenic 2 142914017 1.83 × 10⁻⁵ 6.07 × 10⁻⁵ 1.50 A 0.21
a
SNP: Single nucleotide polymorphism;b
ITPR1: inositol 1,4,5-trisphosphate receptor, type 1;SCN8A: sodium channel, voltage gated, type VIII alpha subunit;c
MGA: Measured Genotype Analysis;d
JLA: Joint Linkage Association Analysis;e
Effect size: Proportion of the residual phenotypic variance that is explained by the minor allele of the SNP;fMAF: Minor Allele Frequency
within their gene and regulatory regions that affect their
abundance [29]. The
SCN8A
gene encodes a protein that
is important for neuron hyperexcitability [47] and
muta-tions in this gene are known to cause cerebellar ataxia,
which is the similar to that of
ITPR1
. Given the
import-ance of 3p region in neurological disorders and potential
role of uric acid as biomarker for these disorders, this
region assumes significance.
Conclusion
Our findings demonstrate the importance of variants in
chromosome 3p26 region, particularly SNPs in
ITPR1
and
CNTN4
, in the regulation of SUA concentrations in
our cohort. The results of this study are very promising,
though further work needs to be performed to validate
them.
Methods
Study population
The San Antonio Family Heart Study (SAFHS) and the San
Antonio Family Diabetes/Gallbladder study (SAFDGS): The
recruitment for the SAFHS was initiated in 1991, and
recruitment for SAFDGS was conducted between 1998 and
2001. Details of study recruitment and related material have
been detailed previously [48–51]. Genome-wide
associ-ation, joint linkage/associassoci-ation, and transcriptional analyses
were performed on 1281 individuals, coming from 120
Mexican American families from these two studies, for
whom whole genome-wide SNP data and related
pheno-type data were available.
Phenotyping
For both SAFHS and SAFDGS, several metabolic,
hemodynamic, anthropometric, and demographic
vari-ables were collected using standard procedures [46, 48].
Uric acid was measured in serum by a colorimetric assay
using uricase and peroxidase [52]. A description of the
measurement techniques is given elsewhere [9, 12, 53].
Uric acid levels were rank-inverse-normalized prior to
genetic analysis.
Transcriptional profiling
The transcriptional profiling in the SAFHS was performed
in 1281 individuals. The methodology related to isolation
of lymphocytes from whole blood, isolation of total RNA,
anti-RNA synthesis, amplification and purification and
identification of expressed transcripts is described in detail
in Göring et al., 2007 [29].
SNP genotyping
Genome-wide association (GWAS) analysis was conducted
in the SAFHS/SAFDGS using SNP genotypes obtained
from the Illumina HumanHap550 BeadChip (Illumina,
SanDiego, CA). Our experimental error rate (based on
duplicates) was 2 per 100,000 genotypes. The average
call rate per individual sample was 97 %. Approximately
1 per 1000 genotypes was blanked due to Mendelian
errors. Specific SNPs were removed from analysis if
they had call rates
<
95 % (about 4000SNPs) or deviated
from Hardy–Weinberg equilibrium at a 5 % false discovery
rate (FDR) (12SNPs). Missing genotypes were imputed
from pedigree data using MERLIN [54]. SNP genotypes
were checked for Mendelian consistency using the program
SimWalk2 [55]. The estimates of the allele frequencies and
their standard errors were obtained using Sequential
Oligo-genic Linkage Analysis Routines (SOLAR) [56].
Heritability analysis
We used a variance components decomposition-based
method in SOLAR to estimate heritability of serum uric
acid and transcript levels of associated genes. Total
pheno-typic variance can be partitioned into its genetic and
envir-onmental components. The fraction of total phenotypic
variance (
V
P) resulting from additive genetic effects (
V
G) is
called heritability and is denoted as
h
2= V
G/V
P[56]. All
traits were adjusted for age, sex and their interaction
effects.
Joint linkage/Association analysis
We used a joint linkage/association (JLA) approach for
each SNP, implemented in SOLAR, that tested each
satu-rated model (including linkage and the fixed effect of the
SNP) against a null model in which both effects were
constrained to zero. All SNPs in the GWAS panel were
mapped not only to their physical location but also to their
genetic position, given as the nearest integral centiMorgan,
based on public data [12]. JLA may improve detection
when multiple causal variants are present, as the summed
effects of adjacent variants captured by linkage may amplify
the fixed effect of each measured marker. A subsidiary
measured genotype association analysis (MGA) [57] tested
the additive effect of each SNP genotype conditioned on
the genome-wide genetic similarity of the relatives (i.e., a
standard GWAS corrected for relatedness). The
genome-wide significance threshold
p
-value was set at
p
< 3.1 × 10
−7using Bonferroni correction for multiple tests based on the
effective number of independent SNPs given linkage
dis-equilibrium (LD) within the sample [58].
Ethics approval and consent to participate
All participants gave written informed consent. Protocol
for both studies (SAFHS and SAFDGS) were approved by
the Institutional Review Boards at the University of Texas
Health Science Center San Antonio and University of
North Carolina at Chapel Hill
Availability of data and material
Major portion of the data used in this study is deposited
in dbGAP (T2D-GENES Project 2: San Antonio Mexican
American Family Studies.dbGAP Study Accession: phs00
0462.v1.p1.
http://www.ncbi.nlm.nih.gov/projects/gap/cgi-bin/study.cgi?study_id=phs000462.v1.p1.
Rest of the data is in the process of being deposited.
However, we welcome the opportunity to form formal
collaborations with investigators who are working in this
research area and are interested in utilizing these data.
Competing interests
The authors declare that they have no competing interests.
Authors’contributions
GC–Conceived and performed all aspects of statistical analysis and wrote the manuscript. JWK-Helped with statistical analysis and manuscript preparation and editing. MA- Helped with genotype cleaning, statistical analysis and manuscript editing. SP- Helped with statistical analysis and manuscript editing. VF- Helped with genotype cleaning, statistical analysis and manuscript editing. SAC- Helped with study design and manuscript preparation and editing. KH- Helped with genotype cleaning and manuscript preparation and editing. HHHG- Helped with statistical analysis and manuscript editing. JWM (Original PI of SAFHS) - Helped with study design and manuscript editing. JEC- Helped with manuscript editing. MAC- Helped with manuscript editing. MPJ- Helped with manuscript editing. EKM- Helped with manuscript editing. LA- Helped with manuscript editing. MCM- Helped with statistical analysis and manuscript editing. DML- Helped with statistical analysis and manuscript editing. RD (PI of SAFDGS)- Helped with study design, statistical analysis and manuscript editing. AGC- Helped with study design, statistical analysis and manuscript editing. JB (Current PI of SAFHS)- Helped with study design, statistical analysis and manuscript editing. VSV- Conceived the research question, designed the study, helped with statistical analysis and manuscript preparation and editing. All authors read and approved the final manuscript.
Acknowledgements
We wish to thank all participants for their cooperation and generous participation.
Funding
This work was supported by grants R01DK092238, R01 DK047482 and R01 DK053889 from National Institute of Diabetes and Digestive and Kidney Diseases (NIDDK), PO1 HL045522 from National Heart, Lung and Blood Institute (NHLBI) and MH059490 from National Institute of Mental Health (NIMH) of the National Institutes of Health. The SAFHS is supported by P01 HL045522; the SAFDS is supported by R01 DK047482; the SAFGS is supported by R01 DK053889. A donation from the Azar and Shepperd families in San Antonio paid for the SNP typing in the SAFHS. This investigation was conducted in part in facilities constructed with support from the Research Facilities Improvement Program under grant numbers C06 RR013556 and C06 RR017515. The AT&T Genomics computing center supercomputing facilities used for this work were supported in part by a gift from the AT&T Foundation and with support from the National Center for Research Resources Grant Number S10RR029392. The funders had no role in study design, data collection and analysis, decision to publish, or preparation of the manuscript.
Author details
1Department of Nutrition, University of North Carolina at Chapel Hill, Chapel
Hill, NC, USA.2UNC Nutrition Research Institute, University of North Carolina at Chapel Hill, 500 Laureate Way, Kannapolis, NC 28081, USA.3Department of Genetics, Texas Biomedical Research Institute, San Antonio, TX, USA.4South Texas Diabetes and Obesity Institute, School of Medicine, University of Texas Rio Grande Valley, Brownsville, TX, USA.5Centre for Genetic Epidemiology and Biostatistics, The University of Western Australia, Perth, WA, Australia. 6Department of Medicine, University of Texas Health Science Center at San
Antonio, San Antonio, TX, USA.
Received: 10 August 2015 Accepted: 16 March 2016
References
1. Álvarez-Lario B, Macarrón-Vicente J. Uric acid and evolution. Rheumatology (Oxford). 2010;49:2010–5.
2. Cirillo P, Sato W, Reungjui S, Heinig M, Gersch M, Sautin Y, Nakagawa T, Johnson RJ. Uric acid, the metabolic syndrome, and renal disease. J Am Soc Nephrol. 2006;17:S165–8.
3. Dawson J, Walters M. Uric acid and xanthine oxidase: future therapeutic targets in the prevention of cardiovascular disease? Br J Clin Pharmacol. 2006;62:633–44.
4. Nakagawa T, Tuttle KR, Short RA, Johnson RJ. Hypothesis: fructose-induced hyperuricemia as a causal mechanism for the epidemic of the metabolic syndrome. Nat Clin Pract Nephrol. 2005;1:80–6.
5. Nakagawa T, Kang DH, Feig D, Sanchez-Lozada LG, Srinivas TR, Sautin Y, Ejaz AA, Segal M, Johnson RJ. Unearthing uric acid: an ancient factor with recently found significance in renal and cardiovascular disease. Kidney Int. 2006;69:1722–5.
6. Rho YH, Zhu Y, Choi HK. The epidemiology of uric acid and fructose. Semin Nephrol. 2011;31:410–9.
7. Zhu Y, Pandya BJ, Choi HK. Prevalence of gout and hyperuricemia in the US general population: the National Health and Nutrition Examination Survey 2007–2008. Arthritis Rheum. 2011;63:3136–41.
8. Juraschek SP, Miller 3rd ER, Gelber AC. Body mass index, obesity, and prevalent gout in the United States in 1988–1994 and 2007–2010. Arthritis Care Res (Hoboken). 2013;65:127–32.
9. Voruganti VS, Nath SD, Cole SA, Thameem F, Jowett JB, Bauer R, MacCluer JW, Blangero J, Comuzzie AG, Abboud HE, Arar NH. Genetics of variation in serum uric acid and cardiovascular risk factors in Mexican Americans. J Clin Endocrinol Metab. 2009;94:632–8.
10. Voruganti VS, Göring HH, Mottl A, Franceschini N, Haack K, Laston S, Almasy L, Fabsitz RR, Lee ET, Best LG. Genetic influence on variation in serum uric acid in American Indians: the strong heart family study. Hum Genet. 2009; 126:667–76.
11. Kraja AT, Hunt SC, Pankow JS, Myers RH, Heiss G, Lewis CE, Rao DC, Province MA. Quantitative trait loci for metabolic syndrome in the Hypertension Genetic Epidemiology Network Study. Obes Res. 2005;13:1885–90. 12. Voruganti VS, Kent Jr JW, Debnath S, Cole SA, Haack K, Göring HH, Carless MA,
Curran JE, Johnson MP, Almasy L. Genome-wide association analysis confirms and extends the association of SLC2A9 with serum uric acid levels to Mexican Americans. Front Genet. 2013;4:279.
13. Voruganti VS, Franceschini N, Haack K, Laston S, MacCluer JW, Umans JG, Comuzzie AG, North KE, Cole SA. Replication of the effect of SLC2A9 genetic variation on serum uric acid levels in American Indians. Eur J Hum Genet. 2014;22:938–43.
14. Voruganti VS, Laston S, Haack K, Mehta NR, Cole SA, Butte NF, Comuzzie AG. Serum uric acid concentrations and SLC2A9 genetic variation in Hispanic children: the Viva La Familia Study. Am J Clin Nutr. 2015;101:725–32. 15. Li S, Sanna S, Maschio A, Busonero F, Usala G, Mulas A, Lai S, Dei M, Orrù M,
Albai G. The GLUT9 gene is associated with serum uric acid levels in Sardinia and Chianti cohorts. PLoS Genet. 2007;3:e194.
16. Döring A, Gieger C, Mehta D, Gohlke H, Prokisch H, Coassin S, Fischer G, Henke K, Klopp N, Kronenberg F. SLC2A9 influences uric acid concentrations with pronounced sex-specific effects. Nat Genet. 2008;40:430–6.
17. McArdle PF, Parsa A, Chang YP, Weir MR, O’Connell JR, Mitchell BD, Shuldiner AR. Association of a common nonsynonymous variant in GLUT9 with serum uric acid levels in old order Amish. Arthritis Rheum. 2008;58: 2874–81.
18. Karns R, Zhang G, Sun G, Rao Indugula S, Cheng H, Havas-Augustin D, Novokmet N, Rudan D, Durakovic Z, Missoni S. Genome-wide association of serum uric acid concentration: replication of sequence variants in an island population of the Adriatic coast of Croatia. Ann Hum Genet. 2012;76:121–7. 19. Dehghan A, Köttgen A, Yang Q, Hwang SJ, Kao WL, Rivadeneira F,
Boerwinkle E, Levy D, Hofman A, Astor BC. Association of three genetic loci with uric acid concentration and risk of gout: a genome-wide association study. Lancet. 2008;372:1953–61.
21. Zhang L, Spencer KL, Voruganti VS, Jorgensen NW, Fornage M, Best LG, Brown-Gentry KD, Cole SA, Crawford DC, Deelman E. Association of functional polymorphism rs2231142 (Q141K) in the ABCG2 gene with serum uric acid and gout in 4 US populations: the PAGE Study. Am J Epidemiol. 2013;177:923–32.
22. Cargile CB, Goh DL, Goodman BK, Chen XN, Korenberg JR, Semenza GL, Thomas GH. Molecular cytogenetic characterization of a subtle interstitial del(3)(p253p262) in a patient with deletion 3p syndrome. Am J Med Genet. 2002;109:133–8.
23. Fernandez T, Morgan T, Davis N, Klin A, Morris A, Farhi A, Lifton RP, State MW. Disruption of contactin 4 (CNTN4) results in developmental delay and other features of 3p deletion syndrome. Am J Hum Genet. 2004;74:1286–93.
24. Ascherio A, LeWitt PA, Xu K, Eberly S, Watts A, Matson WR, Marras C, Kieburtz K, Rudolph A, Bogdanov MB. Urate predicts rate of clinical decline in Parkinson disease. Arch Neurol. 2009;66:1460–8.
25. Euser SM, Hofman A, Westendorp RG, Breteler MM. Serum uric acid and cognitive function and dementia. Brain. 2009;132:377–82.
26. Moccia M, Lanzillo R, Palladino C, Carotenuto A, Massarelli M, Vacca G, Vacchiano V, Nardone A, Triassi M, Morra VB. Uric acid: a potential biomarker of multiple sclerosis and of its disability. Clin Chem Lab Med. 2015;53:753–9. 27. Mousavi M, Jonsson P, Antti H, Adilfsson R, Nordin A, Bergdahl J, Eriksson K,
Moritz T, Nisson LG, Nyberg L. Serum metabolomics biomarkers of dementia. Dement Geriatr Cogn Disord Extra. 2014;4:252–62. 28. Zhu A, Zou T, Xiong G, Zhang J. Association of uric acid with traditional
inflammatory factors in stroke. Int J Neurosci. 2016;126:335–41. 29. Göring HHH, Curran JE, Johnson MP, Dyer TD, Charlesworth J, Cole SA,
Jowett JBM, Abraham LJ, Rainwater DL, Comuzzie AG. Discovery of expression QTLs using large-scale transcriptional profiling in human lymphocytes. Nat Genet. 2007;39:1208–16.
30. Roohi J, Montagna C, Tegay DH, Palmer LE, DeVincent C, Pomeroy JC, Christian SL, Nowak N, Hatchwell E. Disruption of contactin 4 in three subjects with autism spectrum disorder. J Med Genet. 2009;46:176–82. 31. Cottrell CE, Bir N, Varga E, Alvarez CE, Bouvain S, Zernzach R, Thrush DL,
Evans J, Trimarchi M, Butter EM. Contactin 4 as an autism susceptibility locus. Autism Res. 2011;4:189–99.
32. Poot M. A candidate gene association study further corroborates involvement of contactin genes in autism. Mol Syndromol. 2014;5:229–35. 33. Sui WG, He HY, Yan Q, Chen JJ, Zhang RH, Dai Y. ChIP-seq analysis of histone H3K9 trimethylation in peripheral blood mononuclear cells of membranous nephropathy patients. Braz J Med Biol Res. 2014;47:42–9. 34. Constantinescu R, Zetterberg H. Urate as a marker of development and
progression in Parkinson’s disease. Drugs Today (Barc). 2011;47:369–80. 35. Spitsin S, Koprowski H. Role of uric acid in multiple sclerosis. Curr Top
Microbiol Immunol. 2008;318:325–42.
36. Spitsin S, Koprowski H. Role of uric acid in Alzheimer’s disease. J Alzheimers Dis. 2010;19:1337–8.
37. Du N, Xu D, Hou X, Song X, Liu C, Chen Y, Wang Y, Li X. Inverse association between serum uric acid levels and Alzheimer’s disease risk. Mol Neurobiol. 2015; Jun 18 [Epub ahead of print].
38. Vannorsdall TD, Jinnah HA, Gordon B, Kraut M, Schretlen DJ. Cerebral ischemia mediates the effect of serum uric acid on cognitive function. Stroke. 2008;39:3418–20.
39. Cicero AF, Desideri G, Grossi G, Urso R, Rosticci M, D’Addato S, Borghi C, Brisighella Heart Study group. Serum uric acid and impaired cognitive function in a cohort of healthy young elderly: data from the Brisighella Study. Intern Emerg Med. 2015;10:25–31.
40. Berridge M. Inositol trisphosphate and calcium signaling. Nature. 1993; 361:315–25.
41. Schwartzentruber J, Zou R, Schofield PW, Douglas S, Bulman DE, et al. Missense mutations in ITPR1 cause autosomal dominant congenital nonprogressive spinocerebellar ataxia. Orphanet J Rare Dis. 2012;7:67. 42. Jones CI, Bray S, Garner SF, Stephens J, de Bono B, Angenent WG, Bentley
D, Coffey A, Deloukas P, Earthrowl M. A functional genomics approach reveals novel quantitative trait loci associated with platelet signaling pathways. Blood. 2009;114:1405–16.
43. Bai RY, Koester C, Ouyang T, Hahn SA, Hammerschmidt M, Peschel C, et al. SMIF, a Smad4-interacting protein that functions as a co-activator in TGF-beta signaling. Nature Cell Biol. 2002;4:181–90.
44. Manzi B, Loizzo AL, Giana G, Curatolo P. Autism and metabolic diseases. J Child Neurol. 2008;23:307–14.
45. Zecavati N, Spence SJ. Neurometabolic disorders and dysfunction in autism spectrum disorders. Curr Neurol Neurosci Rep. 2009;9:129–36.
46. Masino SA, Kawamura Jr M, Cote JL, Williams RB, Ruskin DN. Adenosine and autism: a spectrum of opportunities. Neuropharmacology. 2013;68:116–21. 47. Veerama KR, O’Brien JE, Meisler MH, Cheng X, Dib-Hajj SD, Waxman SG,
Talwar D, Girirajan S, Eichler EE, Restifo LL. De novo pathogenic SCN8A mutation identified by whole-genome sequencing of a family quartet affected by infantile epileptic encephalopathy and SUDEP. Am J Hum Genet. 2012;90:502–10.
48. MacCluer JW, Stern MP, Almasy L, Atwood LA, Blangero J, Comuzzie AG, Dyke B, Haffner SM, Henkel RD, Hixson JE. Genetics of atherosclerosis risk factors in Mexican Americans. Nutr Rev. 1999;57:S59–65.
49. Mitchell BD, Almasy LA, Rainwater DL, Schneider JL, Blangero J, Stern MP, MacCluer JW. Diabetes and hypertension in Mexican American families: relation to cardiovascular risk. Am J Epidemiol. 1999;149:1047–56. 50. Duggirala R, Mitchell BD, Blangero J, Stern MP. Genetic determinants of
variation in gallbladder disease in the Mexican-American population. Genet Epidemiol. 1999;16:191–204.
51. Puppala S, Dodd GD, Fowler S, Arya R, Schneider J, Farook VS, Granato R, Dyer TD, Almasy L, Jenkinson CP. A genomewide search finds major susceptibility loci for gallbladder disease on chromosome 1 in Mexican Americans. Am J Hum Genet. 2006;78:377–92.
52. Domagk GF, Schlicke HH. A colorimetric method using uricase and peroxidase for the determination of uric acid. Anal Biochem. 1968;22:219–24.
53. Arar NH, Voruganti VS, Nath SD, Thameem F, Bauer R, Cole SA, Blangero J, MacCluer JW, Comuzzie AG, Abboud HE. A genome-wide search for linkage to chronic kidney disease in a community-based sample: the SAFHS. Nephrol Dial Transplant. 2008;23:3184–91.
54. Abecasis GR, Cherny SS, Cookson WO, Cardon LR. Merlin–rapid analysis of dense genetic maps using sparse gene flow trees. Nat Genet. 2009;30:97–101. 55. Sobel E, Lange K. Descent graphs in pedigree analysis: applications to
haplotyping, location scores, and marker-sharing statistics. Am J Hum Genet. 1996;58:1323–37.
56. Almasy L, Blangero J. Multipoint quantitative-trait linkage analysis in general pedigrees. Am J Hum Genet. 1998;62:1198–211.
57. Boerwinkle E, Chakroborty R, Sing CF. The use of measured genotype information in the analysis of quantitative phenotypes in man. I. Models and analytical methods. Ann Hum Genet. 1986;50:181–94.
58. Moskvina V, Schmidt KM. On multiple testing in genome-wide association studies. Genet Epidemiol. 2008;32:567–73.
• We accept pre-submission inquiries
• Our selector tool helps you to find the most relevant journal
• We provide round the clock customer support
• Convenient online submission
• Thorough peer review
• Inclusion in PubMed and all major indexing services
• Maximum visibility for your research
Submit your manuscript at www.biomedcentral.com/submit