ORIGINAL ARTICLE
Can Capital Structure Affect the Financial Performance of Banks in
Turkey?
Merve Tuncay
Cumhuriyet University, Faculty of Economics and Administrative Sciences, Department of Banking & Finance, Sivas, Turkey
Abstract:The aim of this study is to investigate the determinants of banks’ financial performance in terms of the capital structure. Annual financial statements of 11 banks traded in Borsa Istanbul are employed for the period of 2006-2016. Return on assets, return on equity and earnings per share are chosen for financial performance measures. The independent variables related to the capital structure are capital adequacy, equity-to-asset, and financial leverage ratios. In addition, macroeconomic variables and bank-specific variables are also considered as control variables for the analysis. The data are analyzed by the panel data regression analysis as it provides more informative finding and less multicollinearity among variables than time series and cross-sectional analyzes.
TheHausmantestresultsindicatethattherandomeffectsmodelisappropriatefor thewholedependentvariables.
Accordingtothe findings;while equity-to-assetratioaffects returnonassets positively,amongstthe controlvariables
specific tofirms, firmsize, assetquality andasset growth variables havesignificant effects onreturn onassets.It is
found no significant effect of independent variableson return on equity, however, it is seen that asset quality has a
negativeandsignificanteffect.Inflation andinterestrateshaveasignificanteffectonbothvariables.Finally,itisseen
that equity-to-assetratio hasapositiveandsignificanteffectonearningspershare.Only theeffectofasset qualityon
earningspershareisfoundtobesignificantamongthe controlvariables.Findings ofthestudyareconsistentwiththe
previousstudies.Inaddition,theM&Mviewsarenotsupportedbythefindingsrelatedtoreturnonassetsandearnings
persharebutthereturnonequity.
Keywords:CapitalStructure; Profitability; Banking; Panel Data Analysis; Borsa Stanbul
1. Introduction
Despite the fact that debt has an advantage over equity in terms of cost, equity has also advantages as it provides more security both for the firm and the stakeholders. Therefore it is an important question to decide in which way a firm should finance its assets assuming it can easily reach any kind of resources. From the very beginning of the development of finance literature, it is seen that the effect of capital structure on the firm performance and cost of capital has always gained attention among the academicians.
Modigliani and Miller’s study in 1958 contributes an important insight into the literature related to the cost of capital as they argue that the market value and the average cost of capital of any firm is totally independent of its capital structure (Modigliani and Miller, 1958: 268-269). Before that, it is believed that since debt is a cheap financing source, a reasonable increase in the share of debt to total assets would reduce the average cost of capital and thus increase the firm value (Gursoy, 2012: 577). Basic approaches to the effect of financial leverage on cost of capital and firm value
Copyright © 2019 Merve Tuncay. doi: 10.18686/fm.v4i1.1130
This is an open-access article distributed under the terms of the Creative Commons Attribution Unported License
(http://creativecommons.org/licenses/by-nc/4.0/), which permits unrestricted use, distribution, and reproduction in any medium, provided the original work is properly cited.
can be summarized as follows (Akguc, 1998: 485-499):
“Net Income Approach” is the one considering the effect of the leverage the most. Accordingly, a firm can increase its market value and decrease average cost of capital by continually benefiting from the leverage. It assumes that the cost of equity is higher than the cost of debt and the costs are constant at each level.
“Net Operating Income Approach” assumes that the average cost of capital is fixed for all combinations of capital structure. As long as the firm finds cheaper debt than the average cost of capital it will be counterbalanced by the increase in the cost of equity as a result of increasing financial risks and therefore the total capital structure would not have an impact on the cost of capital and the firm value.
“Traditional Approach” argues that there is only one optimal capital combination for each firm and the firm can reduce the average cost of capital and increase the firm value by using financial leverage since the cost of equity is higher than the cost of debt. However, this decline is limited to a certain point where the capital structure becomes risky as a result of overindebtedness and thus increasing financial risk. So this is where the firm attains optimum capital structure for itself. From this point, both the creditors and investors require more security in order to compensate increasing risk causing both the cost of debt and equity increase.
“Modigliani & Miller Approach” is similar to that of net operating income approach, namely capital structure does not affect the average cost of capital and the firm value. The logic lies behind this idea is that the equity becomes riskier as the firm depends on more debt. Instead, the firm value depends on the sum of firm’s future cash flows discounted by a proper discount rate that is determined by the risk category it belongs to. This approach assumes that the capital markets are efficient, expected returns for the probability distribution of the future income are the same with those of the current income and firms can be categorized according to the same risk groups.
Another approach is the "trade-off theory of capital structure" arguing that a firm's decision regarding its capital structure comprises a trade-off between the tax benefits of debt and the cost of financial distress. Accordingly, there is an optimum structure for each firm including the firm's target debt level. However an exact formula determining a firm's optimal debt level has not been developed yet as financial distress costs cannot be expressed properly (Ross, Westerfield and Jaffe, 2008: 466).
After trade-off theory, another theory gaining interest in the corporate finance is the pecking-order theory considering also the timing while deciding among alternative capital sources. Therefore this approach implies using internal financing first and issuing safe securities first. Implications of the theory in the real world can be summarized in three points that there is no target amount of leverage since each firm balances between the benefits and costs of debt, profitable firms use less debt since such firms provide cash internally and finally firms prefer financial slack helping
them not forced to go to the capital markets in case of a downturn period or a proper project coming up (Ross et al.,
2008: 472-475).
Liability management is as important as asset management in the banking sector which basically operates depending on trust and also has the aim of increasing financial performance as the other profit-seeking organizations. Banks with sound capital structure have the advantage of standing up to financial turmoils more and attracting more funds. The changes brought by the Basel Accords also limited the decision areas of the banks by tightening capital regulations. In addition to this, the regulations introduced after the 2001 crisis in Turkey, aimed to consolidate the sector while eliminating the fragilities. However, these regulations also made it easier for Turkey to adapt to the Basel Accords and caused Turkey being less vulnerable to the global financial crisis. Considering the banking sector, which accounts for nearly 80% of the Turkish financial system by the end of 2016, it is inevitable to expect that the volatilities in the financial performance of the banking sector would affect other areas and the overall economy at a significant level. According to the Banking Regulation and Supervision Agency’s (BDDK) Turkish Banking Sector basic indicators report, there are 33 commercial banks, 13 participation banks and 5 development and investment banks in the sector as of September 2017 and total assets to GDP is 1,05 in the end of 2016. It is seen that the banking sector in Turkey plays a vital role not only by its inherent function as transmitting funds efficiently between those demanding and supplying
funds in the financial system but also in terms of the contribution it makes to the development of and its share in the Turkish economy. Moreover, while credits compose the 65% of the total assets, deposits compose 54% of the total liabilities and capital adequacy ratio, showing a stable view in the recent years, is seen to be 17.20% in the sector as of September 2017 according to the same report. Therefore, considering the determinants of financial performance in the banking sector in Turkey from the perspective of capital structure is expected to make a significant contribution both to the literature and policymakers.
Consistent with the aim of this study, the data of consolidated annual financial statements of commercial banks and participation banks traded in the Borsa Istanbul (BIST) from 2006 to 2016 are investigated by the panel data regression analysis. The reason for dealing with the data of banks traded in the BIST is that their data are reliable and examined by independent auditing hence allowing for more reliable findings and interpretations.
2. Literature Review
Although there are several studies about the interaction of capital structure and firm performance, it is seen that there are limited studies targeting the banking sector, especially in Turkey. Also, it is seen that all these studies come to various conclusions. Some of these studies are summarized as follows:
Hailu (2015) uses net interest margin as an indicator of bank performance and total debt to asset, deposit to asset, loan to deposit, spread, growth and asset size as independent variables for the years from 2001 to 2012 in order to examine the impact of capital structure on 8 Ethiopian Commercial Banks’ profitability by the panel data analysis. According to the findings, the variables of deposit to asset, loan to deposit, spread and asset size have a significant and positive impact while total debt to asset has a significant and negative impact on net interest margin.
Akhtar, Bano, Bano, Zia and Jameel (2016) investigate the impact of capital structure on 5 banks operating in Pakistan for the period of 2005 and 2015 by the panel data analysis. They used the debt to equity ratio as the indicator of capital structure. Profitability, quick ratio, growth rate, fixed assets to total assets, interest rate were used as performance indicators. Their findings show that debt to equity ratio has a negative significant effect on the profitability. They also found a significant relationship between the capital structure and the remaining variables.
Berger and Bonaccorsi di Patti (2006) investigate the relationship between capital structure and firm performance in the banking industry in order to test the corporate governance theory as it argues that leverage has an effect on agency costs and hence affects firm performance. They set forth that the findings are compatible with the theory. They use variations of profit efficiency, return on equity and financial equity capital divided by gross total assets as indicators of firm performance.
Nikoo (2015) finds that capital structure affects the performance of the banks in Tehran Stock Exchange positively for the period 2009-2014 in which he uses return on assets, return on equity and earnings per share as banking performance indicators. He also takes debt to equity as capital structure variable in the study which is composed of 17 banks’ panel data.
Njeri and Kagiri (2013) is another study investigating the relationship between capital structure and financial performance by conducting correlation and multiple regression analysis on the data of 30 banks listed in Nairobi Securities Exchange obtained by questionnaire. Their findings indicate that there is a positive relationship between the financial performance and debt-to-equity ratio, amount of debt, interest rates and leverage risk.
Abbadi and Abu-Rub (2012) take the return on equity and Tobin's q as dependent variables while using return on assets, total deposits to assets, total loans to assets and total loans to deposits as independent variables of 8 banks in Palestine for the period 2007-2010 and the analysis of multiple regression analysis. Their findings indicate that return on equity and total deposits to assets positively affect both return on equity and Tobin’s q.
Iheanyi, Sotonye, and Ejiodamen (2016) argue that while highly geared capital structure has a positive effect on return on equity, it has an inverse effect on return on assets for the banks in Nigeria. They classified the data of 11 banks into two groups according to their debt to equity ratio in which banks with a debt to equity ratio above 1 are named
highly geared while the rest are named as the lowly geared capital structure for the period of 2002 and 2013. They concluded that banks should benefit from more but low-cost debt in order to maximize their return and increase their assets as to be well positioned for better performance.
Differently, Pratomo and Ismail (2006) investigate the effect of capital structure on performance by analyzing the data of Islamic banks only. Dependent variable of the study is bank’s profit efficiency calculated by return on equity while independent variables are equity to total assets, standard deviation of return on equity, a dummy of firm’s size, total loans, investment in securities and finally deposit Herfindahl index of local market concentration for 15 Malaysian Islamic Banks from 1997 to 2004. They conclude that the findings are compatible with the agency theory which argues that since high leverage reduce agency costs it increases firm value.
Siddik, Kabiraj, and Joghee (2017) investigate the relationship between capital structure and performance of 22 banks in Bangladesh by panel data analysis for the years of 2005 - 2014. They use the variables of return on equity, return on assets and earnings per share as indicators of performance and as a representative of capital structure, they take long-term debt to equity, short-term debt to equity and total debt to equity. A number of control variables comprising bank-specific (liquidity, size, growth opportunities) and macroeconomic variables (economic growth and inflation rate) are also used to isolate the impact of capital structure on bank performance. Accordingly, there is a negative relationship between capital structure and bank performance.
3. Data and Methodology
The aim of this study is to investigate the relationship between bank performance and capital structure in Turkey by conducting the balanced panel data analysis on the data obtained from 11 banks traded at Borsa Istanbul from 2006 to 2016. The data are obtained from the Turkish Statistical Institute (TUIK), the Central Bank of the Republic of Turkey (CBRT) and the Banking Regulation and Supervision Agency (BRSA). Although there are 13 banks traded at Borsa Istanbul as of 2017, 2 of the banks are omitted from the analysis period since their data could not be obtained regularly. Banks considered for this analysis are shown in Table 1.
Code Name Type Code Name Type
akbnk Akbank corp. Private Commercial
Bank icbct
ICBC Turkey Bank corp.
Foreign Commercial Bank Established in Turkey
albrk
Albaraka Turk Katilim Bankasi corp.
Participation Bank isatr
Turkiye Iş Bankasi corp.
Private Commercial Bank
deniz Denizbank
corp.
Foreign Commercial Bank Established in Turkey
skbnk Sekerbank
corp. Private Commercial Bank
finbn Finansbank
corp.
Foreign Commercial Bank Established in Turkey vakbn Turkiye Vakiflar Bankasi corp.
Public Commercial Bank
garan
Turkiye Garanti Bankasi corp.
Foreign Commercial Bank Established in Turkey ykbnk Yapı ve Kredi Bankasi corp.
Private Commercial Bank
halkb Turkiye Halk
Bankasi corp. Public Commercial Bank
Similar to Nikoo (2015) and Siddik et. al (2017), variables chosen in order to conduct the analysis are shown in Table 2.
Code Name Type Calculation
ROA Return on Assets Dependent Net Profit / Total Assets ROE Return on Equity Dependent Net Profit / Owner’s Equity EPS Earning per Share Dependent Net Profit / Outstanding Shares CAPADEQ Capital Adequacy Independent Owner’s Equity / Total Deposits STRUCTURE Equity-to-Asset Independent Owner’s Equity / Total Assets LEVERAGE Financial Leverage Independent Total Liabilities/ Total Assets
INFLATION Inflation Controlled Consumer Price Index
INTEREST Interest Controlled Real Interest Rate
GROWTH Growth in Gross Domestic
Product (GDP) Controlled (GDPt-GDPt-1)/GDPt-1
SIZE Firm Size Controlled Natural Logarithm of Assets
AQUALITY Asset Quality (Loan to Deposit
Ratio) Controlled Loans / Deposits
ASSETG Growth in Assets Controlled (Assetst-Assetst-1)/ Assetst-1 Table 2.Variables considered for the analysis
The models set for the analysis can be shown in equation (1), (2) and (3) respectively.
ROAit= α0+ β1CAPADEQit+ β2STRUCTUREit+ β3LEVERAGEit+ β4INFLATIONit+ β5INTERESTit + β6GROWTHit+ β7SIZEit+ β8QUALITYit+ β9ASSETGit+ εi
(1) ROEit= α0+ β1CAPADEQit+ β2STRUCTUREit+ β3LEVERAGEit+ β4INFLATIONit+ β5INTERESTit
+ β6GROWTHit+ β7SIZEit+ β8QUALITYit+ β9ASSETGit+ εi (2)
EPSit= α0+ β1CAPADEQit+ β2STRUCTUREit+ β3LEVERAGEit+ β4INFLATIONit+ β5INTERESTit
+ β6GROWTHit+ β7SIZEit+ β8QUALITYit+ β9ASSETGit+ εi (3)
Here; i represents the observation for the related bank and t represents the years.
The advantages of conducting panel data regression analysis over cross-sectional data and time series data can be summarized as follows (Tari, 2014: 61):
Panel data analysis allows for controlling and measuring the differences by considering cross-sectional variations. By combining cross-sectional and times series data, the panel data provides more informative findings, less multicollinearity and more degree of freedom.
The panel data is much more proper to investigate the dynamics of change by dealing with repetitive cross-sectional observations.
Besides considering effects that do not change over time and are unobservable throughout the cross-section, the panel data analysis can also account for the possible effects of observable variations on the dependent variable.
The panel data analysis has an advantage over time series and cross-sectional data analysis as it allows for working with more sophisticated models.
4. Findings
Descriptive statistics can be seen in Table 3. According to the considered variables, the mean ROA of the sample is 0.016, the mean ROE is 0.147 while the mean EPS is 0.183 meaning that the industry can get lower return compared to
the total assets. On the other hand, considering the independent variables capadeq, structure and leverage, the mean values of 0.183, 0.112 and 0.888 are observed respectively along with the standard deviations of 0.045, 0.023 and 0.023.
Observations 121
Cross sections 11
ROA ROE EPS CAPADEQ STRUCTURE LEVERAGE
Mean 0.016019 0.146683 0.392861 0.183389 0.111604 0.888396
Maximum 0.034155 0.338744 2.274160 0.323498 0.219444 0.930696
Minimum -0.002557 -0.028857 -0.003200 0.098190 0.069304 0.780556 Std. Dev. 0.006748 0.061518 0.536786 0.044577 0.023026 0.023026
INFLATION INTEREST GROWTH SIZE QUALITY ASSETG
Mean 8.231818 8.828182 0.127639 17.69694 0.989339 0.203604
Maximum 10.45000 16.50000 0.295941 19.74000 1.830000 0.820109
Minimum 6.160000 3.810000 -0.009478 14.57000 0.430000 -0.277678 Std. Dev. 1.418866 4.685310 0.088198 1.363261 0.189670 0.122570
Table 3.Descriptive statistics
Correlation matrix for the independent variables is shown in Table 4. In order to avoid any multicollinearity issue, the variables with a correlation coefficient higher than 0.70 are omitted from the analysis. Therefore the independent variable “Leverage” is excluded as it has quite high correlation both with the variable Capadeq (-0.78818) and Structure (-1).
CapAdeq Structure Leverage Inflation Interest Growth Size Quality AssetG
CapAdeq 1
Structure 0,788179 1
Leverage -0,78818 -1 1
Inflation -0,16615 -0,2599 0,259903 1
Interest -0,04383 -0,01161 0,011611 0,480231 1
Growth -0,04896 -0,08792 0,087917 0,037256 -0,52582 1
Size -0,09217 -0,3498 0,349798 -0,05585 -0,28296 0,0845 1
Quality 0,402672 -0,00532 0,005325 -0,0164 -0,30347 0,095387 -0,02756 1
AssetG -0,31258 -0,40982 0,409815 0,252836 0,089612 0,276226 -0,12044 0,062442 1 Table 4.Pearson correlation coefficients
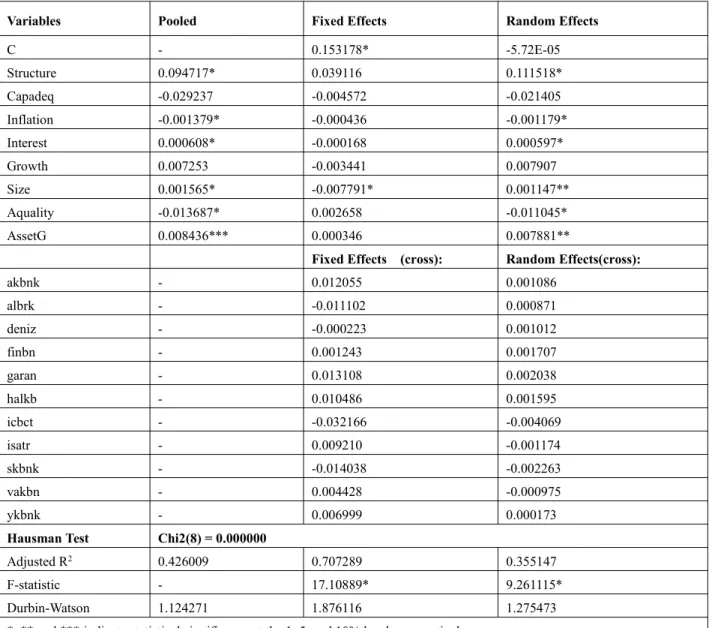
Table 5, Table 6 and Table 7 show the panel regression findings according to the pooled least squares, fixed effects, and random effects models, taking the ROA, ROE and EPS as dependent variables respectively. According to the Hausman test findings, random effects model is the appropriate one for the whole dependent variables.
According to the random effects model in Table 5, the variable of structure (0. 111518), has a statistically significant effect on the ROA meaning that an increase in the share of owner's equity in the total assets causes an increase in return over total assets. Amongst the control variables, all the variables but Growth have a statistically significant effect on the ROA. While the Assetg (0.007881) has the highest positive effect, A quality has the highest negative effect on the ROA. Therefore, as increases in the ratio of loan to deposits cause a decrease in the return on assets, increases in the growth in assets would cause the return on assets to increase as well. It is also seen that despite having less impact, inflation (-0.001179) is negatively related to the ROA whereas real interest rates (0.000597) are positively affecting the return on assets.
Variables Pooled Fixed Effects Random Effects
C - 0.153178* -5.72E-05
Structure 0.094717* 0.039116 0.111518*
Capadeq -0.029237 -0.004572 -0.021405
Inflation -0.001379* -0.000436 -0.001179*
Interest 0.000608* -0.000168 0.000597*
Growth 0.007253 -0.003441 0.007907
Size 0.001565* -0.007791* 0.001147**
Aquality -0.013687* 0.002658 -0.011045*
AssetG 0.008436*** 0.000346 0.007881**
Fixed Effects (cross): Random Effects(cross):
akbnk - 0.012055 0.001086
albrk - -0.011102 0.000871
deniz - -0.000223 0.001012
finbn - 0.001243 0.001707
garan - 0.013108 0.002038
halkb - 0.010486 0.001595
icbct - -0.032166 -0.004069
isatr - 0.009210 -0.001174
skbnk - -0.014038 -0.002263
vakbn - 0.004428 -0.000975
ykbnk - 0.006999 0.000173
Hausman Test Chi2(8) = 0.000000
Adjusted R2 0.426009 0.707289 0.355147
F-statistic - 17.10889* 9.261115*
Durbin-Watson 1.124271 1.876116 1.275473
*, ** and *** indicate statistical significance at the 1, 5, and 10% levels, respectively
Table 5.Relation between ROA and other variables (2006-2016)
Given the findings related to the determinants of the ROE, the effect of the structure (0.255359) is seen to be positive and the capadeq (-0.325335) is negative, yet they are both statistically insignificant. Aquality (-0.092296) has the highest significant negative effect on the ROE as well. Therefore, increases in the ratio of loan to deposits cause a decrease in the return on equity. Similar to the findings related to the ROA, inflation (-0.008812) is negatively related to the ROE and real interest rates (0.004953) are positively affecting the return on equity. Differently, growth in GDP also seems to have a significant effect on the ROE (Table 6).
Variables Pooled Fixed Effects Random Effects
C - 1.517473* 0.200991***
Structure 0.579978** -0.253520 0.255359
Capadeq -0.603990* -0.309041 -0.325335
Inflation -0.010884* -0.002755 -0.008812*
Interest 0.006296* -0.001584 0.004953*
Growth 0.093603 -0.021003 0.078923***
Size 0.016342* -0.071697* 0.004507
AssetG 0.055578 -0.024626 0.035118
Fixed Effects (cross): Random Effects(cross):
akbnk - 0.100863 0.006955
albrk - -0.110580 0.001131
deniz - 0.002214 0.014785
finbn - 0.005001 0.011549
garan - 0.125573 0.029096
halkb - 0.098011 0.024806
icbct - -0.271068 -0.040851
isatr - 0.087403 -0.008210
skbnk - -0.137847 -0.034408
vakbn - 0.035746 -0.009978
ykbnk - 0.064685 0.005126
Hausman Test Chi2(8) = 0.000000
Adjusted R2 0.471060 0.738780 0.305751
F-statistic - 19.85462* 7.606076*
Durbin-Watson 1.123938 1.871623 1.272970
*, ** and *** indicate statistical significance at the 1, 5, and 10% levels, respectively
Table 6.Relation between ROE and other variables (2006-2016)
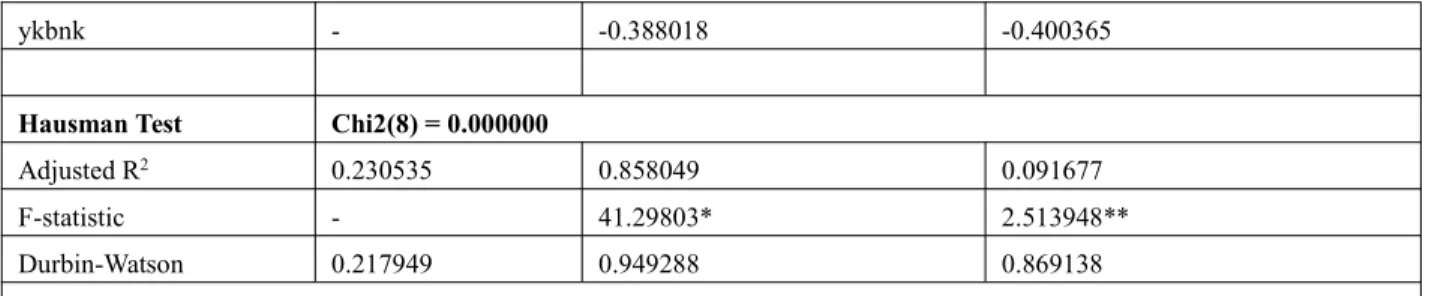
The relationship between the earnings per share and other variables is given in Table 7. According to Hausman test, random effects model is appropriate. Structure (4.283493) is seen to be positively affecting the EPS. Amongst the control variables, only the variable of aquality (0.550365) has a significant effect on the EPS. Therefore, as the share of
owner’s equity in the total assets and loan to deposit ratio increase, it is expected earnings per share to increase as well.
Variables Pooled Fixed Effects Random Effects
C - -0.529947 -0.885975
Structure 3.147819 3.984683 4.283493***
Capadeq -7.045321* -1.851342 -2.129534
Inflation -0.034959 0.005317 0.002603
Interest -0.003568 -0.005192 -0.003262
Growth -0.262977 -0.097016 -0.074077
Size 0.083078* 0.013439 0.036262
Aquality 0.174340 0.583648* 0.550365*
AssetG 0.223117 0.082521 0.107665
Fixed Effects (cross): Random Effects(cross):
akbnk - -0.365573 -0.381156
albrk - -0.095064 -0.074801
deniz - 0.533270 0.525330
finbn - -0.393882 -0.382903
garan - 0.463866 0.435132
halkb - 1.213061 1.169345
icbct - -0.506256 -0.421678
isatr - -0.327097 -0.342188
skbnk - -0.332107 -0.304039
ykbnk - -0.388018 -0.400365
Hausman Test Chi2(8) = 0.000000
Adjusted R2 0.230535 0.858049 0.091677
F-statistic - 41.29803* 2.513948**
Durbin-Watson 0.217949 0.949288 0.869138
*, ** and *** indicate statistical significance at the 1, 5, and 10% levels, respectively
Table 7.Relation between EPS and other variables (2006-2016)
5. Summary and Conclusions
When we examine the theory of finance, it is seen that three views on capital structure stand out; Modigliani and Miller, the trade-off theory and the pecking-order theory. While M&M caused the accepted views to be questioned till that day by putting forward that the capital structure decisions do not have an effect on the cost of capital and firm value in their studies, trade-off theory states that firms counterbalance the cost advantages and financial distress caused by the debt in taking decision for capital structure. Finally, the pecking-order theory argues that it is appropriate for the firms to select from internal and the most secure sources first regarding the capital structure decisions. The question of how much the decisions regarding capital structure are effective on the financial performance has become even more important today as a result of management’s limited freedom of capital structure decisions under the constraints caused by various cultural and legal regulations, limited accessibility to capital especially in the developing economies and the various financial turmoil and their visible destructive impact on the economy. Therefore, despite the fact that various capital structures of the firms are the result of either attaining an optimal level of capital structure or certain necessities, it is still an important issue how and whether changing combinations of debt and equity affect the firm performance.
This study aims to determine how capital structure affects the financial performance of banks since the Turkish Banking Industry constitutes nearly 80% of the financial system in terms of asset size. Hence it is reasonable to expect that any deviations in the sector would cause a domino effect on the financial markets and economy. Besides the tightened Basel regulations against the breakdowns or deficiencies in the financial system, regulations introduced after the 2001 crisis has restricted the capital structure decisions of the managers aiming for profit maximization in the Turkish banking sector. Accordingly, annual financial data of 11 banks traded at Borsa Istanbul are analyzed for the years of 2006-2016.
Findings indicate that capital structure (equity-to-asset ratio) affects all of the financial performance measures positively though it is insignificant only for the return on equity. Increase in the share of equity cause profitability increase as well. This may mean that the banks reached the limit of financing by debt and therefore the interest income of the institutions became lower than their interest expenses and financial leverage provides no more advantage. These
findings are compatible with those of Akhtaret al. (2016), Iheanyiet al. (2016) and Siddiket al.(2017). Also, it is seen
that the insignificant finding regarding return on equity is compatible with the approach of Modigliani and Miller arguing that the financial performance is independent of the capital mixture. These findings imply that the banks should find a way to low-cost debts or swap contracts that may eliminate interest rate risk and decrease costs. Increase in interest rates also seems to have a positive effect on the profitability. According to all these findings, in case of an expectation of an increase in interest rates, it would be proper for the banks to find long-term debt on the fixed interest rates and provide short-term loans on the variable interest rates in order to increase their profitability.
Another interesting finding is that the indicator of asset quality (loan-to-deposit) negatively affects both return on assets and return on equity while it positively affects earnings per share. The findings related to ROA and ROE can be another proof that the financial leverage is no more advantageous for the banks. On the other hand, findings related to EPS leads to avoiding certain judgments.
Growth in GDP also affects positively ROA (insignificant) and ROE (significant at 10%). This is also a reasonable finding as business volume increases in a developing economy. Finally, it is also seen that the inflation negatively affects profitability. Therefore it would be proper for the banks to turn towards more debt than equity while considering the current tax implications and aforementioned evaluations.
References
1. Abbadi SM., Nour Abu-Rub. The effect of capital structure on the performance of Palestinian financial institutions. British Journal of Economics, Finance and Management Sciences 2012; 3(2): 92-101.
2. Akguc O. Finansal Yonetim, Yenilenmis 7. Baski, Avciol Basim-Yayin, Istanbul, 1998.
3. Akhtar N, Bano M, Bano S,et al. Capital structure impact on banking sector performance in Pakistan. International
Review of Management and Business Research 2016; 5(2), 519-535.
4. Banking Regulation and Supervision Agency, “Statistics”, Available from: http://www.bddk.org.tr/, 13.11.2017. 5. Banking Regulation and Supervision Agency, “Turk Bankacilik Sektoru Temel Gostergeleri Eylul 2017”, Available
from: https://www.bddk.org.tr/WebSitesi/turkce/Raporlar/TBSGG/16430tbs_temel_gostergeler_doc_turkce.pdf, 10.12.2017.
6. Berger AN., Emilia Bonaccorsi di Patti. Capital structure and firm performance: a new approach to testing agency theory and an application to the banking industry. Journal of Banking and Finance 2006; 30: 1065-1102.
7. Central Bank of the Republic of Turkey, “Statistics”, Available from: http://www.tcmb.gov.tr/wps/wcm/connect/tcmb+tr/tcmb+tr, 13.11.2017.
8. Gursoy CT. Finansal Yonetimin İlkeleri, 2. Baski, Beta Yayincilik, Istanbul, 2012.
9. Hailu A. The Impact of Capital Structure on Profitability of Commercial Banks in Ethiopia, Master Thesis, Addis Ababa University, College of Business and Economics, Ethiopia, 2015.
10. Iheanyi IH. Iwo sotonye and ebiware adekitanke ejiodamen. Impact of capital structure on the performance of deposit money banks (a study of selected deposit money banks in Nigeria). International Journal of Economics and Business Management 2016; 2(7): 23-34.
11. Modigliani F, Miller MH. The cost of capital, corporation finance and the theory of investment. The American Economic Review 1958; 48(3): 261-297.
12. Nikoo SF. Impact of capital structure on banking performance: evidence from Tehran stock exchange. International Research Journal of Applied and Basic Sciences 2015; 9(6): 923-927.
13. Njeri MMK., Kagiri AW. Effect of capital structure on financial performance of banking institutions listed in Nairobi securities exchange. International Journal of Science and Research 2013; 4(7), 924-930.
14. Pratomo WA., Ismail AG (2006). Islamic bank performance and capital structure. MPRA Paper No: 6012, Available from: https://mpra.ub.uni-muenchen.de/6012/1/MPRA_paper_6012.pdf, 13.11.2017.
15. Ross SA., Westerfield RW., Jaffe J. Corporate Finance, Eight Edition, McGraw-Hill Irwin, New York, USA, 2008. 16. Siddik Md. Nur Alam, Kabiraj S, Joghee S. Impacts of capital structure on performance of banks in a developing
economy: evidence from Bangladesh. International Journal of Financial Studies 2017; 5(13): 1-18. 17. Tari R. Ekonometri, Gozden Gecirilmis 9. Baski, Umuttepe Yayinlari, Kocaeli, 2014.