Abstract
Introduction The aim was to identify the association of iron status with educational performance and intelligence of adolescents.
Method This was a cross sectional comparative study among adolescents aged 13-15 years. Each iron deficient student was matched with an iron sufficient student from the same school, class and sex. Iron status was based on haemoglobin and serum ferritin levels. The marks for mathematics, science, Sinhala language and social science were considered to assess educational performance. Intelligence was measured by Raven's Standard progressive matrices. All the possible confounders and effect modifiers were considered. Home visits to a sub-sample checked the quality of data.
Results The final analysis included 188 students (94 matched pairs). Neither educational performance nor intelligence showed significant associations with the iron status. The severity of the iron deficiency did not relate to these cognitive variables either. Twenty-three and 8 co-variables showed statistically significant associations with educational performance and intelligence respectively. Following a multiple regression analysis intelligence, the enthusiasm of the student towards learning, occupational ambition, household possession, problems at home and private tuition for mathematics were key factors predicting educational performance. Stunting and educational level of the mother were important factors influencing intelligence.
Conclusion Iron status does not play a major role in educational performance and intelligence of school going adolescents. Several factors affect educational performance and intelligence. This study highlights the difficulty in extrapolating the findings of similar studies to different ecological settings.
Introduction
Many studies have been carried out to find the association between iron deficiency and cognitive functions in infants and children. There have been studies with controversial conclusions. The generalisability of these research findings to other ecological settings is doubtful. No study has been done in Sri Lanka to find the relationship between iron status and cognitive functions.
The association of iron status with educational performance and
intelligence among adolescents
D S Dissanayake1, P V R Kumarasiri1, D B Nugegoda1and D M Dissanayake2
(Index words: iron status, anaemia, school performance, IQ)
1Departments of Community Medicine and 2Pathology, Faculty of Medicine, University of Peradeniya, Sri Lanka. Correspondence: DSD, e-mail <[email protected]>. Received 15 October 2008 and revised version accepted 7 March 2009. Competing interests: none declared.
Adolescents are a group prone to iron deficiency. Since iron deficiency is correctable, establishing its association with cognitive functions is important. This study was a cross sectional comparative study to determine the association of iron deficiency with educational performance and intelligence among a group of Sri Lankan adolescents.
Methods
The study included a sample of students who participated in a community based investigation that established the prevalence and determinants of iron deficiency among 13-15-year old adolescents (n=960) in the Kandy district [1]. The sample (n=200) included only Sinhalese students. They were from 14 different schools. The haemoglobin level (Hb) was determined by the indirect cyanmethhaemoglobin method, the method considered as the gold standard. The serum ferritin level (SF) [2] was determined by an enzyme linked immuno assay (ELISA). From iron deficient students (SF 12 g/l with a normal or low Hb level), 100 were randomly selected. Each selected iron deficient student was matched with an iron sufficient student from the same school, same class and of the same sex. The procedure of matching controlled many factors that could have possible confounding effects since these pairs would have experienced similar inputs by teachers, and have similar socio-economic backgrounds and other facilities at school. Students with borderline iron stores (SF level of 13-30 g/l) were excluded to minimise the chance of an overlap between iron deficient and iron sufficient groups. All the iron sufficient students had a Hb>12 g/dl and SF>30 g/l. Of the iron deficient students, some suffered from iron deficiency anaemia (Hb12 g/dl and SF12 g/l) while others had iron deficiency without anaemia (Hb>12 g/dl and SF12 g/l).
and validity is considered to be one of the best tools to measure general intelligence [3, 4]. Since the objective of this study was to compare intelligence between 2 groups rather than assessing the intelligence quotient at an individual level, raw scores were used in the analysis.
An interviewer administered questionnaire was used to collect details of factors that could be modifiers or confounders. The principal investigator and 4 other medical doctors collected data. Students as well as class teachers were interviewed. The weight and height were measured to assess protein energy status. In 25% of the sample (23 iron sufficient and 23 iron deficient), serum zinc and free thyroxin (free T4) were measured to determine whether these could be confounders to the relationship between iron status and cognitive functions. Serum zinc levels were analysed by atomic absorption spectrometry and free T4 levels by radio immuno assay (coated bead RIA). Cutoff levels of 700 g/l and 10 pmol/l were taken to define zinc deficiency and T4 deficiency level respectively. Home visits were carried out in a randomly selected sub sample (n=45) to check the quality of data and to observe the influence of the home environment on educational performance and intelligence. All homes were visited by the principal investigator to prevent inter observer variation. Ethical approval for this study was granted by the Committee on Research and Higher Degrees, Faculty of Medicine, Peradeniya.
Results
The final sample studied consisted of 188 students (94 matched pairs), 124 were girls. Of the 94 iron deficient students, 58 had iron deficiency anaemia (IDA) while 36 had iron deficiency without anaemia (ID without A).
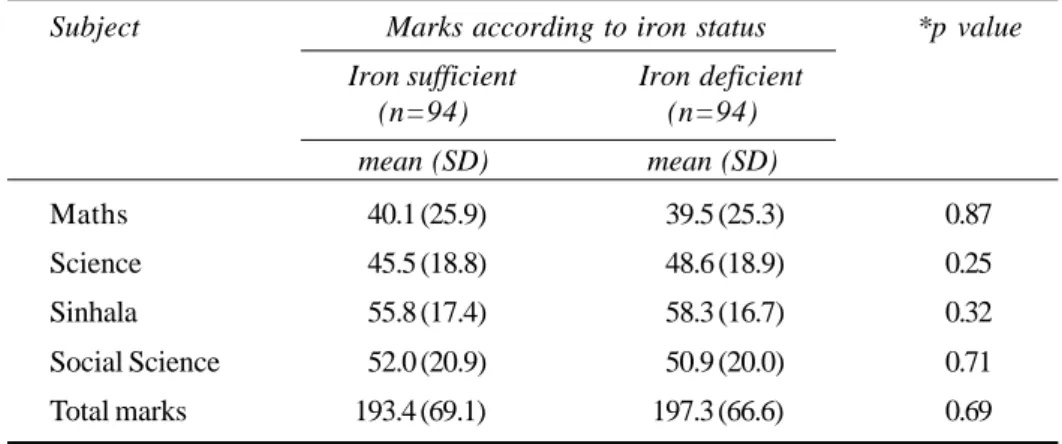
All comparisons were carried out between matched groups. The examination marks obtained by iron sufficient students for individual subjects were not significantly different from those of iron deficient students (Table 1).
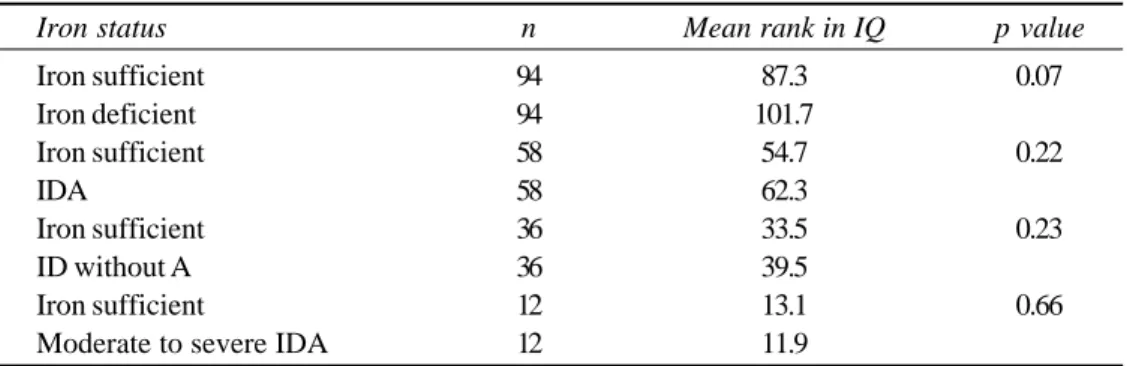
The total marks obtained for all 4 subjects by iron sufficient group were also not significantly different from those of the iron deficient group (Table 1). Further analysis was carried out to find whether the severity of iron deficiency has an effect on educational performance. Marks obtained by students with IDA, ID without A, and students with moderate to severe IDA (low SF and Hb<10 g/dl) were compared with marks of matched iron sufficient students. No significant differences in educational performance were observed between groups (Table 2).
Of the co-variables considered, 23 variables showed statistically significant associations with educational performance (Table 3). Controlling for the effects of these associations by linear regression analysis could not elicit a significant relationship between iron status and educational performance. The final model of the multiple regression analysis identified intelligence (p=0.007), enthusiasm paid by the student towards education (p< 0.001), occupational ambition of the student (p=0.004), the score obtained for household possessions (p=0.007) and obtaining private tuition for mathematics (p=0.01) as having significant positive associations with educational performance. A significant negative association was noted between educational performance and problems at home (p< 0.001).
No significant relationship was observed between intelligence and iron status (Table 3). Severity of iron deficiency was also not associated with IQ (Table 4). Eight co-variables were significantly associated with intelligence (Table 5). Following a linear regression analysis, the educational level of the mother showed a strong positive association with intelligence (p=0.001). Stunted children (having a height below 2 standard deviations for their age and sex) had a significantly lower intelligence (p=0.001). Nevertheless, multiple regression analysis could not elicit a significant association between iron status and intelligence.
Subject Marks according to iron status *p value
Iron sufficient Iron deficient
(n=94) (n=94)
mean (SD) mean (SD)
Maths 40.1 (25.9) 39.5 (25.3) 0.87
Science 45.5 (18.8) 48.6 (18.9) 0.25
Sinhala 55.8 (17.4) 58.3 (16.7) 0.32
Social Science 52.0 (20.9) 50.9 (20.0) 0.71
Total marks 193.4 (69.1) 197.3 (66.6) 0.69
Table 1. Educational performance of iron sufficient and iron deficient students.
The reliability of the Hb measurement (r=0.74; p<0.001) and SF measurement (r=0.91; p<0.001) was high. Of the sub sample of 46, only 6 (13%) had zinc deficiency. Of iron deficient subjects, 17.4% had concurrent zinc deficiency. Among iron sufficient subjects, only 8.7% had zinc deficiency. The difference between proportions was not significant (p=0.38). Neither educational performance (p=0.46) nor intelligence (p=0.68) of the students showed a significant association with their zinc status. Only 4 students had low free T4 levels. Of them, 3 were iron deficient. As only 4 students had low thyroxin levels, further analysis was not possible.
Data collected had high validity (sensitivity 68-100%) and good reliability (Kappa co-efficient 0.67-0.71). During home visits, the ambition of the parents to educate their child, space in the house and the accessibility to the house showed significant positive associations with educational performance. However, none of the factors in the home environment showed a relationship with the intelligence of the students.
Discussion
According to the findings of our study, it is unlikely that current iron status of adolescents would influence either their educational performance or intelligence.
A clinical trial conducted in Indonesia had shown that educational performance of students having IDA (n= 78) was significantly lower than that of students who were non-anaemic and iron sufficient (n=41) [5]. The study did not find an association between iron status and intelligence. Another trial in Thailand had assessed the impact of iron treatment on intelligence and educational attainment of 9-11 year old children [6]. Though no relationship had been observed between iron status and scores obtained for mathematics, both intelligence and Thai language scores showed significant positive associations with iron status. However, there was no evidence to prove that the association was causal [6]. Though the present study excluded students with diseases that could have influenced the indicators of iron status, both the Indonesian and Thai studies have failed to do so. In addition, the study in Thailand did not exclude students with borderline iron status. Further, the authors have admitted inadequate control for other factors as a shortcoming of their methodology. Both the above studies as well as the current study considered only marks of one test to assess educational performance. This is a limitation of these studies.
A randomised controlled trial among 98 non-anaemic iron deficient adolescent girls has shown that iron supplementation improved verbal learning and memory [7]. In England, results of an interventional study which examined the effect of iron supplementation on intelligence were not in favour of a causal relationship between the two [8].
Subject
Marks according to iron status
Iron sufficient ID A p value Iron sufficient ID without A p value Iron sufficient Moderate to p value (n=58) (n=58) (n=36) (n=36) (n=12)
severe IDA (n=12)
mean (SD) mean (SD) mean (SD) mean (SD) mean (SD) mean (SD) Maths 43.8 (25.9) 43.0 (26.9) 0.87 34.1 (25.1) 33.7 (21.8) 0.95 35.6 (29.2) 38.2 (26.2) 0.83 Science 46.1 (19.4) 48.8 (20.5) 0.46 44.5 (17.9) 48.4 (16.4) 0.34 48.3 (20.6) 54.3 (18.2) 0.46 Sinhala 55.9 (16.6) 57.6 (17.0) 0.59 55.7 (18.7) 59.4 (16.2) 0.36 56.9 (15.3) 61.2 (11.6) 0.44 Social Science 52.3 (21.5) 50.8 (21.8) 0.70 51.6 (20.1) 51.1 (17.0) 0.92 48.0 (23.6) 56.8 (20.5) 0.34 T otal Marks 198.1 (70.6) 200.2 (71.7) 0.87 185.8 (66.9) 192.7 (58.0) 0.64 188.9 (77.4) 210.6 (63.9) 0.46 T able 2.
Educational performance between iron sufficient students and students with different degrees of iron deficiency
t test used to determine the significance of difference IDA (iron deficiency anaemia) ID without
A
Factors associated with educational performance
Factor p value
Father's education *<0.001
Mother's education *<0.001
Father's occupation *<0.001
Mother's occupation *<0.001
Possession of household items *<0.001 Availability of a television **0.04
Distance to school *<0.001
Availability of electricity **0.07 Availability of a place to study **<0.001 Number of siblings in the family *0.39
Position among siblings *0.73
Mother's presence at home **0.02
Private tuition for mathematics **0.005 Private tuition for science **<0.001 Extra curricular activities **0.13 Time spent for extra curricular activities
(hours per week after school) *0.6
Educational ambition *<0.001
Occupational ambition *<0.001
Enthusiasm for studies
(according to the student) **0.001 Enthusiasm for studies (teacher's opinion) *<0.001
Hours spent on studies *<0.001
Interest paid by the family/
Guardian on student's education *0.001 Ability to concentrate on studies *0.04 Problems at home (according to student) *0.007 Problems at home (according to teacher) **<0.001
Love affairs **0.71
Personal problems **0.51
Mental status **0.66
School attendance *0.03
Height **0.04
Weight **0.06
Goitre **0.25
Intelligence ***<0.001
Factors associated with intelligence
Factor p value
Father's education +<0.001
Mother's education +<0.001
Father's occupation +<0.001
Mother's occupation +<0.001
Availability of a television ++0.21 Number of siblings in the family +0.53
Position among siblings +0.42
Mother's presence at home ++0.04
Extra curricular activities ++0.86 Interest paid by the family/
Guardian on student's education +0.08 Ability to concentrate on studies +0.87 Problems at home (according to student) +0.13 Problems at home (according to teacher) ++0.005
Height ++0.005
Weight ++0.007
Table 3. Factors associated with educational performance and intelligence
Iron status n Mean rank in IQ p value
Iron sufficient 94 87.3 0.07
Iron deficient 94 101.7
Iron sufficient 58 54.7 0.22
IDA 58 62.3
Iron sufficient 36 33.5 0.23
ID without A 36 39.5
Iron sufficient 12 13.1 0.66
Moderate to severe IDA 12 11.9
Table 4. Distribution in IQ among iron sufficient and iron deficient students
*Mann-Whitney U test used to determine the significance of difference * F test, ** t test, *** Spearman's correlation coefficient test
Zinc deficiency and iodine deficiency could co-exist with iron deficiency [9, 10]. Further, deficiency in zinc and iodine may influence cognitive functions [11, 12]. In spite of the very high prevalence of zinc deficiency expected among South Asian children [13], only 13% were deficient in zinc in the present study. Only 4 students in the sub sample showed a low free T4 level which is the best indicator reflecting the effect of iodine deficiency on brain function [14]. According to our findings, it is unlikely that the zinc level and the free T4 level would have been confounders in assessing the relationship between iron status and cognitive functions.
Our study showed a number of factors that could affect educational performance and intelligence of Sri Lankan adolescents. There could have been even more undetected factors. This indicates the difficulty to control or explain the effects of all co-variables in a study assessing the relationship between iron status and cognitive functions. Also, the study highlights the difficulty in generalising the findings of one ecological setting to another.
Acknowledgements
We thank doctors I. Herath, M. Balasooriya, S. Herath, S. Ratnayake and Mr. K. M. C. U. Champika for their help in collecting data. The help received from Miss C. Wijayasiri in processing data is appreciated. This work was supported by a grant from the University of Peradeniya (RG/2003/C-1/10/M).
References
1. Dissanayake DS, Kumarasiri PVR, Nugegoda DB, Dissanayake DM. Iron status and associated factors among adolescents in the Kandy district. Journal of the Community Physicians of Sri Lanka 2006; 11: 18-24.
2. Cook JD, Skikne BS. Iron deficiency: definition and diagnosis. Journal of Internal Medicine 1989; 226: 349-55.
3. Barney S. Raven Progressive Matrices. Available from: www.li.suu.edu/library/circulation/Barney/psy.
4. Raven Standard Progressive Matrices. Available from: www.cps.nova.edu/~cpphelp/RSPM.html.
5. Soemantri AG, Pollitt E, Kim I. Iron deficiency anaemia and educational achievement. American Journal of Clinical Nutrition 1985; 42: 1221-8.
6. Pollitt E, Hathirat P, Kotchabhakdi NJ, et al. Iron deficiency and educational achievement in Thailand. American Journal of Clinical Nutrition 1989; 50: 687-97.
7. Bruner AB, Joffe A, Duggan AK, et al. Randomised study of cognitive effects on iron supplementation in non-anaemic iron-deficient adolescent girls. Lancet 1996; 348: 992-6.
8. Lynn R, Harland EP. A positive effect of iron supplementation on the IQs of iron deficient children. Personality and Individual Differences 1998; 24: 883-5.
9. Sanstead H. Causes of iron and zinc deficiencies and their effects on brain. Journal of Nutrition 2000; 130: 347s-9s.
10. Zimmerman M, Adou P, Torresani T, et al. Persistence of goiter despite oral iodine supplementation in goitrous children with iron deficiency anaemia in Cote de Ivoire. American Journal of Clinical Nutrition 2000; 71: 88-93.
11. Penland JG. Behavioural data and methodology issues in studies of zinc nutrition in humans. Journal of Nutrition 2000; 130: 361s-364s.
12. United Nations Administrative Committee on Cordination/ Sub Committee on nutrition (ACC/SCN). Allen LH, Gillepsie SR. What works? A review of the efficacy and effectiveness of nutrition interventions. ACC/SCN: Asian Development Bank 2001: 43-54.
13. Brown KH, Wuehler SE, Peerson JM. The importance of zinc in human nutrition and estimation of the global prevalence of zinc deficiency. Food and Nutrition Bulletin 2001; 22: 113-25.