R E S E A R C H
Open Access
The effect of dicarbonyl stress on the
development of kidney dysfunction in
metabolic syndrome
–
a transcriptomic and
proteomic approach
Irena Markova
1, Martina Hüttl
1, Olena Oliyarnyk
1, Tereza Kacerova
2, Martin Haluzik
1, Petr Kacer
3, Ondrej Seda
4and
Hana Malinska
1*Abstract
Background and aims:Dicarbonyl stress plays an important role in the pathogenesis of microvascular complications that precede the formation of advanced glycation end products, and contributes to the development of renal dysfunction. In renal cells, toxic metabolites like methylglyoxal lead to mitochondrial dysfunction and protein structure modifications.
In our study, we investigated the effect of methylglyoxal on metabolic, transcriptomic, metabolomic and proteomic profiles in the context of the development of kidney impairment in the model of metabolic syndrome.
Materials and methods:Dicarbonyl stress was induced by intragastric administration of methylglyoxal (0.5 mg/kg bw for 4 weeks) in a strain of hereditary hypertriglyceridaemic rats with insulin resistance and fatty liver.
Results:Methylglyoxal administration aggravated glucose intolerance (AUC0–120 p< 0.05), and increased plasma glucose (p< 0.01) and insulin (p < 0.05). Compared to controls, methylglyoxal-treated rats exhibited microalbuminuria (p< 0.01). Targeted proteomic analysis revealed increases in urinary secretion of pro-inflammatory parameters (MCP-1, IL-6, IL-8), specific collagen IV fragments and extracellular matrix proteins. Urine metabolomic biomarkers in methylglyoxal-treated rats were mainly associated with impairment of membrane phospholipids (8-isoprostane, 4-hydroxynonenal).
Decreased levels of glutathione (p < 0.01) together with diminished activity of glutathione-dependent antioxidant enzymes contributed to oxidative and dicarbonyl stress. Methylglyoxal administration elevated glyoxalase 1 expression (p< 0.05), involved in methylglyoxal degradation. Based on comparative
transcriptomic analysis of the kidney cortex, 96 genes were identified as differentially expressed (FDR < 0.05). Network analysis revealed an over-representation of genes related to oxidative stress and pro-inflammatory signalling pathways as well as an inhibition of angiogenesis suggesting its contribution to renal fibrosis. Conclusion: Our results support the hypothesis that dicarbonyl stress plays a key role in renal microvascular complications. At the transcriptome level, methylglyoxal activated oxidative and pro-inflammatory pathways and inhibited angiogenesis. These effects were further supported by the results of urinary proteomic and metabolomic analyses.
Keywords: Metabolic syndrome, Methylglyoxal, Kidney dysfunction, Transcriptomics, Proteomics,
Metabolomics, Microvascular complications
© The Author(s). 2019Open AccessThis article is distributed under the terms of the Creative Commons Attribution 4.0 International License (http://creativecommons.org/licenses/by/4.0/), which permits unrestricted use, distribution, and reproduction in any medium, provided you give appropriate credit to the original author(s) and the source, provide a link to the Creative Commons license, and indicate if changes were made. The Creative Commons Public Domain Dedication waiver (http://creativecommons.org/publicdomain/zero/1.0/) applies to the data made available in this article, unless otherwise stated.
* Correspondence:[email protected]
1Centre for Experimental Medicine, Institute for Clinical and Experimental Medicine, Prague, Czech Republic
Introduction
Diabetic nephropathy (diabetic kidney disease) is a major chronic microvascular complication of diabetes which is characterised by a progressive increase in albuminuria and a decline in the glomerular filtration rate. Although hyperglycaemia represents an import-ant risk factor in the development of microvascular complications in the kidney, intensive glycaemic con-trol as a sole therapeutic solution is insufficient to prevent these complications [1].
According to recent studies, dicarbonyl stress plays an important role in the pathogenesis of microvascular renal complications that precede the formation of advanced glycation end products (AGEs) [2].
Dicarbonyl stress occurs as a consequence of the im-balance between the generation of reactive dicarbonyls (like methylglyoxal) and their metabolism via the glyoxa-lase system. The accumulation of dicarbonyls and im-paired glyoxalase 1 function may be involved in complications of vascular dysfunction, especially at a microvascular level, and both are associated with micro-vascular complications in the kidney.
The recently published clinical study ADDITION-DK [3] supports the role of methylglyoxal in the pathogenesis of renal microvascular complications and methylglyoxal (MGO) was found to be associ-ated with detrimental changes in kidney function in individuals with type 2 diabetes (T2D).
Excessive generation of dicarbonyls activates inflam-matory processes, increases oxidative stress, impairs glucose tolerance, and leads to AGE production. In a study of American Indians with type 2 diabetes, AGEs derived from MGO (carboxyethyl lysine and methyl-glyoxal hydroimidazolone) improved the accuracy of predicting renal function loss over traditional renal risk factors and correlated with the severity of dia-betic kidney disease [4].
In renal cells, MGO directly inhibits the electron re-spiratory chain (leading to mitochondrial dysfunction) and modifies protein structure which in turn may affect their function. Indirectly, MGO can also disturb differ-ent signalling pathways associated with vascular compli-cations [5]. However, the exact pathophysiological mechanisms underlying the detrimental effects of MGO on the kidney remain elusive.
Assessing global gene expression changes in the kidney and identifying urine proteomic and metabolomic bio-markers can help to elucidate the development of these complications and determine early risk markers.
In this study, we investigated the effect of MGO on metabolic, transcriptomic and proteomic profiles in the context of the development of kidney impairment using an experimental model of metabolic syndrome, the hereditary hypertriglyceridaemic rat (HHTg).
Originating from Wistar rats, this strain exhibits dysli-pidaemia, insulin resistance, hyperinsulinaemia, fatty liver, oxidative stress and low-grade chronic inflamma-tion, and is accepted model of metabolic syndrome and prediabetes [6].
Methods Animals and diet
All experiments were performed in agreement with the Animal Protection Law of the Czech Republic (311/1997), which is in compliance with European Community Council recommendations (86/609/ECC) for the use of laboratory animals, and approved by the Ethics Committee of the Institute for Clinical and Experimental Medicine, Prague.
Male HHTg rats were fed a standard chow diet (23% proteins, 43% starch, 7% fat, 5% fibre and 1% vitamin and mineral mixture, Bonagro, Czech Republic) and were maintained under temperature (22 °C) and humid-ity-controlled conditions at a 12 h/12 h light-dark cycle. At all times, the animals had free access to food and water. The rats (5 months old) were divided into 2 group (8 animals in each group): MGO-treated group of HHTg rats - MGO (Sigma) was administered intragastrically 3 times a week at a dose of 0.5 mg/kg body weight (BW) for 4 weeks. In the control group, rats were intragastri-cally administered water for 4 weeks. At the beginning of the study, there were no differences in body weight, serum glucose and triglycerides between both groups of HHTg rats. At the end of experiment, animals were sacrificed by decapitation in a postprandial state. Ali-quots of serum and tissue samples were collected at − 80 °C for analyses.
Analytic methods & biochemical analysis
Serum levels of triglycerides, glucose, total cholesterol and FFA were measured using commercially available kits (Erba Lachema, Czech Republic & Roche Diagnos-tics, Germany). Serum insulin and adiponectin concen-trations were determined using the Rat Insulin ELISA kit (Mercodia AB, Sweden) and the Rat HMW Adipo-nectin ELISA kit (MyBioSource, USA), respectively.
For the oral glucose tolerance test (OGTT), blood glu-cose was determined after a gluglu-cose load (3 g of gluglu-cose/ kg BW) administered intragastrically after overnight fast-ing. Blood glucose concentrations were determined by analysing blood samples collected from the tail at 0, 30, 60, and 120 min after glucose loading. The area under the glycaemic curve (AUC) was calculated over a 120-min period.
The levels of reduced (GSH) and oxidised (GSSG) forms of glutathione were determined by high-performance li-quid chromatography with fluorescent detection using a HPLC diagnostic kit (Chromsystems, Germany).
Antioxidant enzyme activities were measured using commercially available kits (Sigma-Aldrich & Cayman Chemicals).
The level of albumin in urine was analysed using a high-performance liquid chromatography method with UV-VIS detection according to Contois et al. [7] and adjusted for creatinine concentration. Creatinine con-centration was determined by enzymatic creatinine assay kit (Roche Diagnostics).
Dicarbonyl stress parameters
Dicarbonyl concentrations were determined after derivati-sation with 1,2-diaminobenzene using a HPLC method with fluorescence detection according to Fleming and Bierhaus [8].
GLO1 activity was analysed using a method described by Arai [9]. Red blood cells were collected by centrifuga-tion of blood (EDTA) samples and washed 3 times with 0.01 M PBS (pH 7.4). Washed cells were lysed using cold deionised water. Haemoglobin concentrations were de-termined according to Drabkin’s assay (Sigma).
Transcriptome profiling and relative expression
Transcriptome assessment of the kidney cortex was performed using the GeneChip® Rat Gene 2.1 ST Array Strip on the Affymetrix Gene Atlas System (Thermo Fisher Scientific, Waltham, MA, USA). Total RNA was extracted from the kidney using phenol-chloro-form and purified using the RNeasy Mini kit (Qiagen, Valencia, USA). The quality and integrity of the total RNA were evaluated on the Agilent 2100 Bioanalyzer system (Agilent, Palo Alto, CA). Only samples sur-passing the minimum quality threshold (RIN > 8.0) were used for subsequent transcriptome assessment (n= 8 in each group). The whole procedure, including several phases of reverse transcription, was performed according to the protocol recommended by the manu-facturer. The microarray data were deposited in ArrayExpress database (www.ebi.ac.uk/arrayexpress) under accession number E-MTAB-7690.
Microarray results were validated by qPCR. Reverse transcription and quantitative real-time PCR analysis was performed using the TaqMan RNA-to-CT 1-Step
Kit, TaqMan Gene Expression Assay (Applied Biosys-tems, USA), and the ViiA™ 7 Real Time PCR System (Applied Biosystems, USA). Relative expression was determined after normalisation against β-actin as an in-ternal reference and calculated using the 2-ΔΔCtmethod.
Proteomic and metabolomic markers in urine
Urine markers of oxidative stress were analysed using a liquid chromatography/mass spectrometry system (triple quadrupole mass spectrometer with electrospray ionisation). To implement multimarker screening, we performed two types of analysis: the first to detect compounds containing amino groups and the second to detect compounds with aldehyde and carboxylic groups [10].
Urine protein candidate biomarkers were analysed using MALDI-TOF MS by prior immunomagnetic isola-tion. Custom-designed antibody microarrays were used to confirm MS data by comprising the relative content of different analytes in the samples.
Statistical and pathway analysis
All data were statistically evaluated using the unpaired Student’s t-test, while categorical variables were analysed using Fisher’s exact test (used statistical software Graph-Pad InStat 3.1). Statistical significance was defined asP< 0.05, with data expressed as mean ± SEM.
For transcriptome data, hybridisation and quality con-trol were evaluated using the Affymetrix Expression Console (Thermo Fisher Scientific, Waltham, MA, USA). Data were then normalised (Robust Multi-array Average, RMA); gene expressions were compared be-tween the MG-treated group and the control group using analysis of variance with multiple comparison ad-justment and the false discovery rate method (FDR < 0.05), as implemented in PARTEK Genomics Suite 6.6 (Partek Inc., St. Louis, MI, USA). Transcripts that were significantly differentially expressed by more than 1.2 fold between both groups (FDR<0.1) were processed for gene enrichment and network/pathway analysis using Ingenuity Pathway Analysis software (Qiagen Redwood City, Inc., Redwood City, CA, USA). Proteomic and metabolomic biomarkers were calculated using XLSTAT software (https://www.xlstat.com).
Results
Effect of methylglyoxal on metabolic parameters
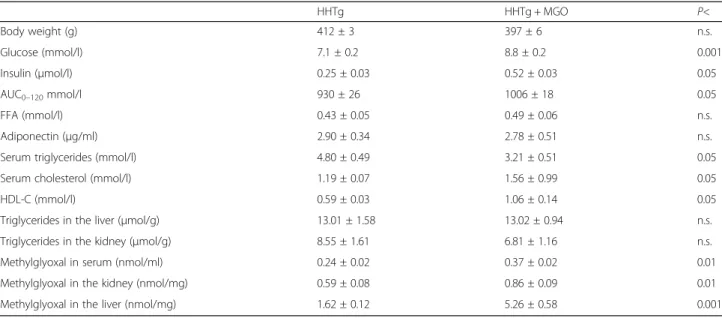
During the study, no differences in food and drink consumption between the experimental groups of rats were observed. Although MGO administration did not alter body weight, it aggravated glucose intolerance (AUC0–120) and increased fasting plasma glucose and
Effect of methylglyoxal on parameters of oxidative and dicarbonyl stress in the kidney
In MGO-treated rats, microalbuminuria was associated with decreased levels of reduced glutathione in the kid-ney cortex together with significantly decreased activity
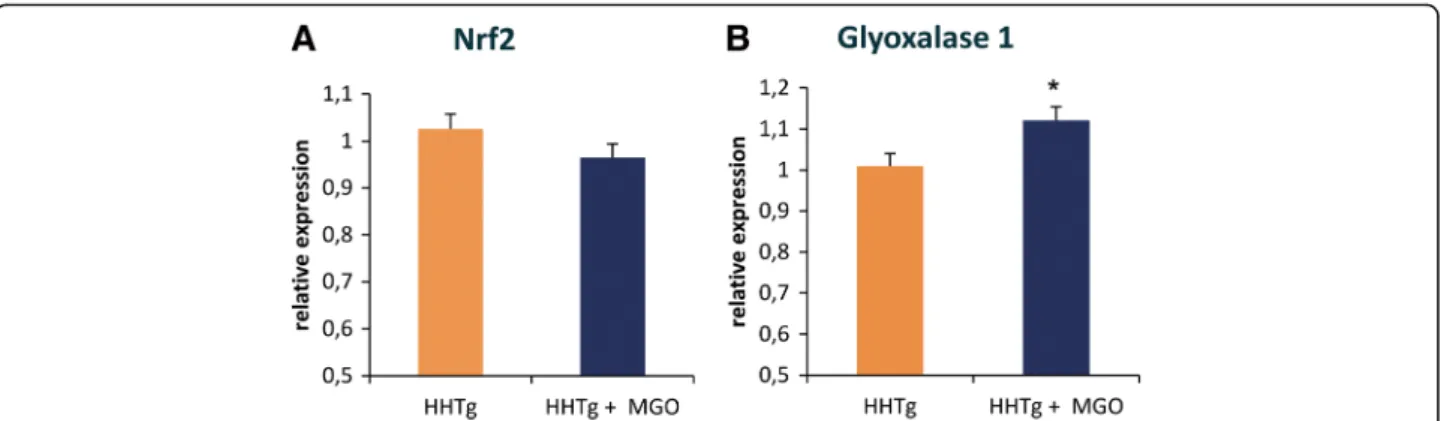
of glutathione-dependent antioxidant enzymes (glutathi-one reductase and glutathi(glutathi-one transferase) (Fig.1). How-ever, relative expression of transcriptional factor NRF2, which is involved in the antioxidant response, did not change (Fig. 2). MGO administration elevated gene
Table 1Metabolic parameters in serum and tissues in HHTg rats and after methylglyoxal administration (HHTg + MGO)
HHTg HHTg + MGO P<
Body weight (g) 412 ± 3 397 ± 6 n.s.
Glucose (mmol/l) 7.1 ± 0.2 8.8 ± 0.2 0.001
Insulin (μmol/l) 0.25 ± 0.03 0.52 ± 0.03 0.05
AUC0–120mmol/l 930 ± 26 1006 ± 18 0.05
FFA (mmol/l) 0.43 ± 0.05 0.49 ± 0.06 n.s.
Adiponectin (μg/ml) 2.90 ± 0.34 2.78 ± 0.51 n.s.
Serum triglycerides (mmol/l) 4.80 ± 0.49 3.21 ± 0.51 0.05
Serum cholesterol (mmol/l) 1.19 ± 0.07 1.56 ± 0.99 0.05
HDL-C (mmol/l) 0.59 ± 0.03 1.06 ± 0.14 0.05
Triglycerides in the liver (μmol/g) 13.01 ± 1.58 13.02 ± 0.94 n.s.
Triglycerides in the kidney (μmol/g) 8.55 ± 1.61 6.81 ± 1.16 n.s.
Methylglyoxal in serum (nmol/ml) 0.24 ± 0.02 0.37 ± 0.02 0.01
Methylglyoxal in the kidney (nmol/mg) 0.59 ± 0.08 0.86 ± 0.09 0.01
Methylglyoxal in the liver (nmol/mg) 1.62 ± 0.12 5.26 ± 0.58 0.001
Data are mean ± SEM;n= 8
expression of glyoxalase 1 (Fig. 2), which is involved in MGO degradation. There were no differences in glyoxa-lase 1 activity between both groups (data not shown).
Effect of methylglyoxal on the kidney transcriptome
Based on comparative transcriptomic analysis of the kidney cortex, 96 genes were identified as differentially expressed (FDR < 0.05) in methylglyoxal-treated rats compared to controls, with 54 relatively upregulated and 42 downregulated transcripts. Among the top upregulated genes in MGO-treated rats were nuclear receptor subfamily 1, group D, member 1 (NR1D1), insulin-like growth factor-binding protein 1 (IGFBP1) and D site of albumin promoter (albumin D-box)-binding protein (DBP). The top genes downregulated by MGO included ADAM metallopeptidase with thrombospondin type 1 motif, 1 (ADAMTS1), colla-gen, type VI, alpha 2 (COL6A2), and sterol regulatory element-binding transcription factor 1 (SREBF1). The complete set of differentially expressed transcripts is provided in ESM Table1.
Using all differentially expressed genes, we systematic-ally assessed their enrichment (in ontological categories or disease-related gene sets) and potential functional connections. As shown in Fig.3, significantly over-repre-sented canonical pathways reveal major activation of the TGF-β signalling pathway (p-value = 2.22E-03), a hall-mark of renal fibrosis. Other significantly enriched func-tional categories in the kidney after methylglyoxal were related to oxidative stress (NRF2-mediated signalling pathway, p-value = 4.58E-05), inflammation (LPS/IL-1-mediated pathway, p-value = 4.15E-05) and inhibition of angiogenesis (thrombospondin-1 signalling pathway, p -value = 1.59E-04).
Next, we aimed to identify upstream regulators poten-tially responsible for the MGO-induced transcriptomic shift and predict their activation or inhibition based on
gene expression changes in MGO-treated and control rats. Using an algorithm based on the expected causal effects between upstream regulators and their targets implemented in the Ingenuity Pathway Analysis soft-ware [11], five entities were predicted to be activated: acyl-CoA oxidase 1 (ACOX1, z-score 2.14, Fisher’s exact p= 1.76E-03) through its involvement in fatty acid oxidation and inflammation, LIM homeobox pro-tein 1 (LHX1, z-score 2.43, p= 5.40E-03) as a partici-pant in the proliferative response to kidney injury, cystic fibrosis transmembrane conductance regulator (CFTR, z-score 2.24, p= 9.06E-03), hepatocyte nuclear factor 1α (HNF1A, z-score 2.90, p= 9.28E-03), and X-box binding protein-1 activated by endoplasmic reticulum stress (XBP1, z-score 2.24, p= 1.62E-02). In contrast, only two regulators were predicted to be significantly inhibited: insulin 1 (INS1, z-score−2.62,
p= 2.34E-02) and enhancer of zeste 2 polycomb re-pressive complex 2 subunit (EZH2, z-score−2.22, p= 4.84E-02). Analysis of toxicity functions and toxicity lists, which link gene expression differences to clinical pathology endpoints, revealed particular enrichment in categories associated with the long-term renal in-jury pro-oxidative response panel and downregulation of genes involved in recovery from ischaemic acute renal failure (ESM Fig. 1). Network analysis revealed over-representation of genes participating in oxidative stress and pro-inflammatory signalling pathways, as well as inhibition of angiogenesis. Together, these data indicate the involvement of MGO in renal fibro-sis and the early phase of renal failure, which is sup-ported by the overall gene expression pattern we observed in upstream regulator-based networks.
Effect of methylglyoxal on urinary parameters
Compared to controls, MGO-treated rats exhibited sig-nificantly more pronounced microalbuminuria (Fig. 1)
Fig. 2Effect of MGO treatment on relative expression of nuclear factor NRF2 and the GLO1 enzyme in the kidney. Relative expression of nuclear factor, erythroid 2 like 2 (NRF2, Panela) and glyoxalase 1 (GLO1, Panelb) in the kidneys of MGO-treated vs. control male hereditary
and higher urine lactate levels (12.87 ± 0.90 vs 6.13 ± 0.15 mmol/ml, p< 0.05). Untargeted proteomic analysis identified 509 proteins, peptides and fragments (data not shown). As shown in Table 2, targeted proteomic ana-lysis revealed increases in urinary secretion of pro-in-flammatory parameters (MCP-1, IL-6, IL-8), specific collagen IV fragments (endostatin), α1-antitrypsin and extracellular matrix protein (heparan sulphate). How-ever, urinary secretion of endothelial growth factor (EGF) significantly reduced after MGO administration. Urine metabolomic biomarkers in MGO-treated rats were mainly associated with impairment of membrane phospholipids (MDA, 8-isoprostane, 4-hydroxynonenal). Metabolomic impairment parameters of DNA (8-hydro-xyguanosin), RNA (5-hydroxymethyluracyl), proteins and inflammatory parameters (leukotriene D4) were also identified in urine (Table 2). Altogether, 33 tested parameters of inflammation and oxidative stress were identified; only significantly changed markers are shown in Table2.
Discussion
MGO represents an important pathogenic factor in the development of renal microvascular complications in
T2D that precede AGE formation and the onset of hyperglycaemia. We previously reported [12] that dysli-pidaemia in hypertriglyceridaemic rats leads to elevated levels of MGO and MGO-derived AGEs in serum and tissues. Blood levels of AGEs, especially those derived from MGO, predict renal function loss and correlates with T2D in American Indians [4]. AGEs accumulate in glomeruli, where they increase gene expression of extra-cellular matrix type IV collagen and induce cross-linked protein formations.
MGO administration in our study has been shown to induce severe dicarbonyl stress comparable to levels in T2D patients with poorly controlled dia-betes. In our study, MGO aggravated glucose intoler-ance and increased insulin resistintoler-ance in the tissues of hypertriglyceridaemic rats, corroborating previous findings [13]. Although MGO administration had no effect on ectopic lipid deposition or body weight in the current study, MGO-treated HHTg rats exhibited changes in blood lipid profiles as serum triglycerides were decreased and total serum cholesterol was sig-nificantly increased. Similar findings have been re-ported in other experimental studies [14] and may be associated with the effect of MGO on the activity
of lipoprotein lipase rather than its influence on lipolysis.
The changes we observed were accompanied by down-regulation of sterol regulatory element-binding tran-scription factor 1 (SREBF1) and upregulation of the elongase of very long chain fatty acids 2 (ELOVL2), an enzyme involved in fatty acid synthesis, storage and oxidation [15].
In our study in hypertriglyceridaemic rats, MGO ag-gravated oxidative stress in the kidney, glutathione and glutathione-dependent antioxidant enzymes were signifi-cantly reduced. However, glutathione depletion in the kidney had no effect on GLO1 activity. Elevated relative expression of GLO1 in the kidney likely serves as a com-pensatory mechanism that protects renal cells against
the glycation by MGO and helps to sustain unchanged GLO1 activity in the kidney. Similar results with GLO1 expression have been observed in db/db diabetic mice [16]. GLO1 ensures MGO detoxification and that its expression remains under the control of transcription factor NRF2, which orchestrates the antioxidant re-sponse. Comparative expression analysis of the kidney cortex revealed activation of the NRF2 antioxidant response element signalling pathway (through upregu-lated JNK and MKK), although NRF2 expression itself did not significantly change. Oxidative stress may be one of the pathological mechanisms responsible for the dele-terious effect of MGO in microvascular complications in the kidney, thus promoting vascular kidney damage.
The importance of oxidative stress in the progression of diabetic kidney disease has been noted in a few other transcriptomic studies. However, they mainly focus on glomeruli, using either STZ-induced diabetic mice [17] with marked hyperglycaemia or in vitro models [18]. A study by Morrison et al. reported upregulation of several thiol antioxidant genes in rat mesangial cells treated with high glucose concentrations [19].
The oxidative stress response signalling pathway un-derlies fibrosis and vascular changes during diabetic nephropathy progression as well as genes linked to in-flammation and angiogenesis.
Canonical pathway enrichment showed the highest level of activation for the TGFβ signalling pathway, related to the development of renal fibrosis and ne-phropathy. TGFβ is a potent profibrotic cytokine present in several intracellular signalling pathways [20]. Our results pointed to MGO-induced activation of TGFβ pathway acting through the MAPK and Smad cascades in the kidneys of HHTg rats. TGFβ in kidney induces the production and secretion of extracellular matrix proteins [21].
TGFβ can also activate pro-inflammatory status, particularly in the presence of IL-6 [21] which may contribute to the progression of nephropathy. TGFβ accumulation in the kidney can play a critical role in elevating levels of microalbuminuria after MGO ad-ministration, by which TGFβ1 enhances glomerular permeability and attenuates tubular reabsorption of albumin. According to a recent meta-analysis [22], patients with T2D and nephropathy (n= 1,604) ex-hibited increased serum and urine TGFβ1 levels.
The TGFβ pathway represents a possible therapeutic target for renal fibrogenesis. Although TGFβ exerts fibrogenic and hypertrophic effects, doubt remains as to whether its suppression can prevent or treat nephropa-thy. Low TGFβexpression results in primary aldosteron-ism [23], while TGFβdeficiency in mice exacerbates the inflammatory response and tissue necrosis. Modulating GLO1 activity/expression represents another promising
Table 2Proteomic and metabolomic markers in urine
HHTg HHTg + MGO P< Proteomic markers
IL-6 (pg/ml) 44.33 ± 2.31 91.43 ± 5.88 0.001 IL-8 (pg/ml) 18.33 ± 0.29 49.43 ± 1.60 0.001 MCP-1 (ng/ml) 1.57 ± 0.02 3.76 ± 0.21 0.001 EGF(ng/ml) 4.95 ± 0.17 2.27 ± 0.01 0.001
α-1 antitrypsin (ng/ml) 13.90 ± 2.89 24.47 ± 2.11 0.001 IgA-uromodulin (ng/ml) 60.50 ± 5.20 68.71 ± 0.80 0.05 Tumstatin (pg/ml) 79.33 ± 1.15 68.00 ± 5.61 n.s. Endostatin (pg/ml) 71.50 ± 4.04 102.14 ± 5.08 0.01 Heparan sulphate (μg/ml) 0.09 ± 0.01 0.31 ± 0.01 0.05 Metabolomic markers
Malondialdehyde (ng/ml) 22.25 ± 0.61 31.40 ± 0.32 0.001 4-hydroxyhexenal (ng/ml) 14.77 ± 0.43 23.71 ± 0.76 0.001 4-hydroxynonenal (ng/ml) 23.93 ± 0.12 32.72 ± 0.55 0.001 Hexanal(ng/ml) 15.82 ± 0.52 20.30 ± 0.56 0.01
Heptanal (ng/ml) 22.68 ± 0.20 28.62 ± 1.12 0.01 Octanal (ng/ml) 10.07 ± 0.09 11.87 ± 0.40 0.001 Nonanal (ng/ml) 12.20 ± 0.17 14.96 ± 0.07 0.001 Decanal (ng/ml) 9.35 ± 0.23 11.34 ± 0.32 0.001 Dodecanal (ng/ml) 6.77 ± 0.35 7.39 ± 0.32 n.s. 8-isoprostane (pg/ml) 21.33 ± 0.29 29.09 ± 3.53 0.01 3-nitrotyrosine (pg/ml) 49.67 ± 0.01 71.60 ± 0.53 0.001 o-nitrotyrosine (pg/ml) 57.17 ± 1.15 77.36 ± 1.49 0.001 3-chlorotyrosine (pg/ml) 22.67 ± 2.02 35.54 ± 1.60 0.01 8-hydroxyguanosine (pg/ml) 198.00 ± 4.91 231.54 ± 3.69 0.05 5-hydroxymethyluracil (pg/ml) 93.00 ± 2.02 115.07 ± 13.76 0.05 Leukotriene B4(pg/ml) 48.17 ± 8.66 81.86 ± 28.86 n.s. Leukotriene C4(pg/ml) 64.17 ± 4.91 66.67 ± 0.53 n.s. Leukotriene D4(pg/ml) 53.83 ± 1.73 60.69 ± 1.64 0.05 Leukotriene E4(pg/ml) 119.17 ± 5.77 120.72 ± 0.12 n.s.
therapeutic approach. It has been shown that overex-pression of GLO1 in Glo1 transgenic mice prevented diabetes-induced MGO modification of glomerular pro-teins, increased oxidative stress, and the development of diabetic kidney disorders [24].
Transcriptome studies of human kidney biopsies in pa-tients with diabetic nephropathy have reported changes in gene expression profiles linked to inflammation and angiogenesis [25]. In our study, angiogenesis in the kidney at the transcription level was inhibited by upregulation of the signalling pathway through thrombospondin 1, an endogenous inhibitor of angiogenesis that also influences the structure of the extracellular matrix. TSP1 inhibits angiogenesis directly by inducing endothelial cell apop-tosis pathways (upregulated MAPK activates genes that lead to apoptosis), and indirectly activates TGFβ and in-hibits VEGF-activated pathways. Thus, upregulation of this signalling pathway inhibits angiogenesis, stimulates apoptosis and activates TGFβ secretion. Physiological angiogenesis is impaired by MGO through RAGE-medi-ated and VEGFR2 degradation in cell cultures [26].
According to our transcriptomic analysis, MGO in the kidney also activates the inflammatory pathways that promote secretion of the pro-inflammatory cytokines IL-1, IL-6, IL-12 and TNFα.
The secretion of pro-inflammatory cytokines found in urine may represent an important diagnostic biomarker for early development of diabetic kidney disease, with urinary IL-6, IL-10 and TNFαsecretion, in particular, re-ported to be the most sensitive cytokines for identifying renal disease in T2D patients [27].
Low chronic inflammation and abnormal production of pro-inflammatory cytokines are considered to play a significant role in a mechanism leading to the develop-ment and progression of diabetic kidney disease [28]. The inflammatory response is activated by metabolic and haemodynamic derangements in the diabetic kidney, occurring during the early stages of diabetes. Pro-inflam-matory cytokines modify the renal structure and perme-ability of the glomerular endothelium, alter the expression of diverse molecules, increase ROS produc-tion, and can also induce apoptosis or cell necrosis. IL-6 affects extracellular matrix dynamics, stimulates the pro-liferation of mesangial cells, increases fibronectin expres-sion, and enhances endothelial permeability [29].
Currently, the most reliable predictor of early kid-ney damage remains microalbuminuria. However, its predictive ability is limited in that not all diabetic pa-tients with nephropathy exhibit increased levels of urinary albumin [30].
With respect to stages of the disease and risk of progression, proteomic-based analyses reveal that the combination of several biomarkers may be a more accurate method, offering more specific diagnostic
and prognostic potential for determining early devel-opment of kidney failure than individual markers such as microalbuminuria.
One study investigated CKD273, a proteome-based classifier in patients with type 2 diabetes. Its risk score composition (patients at high and low risk) re-sults documented changes in extracellular matrix components, including collagen fragments and tubu-lar proteins, such as uromodulin, all early features of the disease [31].
Toward identifying a panel of biomarkers capable of predicting the progression of kidney failure in its early phases, a number of proteomic urine analyses of diabetic patients have been published. In uncom-plicated diabetes, one such proteomic analysis dem-onstrated that early activation of fibrotic pathways in the kidney occurs before the onset of microalbumi-nuria [32].
Some recent studies have earmarked the urinary secre-tion of IL-6 [27] and epidermal growth factor (EGF) [33] as useful sensitive markers. Urinary secretion of EGF as a marker of tubular mass in a cohort from the Edin-burgh Type 2 Diabetes Study was recently demonstrated to predict the decline of renal function independently of traditional risk factors and before the onset of microal-buminuria [34].
In contrast to blood, the urinary proteome is relatively stable. Urinary proteins mainly originate from kidney tis-sue (70%), with the remaining 30% deriving from plasma. Therefore, urine is the most reliable biomarker of renal disease and the vascular system. Proteomic studies suggest that MGO-induced changes in glomeru-lar permeability and tubuglomeru-lar reabsorption account for the proteins that appear in urine.
In our study of methylglyoxal administration, we observed activation of the profibrotic signalling pathway, the oxidative stress response, and pro-inflammatory path-ways. Urinary proteomic and metabolomic markers reliably reflected transcriptomic signalling in the kidney, which is associated with MGO-induced kidney damage.
Although some studies [30, 35] provide evidence that MGO acts as an important signal molecule and affects different signalling pathways mainly involved in vascular pathophysiology, to our best knowledge this is the first study on the effect of MGO to com-bine transcriptome analysis of the kidney with urin-ary proteomic and metabolomic biomarker profiling.
Conclusion
Our results endorse the hypothesis that dicarbonyl stress plays a key role in renal microvascular complications, and are consistent at transcriptomic, proteomic and metabolomic levels. In the kidney, MGO not only acti-vated profibrotic, proinflammatory pathways and the oxidative stress response, but inhibited angiogenesis at the transcriptomic level. These effects were further sup-ported by urinary proteomic and metabolomic analysis, which reflected the kidney gene expression changes we observed. Our approach may be potentially useful in identifying diabetic kidney disease at an early stage, monitoring the progression, and novel therapeutic strategies.
Abbreviations
AGEs:Advanced glycation end products; BW: Body weight; CML: Carboxymethyl lysine; FFA: Free fatty acids; GLO1: Glyoxalase 1; GSH: Reduced form of glutathione; GSSG: Oxidised form of glutathione; MCP-1: Monocyte chemoattractant protein-1; MDA: Malondialdehyde; MGO: Methylglyoxal; NRF2: Nuclear factor-erythroid 2-related factor-2; T2D: Type 2 diabetes; TG: Triglycerides; TGF-β: Transforming growth factorβ; TNF-α: Tumor necrosis factorα
Acknowledgements
We wish to thank Michael Fitzgerald for his extensive help with correcting the text.
Authors’contributions
HM and OS designed the experiment, analysed the data, and composed the manuscript. MH, IM, OO and TK analysed the data and reviewed/edited the manuscript. PK analysed and interpreted the data, contributed to the discussion and reviewed/edited the manuscript. MH designed the experiment, revised the manuscript and contributed to its critical revision. All authors revised the manuscript critically for intellectual content and approved the final version for publication.
Funding
This work was supported by the Ministry of Health of the Czech Republic under the conceptual development of research organisations programme (Institute for Clinical and Experimental Medicine–IKEM, IN 00023001 and RVO VFN64165, General University Hospital in Prague, Czech Republic) and by the Ministry of Education, Youth and Sports of the CR as part of LQ1604 National Sustainability Programme II (BIOCEV-FAR project) and the BIOCEV project (CZ.1.05/1.1.00/02.0109).
Availability of data and materials
The datasets used during the present study are available from the corresponding author upon reasonable request.
Ethics approval
All experiments were performed in agreement with the Animal Protection Law of the Czech Republic (311/1997), which is in compliance with European Community Council recommendations (86/609/ECC) for the use of laboratory animals, and approved by the Ethics Committee of the Institute for Clinical and Experimental Medicine, Prague.
Consent for publication Not applicable.
Competing interests
The authors declare that they have no competing interests.
Author details
1Centre for Experimental Medicine, Institute for Clinical and Experimental Medicine, Prague, Czech Republic.2Department of Chemistry, University College London, London, UK.3Czech University of Life Sciences, Prague,
Czech Republic.4Institute of Biology and Medical Genetics, First Faculty of Medicine, Charles University & General University Hospital in Prague, Prague, Czech Republic.
Received: 25 February 2019 Accepted: 19 July 2019
References
1. Groener JB, Oikonomou D, Cheko R, Kender Z, Zemva J. Kihm L, et al. Exp Clin Endocrinol Diabetes: Methylglyoxal and Advanced Glycation End Products in Patients with Diabetes - What We Know so Far and the Missing Links; 2017.
2. Rabbani N, Thornalley PJ. The critical role of methylglyoxal and glyoxalase 1 in diabetic nephropathy. Diabetes.2014;63:50–2.
3. Jensen TM, Vistisen D, Fleming T, Nawroth PP, Rossing P, Jorgensen ME, et al. Methylglyoxal is associated with changes in kidney function among individuals with screen-detected type 2 diabetes mellitus. Diabet Med. 2016;33:1625–31.
4. Saulnier PJ, Wheelock KM, Howell S, Weil EJ, Tanamas SK, Knowler WC, et al. Advanced Glycation End Products Predict Loss of Renal Function and Correlate With Lesions of Diabetic Kidney Disease in American Indians With Type 2. Diabetes. 2016;65:3744–53.
5. Nigro C, Leone A, Raciti GA, Longo M, Mirra P, Formisano P, et al. Methylglyoxal-glyoxalase 1 balance: the root of vascular damage. Int J Mol Sci. 2017;18:188.
6. Vrana A, Kazdova L. The hereditary hypertriglyceridemic nonobese rat: an experimental model of human hypertriglyceridemia. Transplant Proc. 1990;22:2579.
7. Contois JH, Hartigan C, Rao LV, Snyder LM, Thompson MJ. Analytical validation of an HPLC assay for urinary albumin. Clin Chim Acta. 2006;367:150–5.
8. Thornalley PJ, Langborg A, Minhas HS. Formation of glyoxal, methylglyoxal and 3-deoxyglucosone in the glycation of proteins by glucose. Biochem J. 1999;344(Pt 1):109–16.
9. Arai M, Nihonmatsu-Kikuchi N, Itokawa M, Rabbani N, Thornalley PJ. Measurement of glyoxalase activities. Biochem Soc Trans. 2014;42:491–4. 10. Neprasova M, Maixnerova D, Novak J, Reily C, Julian BA, Boron J, et al.
Toward noninvasive diagnosis of IgA nephropathy: a pilot urinary Metabolomic and proteomic study. Dis Markers. 2016;2016:3650909. 11. Kramer A, Green J, Pollard J Jr, Tugendreich S. Causal analysis approaches in
ingenuity pathway analysis. Bioinformatics.2014;30:523–30. 12. Malinska H, Skop V, Trnovska J, Markova I, Svoboda P, Kazdova L, et al.
Metformin attenuates myocardium dicarbonyl stress induced by chronic hypertriglyceridemia. Physiol Res. 2018;67:181–9.
13. Mey JT, Haus JM. Dicarbonyl stress and Glyoxalase-1 in skeletal muscle: implications for insulin resistance and type 2 diabetes. Front Cardiovasc Med. 2018;5:117.
14. Matafome P, Santos-Silva D, Crisostomo J, Rodrigues T, Rodrigues L, Sena CM, et al. Methylglyoxal causes structural and functional alterations in adipose tissue independently of obesity. Arch Physiol Biochem. 2012;118:58–68.
15. Pauter AM, Olsson P, Asadi A, Herslof B, Csikasz RI, Zadravec D, et al. Elovl2 ablation demonstrates that systemic DHA is endogenously produced and is essential for lipid homeostasis in mice. J Lipid Res. 2014;55:718–28. 16. Barati MT, Merchant ML, Kain AB, Jevans AW, McLeish KR, Klein JB.
Proteomic analysis defines altered cellular redox pathways and advanced glycation end-product metabolism in glomeruli of db/db diabetic mice. Am J Physiol Renal Physiol. 2007;293:F1157–65. 17. Wada J, Zhang H, Tsuchiyama Y, Hiragushi K, Hida K, Shikata K, et al. Gene
expression profile in streptozotocin-induced diabetic mice kidneys undergoing glomerulosclerosis. Kidney Int. 2001;59:1363–73.
18. Heinzel A, Muhlberger I, Stelzer G, Lancet D, Oberbauer R, Martin M, et al. Molecular disease presentation in diabetic nephropathy. Nephrol Dial Transplant. 2015;30(Suppl 4):iv17–25.
19. Morrison J, Knoll K, Hessner MJ, Liang M. Effect of high glucose on gene expression in mesangial cells: upregulation of the thiol pathway is an adaptational response. Physiol Genomics. 2004;17:271–82. 20. Vega G, Alarcon S, San MR. The cellular and signalling alterations
21. Sutariya B, Jhonsa D, Saraf MN. TGF-beta: the connecting link between nephropathy and fibrosis. Immunopharmacol Immunotoxicol. 2016;38:39–49.
22. Qiao YC, Chen YL, Pan YH, Ling W, Tian F, Zhang XX, et al. Changes of transforming growth factor beta 1 in patients with type 2 diabetes and diabetic nephropathy: A PRISMA-compliant systematic review and meta-analysis. Medicine (Baltimore). 2017;96:e6583.
23. Chang AS, Hathaway CK, Smithies O, Kakoki M. Transforming growth factor-beta1 and diabetic nephropathy. Am J Physiol Renal Physiol. 2016;310:F689–96.
24. Giacco F, Du X, D'Agati VD, Milne R, Sui G, Geoffrion M, et al. Knockdown of glyoxalase 1 mimics diabetic nephropathy in nondiabetic mice. Diabetes. 2014;63:291–9.
25. Woroniecka KI, Park AS, Mohtat D, Thomas DB, Pullman JM, Susztak K. Transcriptome analysis of human diabetic kidney disease. Diabetes. 2011;60:2354–69.
26. Liu H, Yu S, Zhang H, Xu J. Angiogenesis impairment in diabetes: role of methylglyoxal-induced receptor for advanced glycation
endproducts, autophagy and vascular endothelial growth factor receptor 2. PLoS One. 2012;7:e46720.
27. Sangoi MB, de Carvalho JA, Tatsch E, Hausen BS, Bollick YS, Londero SW, et al. Urinary inflammatory cytokines as indicators of kidney damage in type 2 diabetic patients. Clin Chim Acta. 2016;460:178–83.
28. Wong CK, Ho AW, Tong PC, Yeung CY, Kong AP, Lun SW, et al. Aberrant activation profile of cytokines and mitogen-activated protein kinases in type 2 diabetic patients with nephropathy. Clin Exp Immunol. 2007;149:123–31. 29. Navarro-Gonzalez JF, Mora-Fernandez C. The role of inflammatory cytokines
in diabetic nephropathy. J Am Soc Nephrol. 2008;19:433–42. 30. Miao W, Xiao Y, Guo L, Jiang X, Huang M, Wang Y. A high-throughput
targeted proteomic approach for comprehensive profiling of methylglyoxal-induced perturbations of the human Kinome. Anal Chem. 2016;88:9773–9. 31. Lindhardt M, Persson F, Currie G, Pontillo C, Beige J, Delles C, et al.
Proteomic prediction and renin angiotensin aldosterone system inhibition prevention of early diabetic nephRopathy in TYpe 2 diabetic patients with normoalbuminuria (PRIORITY): essential study design and rationale of a randomised clinical multicentre trial. BMJ Open. 2016;6:e010310. 32. Van JA, Scholey JW, Konvalinka A. Insights into diabetic kidney
disease using urinary proteomics and bioinformatics. J Am Soc Nephrol. 2017;28:1050–61.
33. Betz BB, Jenks SJ, Cronshaw AD, Lamont DJ, Cairns C, Manning JR, et al. Urinary peptidomics in a rodent model of diabetic nephropathy highlights epidermal growth factor as a biomarker for renal deterioration in patients with type 2 diabetes. Kidney Int. 2016;89:1125–35.
34. Jenks SJ, Conway BR, Hor TJ, Williamson RM, McLachlan S, Robertson C, et al. Hepatic steatosis and non-alcoholic fatty liver disease are not associated with decline in renal function in people with type 2 diabetes. Diabet Med. 2014;31:1039–46.
35. Deshmukh AB, Bai S, T A, Kazi RS, Banarjee R, Rathore R, Mv V, et al. Methylglyoxal attenuates insulin signaling and downregulates the enzymes involved in cholesterol biosynthesis. Mol BioSyst. 2017;13:2338–49.
Publisher’s Note