Implementation of Template Matching Algorithm for Wearable Electrocardiogram
Sensor System
Yun-Hong Noh, Do-Un Jeong Division of Computer Engineering Dongseo University
Korea
ABSTRACT: In this paper, a segmentation template matching-based electrocardiogram compression algorithm for mobile device applications is proposed and implemented. Templates for PQ interval, QRS complex, and ST interval are created. Only the template code that closely matches the input signal is saved. The algorithm’s performance is evaluated using the Massachusetts Institute of Technology–Boston’s Beth Israel Hospital Normal Sinus Rhythm Database and with a different sampling rate. When using a 128-Hz sampling rate, the average compression ratio and percentage of root mean square difference are 7.94 and 5.33, respectively.
Keywords: ECG Compression, Segmentation template matching, ECG monitoring, Mobile device
Received: 19 September 2016, Revised 23 October 2016, Accepted 14 November 2016
© 2017 DLINE. All Rights Reserved
1. Introduction
Long-term electrocardiogram (ECG) wireless measurement technology requires several Mbytes of memory storage and a wide bandwidth to sustain active transmission. However, mobile devices are low resource systems, and the challenge of fulfilling the aforementioned requirement of long-term ECG measurement is great. Furthermore, if there are multi-channel measurements, the amount of data transmission is further increased. Therefore, it is essential to compress ECG data for effective data transmission.
In this paper, the implemented template matching-based ECG compression algorithm requires less calculation complexity, while maintaining a high CR and low reconstruction error. This is a method that performs matching between fixed templates and object searching coefficients. The coefficient value is used to justify whether matching exists (“yes” or “no”), and the objection location is then identified. Fig. 1 shows the normalized ECG ordered by the PQ-R-ST key feature. As can be seen in the figure, such normalized ECG has morphology that is extremely similar to normal ECG. A repetitive normalized ECG signal can be compressed and substituted with a representative signal.
Figure 1. Normal ECG morphological characteristics
2. ECG compression Algorithm using Segmentation Template Matching
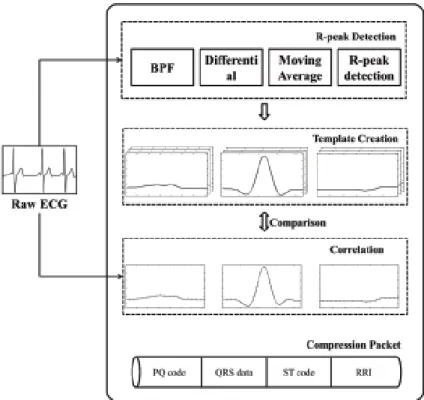
In this paper, the compression algorithm consists of three major techniques: R-peak detection, template creation, and segmentation template matching techniques. Fig. 2 shows a block diagram for the proposed template matching-based compression process.
Figure 2. Block diagram for proposed template matching-based ECG compression process
and QT interval are determined from the R-peak. Finally, templates for PQ interval, QRS complex, and QT interval are created. The created templates are used to compare with a real-time input ECG, and the optimum mean squared error (MSE) value and coefficients are calculated. The template with the least MSE provides the most similar ECG morphological characteristic (PQ, QRS, and ST). Then, the most similar template is saved as the template code.
2.1 R-peak extraction
Methods of using wavelet, envelope, moving average and etc for detecting R-peak in electrocardiogram (ECG) have been extensively proposed and evaluated. However, a main drawback is that computation complexity restricts the practical implementation in mobile system.
Pan and Tompkins develop a real-time algorithm for accurate R-peak detection is well-known in literature. The ECG signal is differentiated. The differential ECG consists of positive and negative components. After differentiation, the signal is squared point by point, and thus, making all data points into only positive. Then, moving average integration is applied to obtain waveform feature information in addition to the slope of the R wave. The outcome of moving average signal is an enhanced QRS-complex [10]. A threshold is set to detect the peak of the enhanced QRS-QRS-complex. From the peak of the enhanced QRS-QRS-complex, a window is setup to look for the maximum point in the ECG signal. Maximum point falls within the window is recognized as R-peak in ECG.
2.2 Template creation
When comparing an input ECG with the created template, it is difficult to compare raw ECG with varying amplitudes. Therefore, raw ECG is first normalized for easy template comparison. Normalization is calculated using Equations (2) and (3).
ymin = x - min(x) (2)
x y =
max(ymin) (3)
The details of the compression algorithm that uses segmentation template matching is as follows:
• The first 50 cycles of the ECG measurement are used to create the PQ interval and ST interval templates.
• The five most diverse signal patterns are used as templates for each PQ and ST interval. This means that the five most diverse templates are created for PQ and ST intervals. The created templates are assigned different code names.
• The PQ and ST data templates and their respective code names are then sent to and stored in mobile devices for signal reconstruction purposes.
• For real-time ECG data transmission, raw QRS data is transmitted, whereas raw PQ and ST data are not transmitted. Only the PQ and ST template codes are sent with raw QRS data within the same data packet. ECG data compression occurs where we send the template codes for the PQ and ST intervals, and this provides a high data CR.
• In the reconstruction of compressed ECG data, we reverse match the template code accordingly. By identifying the template code, we identify the respective templates for the PQ and ST intervals. Then, we combine the respective PQ and ST templates with the raw QRS complex data. Finally, the ECG signal with key features (PQ interval, QRS complex, and ST interval) is reconstructed. An RR-interval is provided in the received data packet.
The first 50 cycles of an ECG signal are used for template creation. First, the R-peak is detected; then, the PQ interval, QRS complex, and ST interval are classified from such R-peak.
For efficient operation, we calculate MSE and coefficient from the first cycle to the 50th cycle. The most diverse pattern is identified based on the MSE calculation. The five most diverse patterns are selected for template creation. Equations (4) and (5) are used to determine the most diverse patterns.
MSE = n1
∑
nn = 1 (xi - yi)2
coef. = 1
n - 1
∑
i=1
n
(
xi - xSx
)
×(
yi - y
Sy
)
(5)where n is number of samples; xi is the raw ECG; yi is the template; x and y are the averages of xi and yi, respectively; and sx and sy are the respective standard deviations of x and y.
2.3 Compressed data packet structure
The input ECG signal is compared to the selected template signal, and compressed. If the PQ and ST intervals of the input ECG signal have signal patterns similar to the template signals, the respective PQ and ST codes are used for data packet generation. The QRS complex contains crucial clinical information that is an important pattern for providing accurate R-peak and morphological information. Thus, the QRS complex only undergoes downsampling to minimize morphological loss. The downsampled QRS complex is refined using spline interpolation.
The compressed data packet structure conveys only PQ code, QRS data, ST code, and RRI (RR-interval) information. RRI is used for synchronization with raw ECG cycles and for heart rate detection. Fig. 4 shows the compressed data packet structure.
Figure 4. Compressed data packet structure
3.1 Template creation
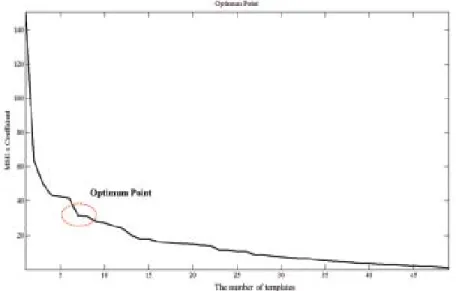
First, a total of 50 PQ and 50 ST templates were created using the first 50 ECG cycles. After normalization, MSE and coefficients were calculated for each template. Then, we selected an optimum number of templates for use. Such optimum number is identified from the decaying slope of MSE × Coefficient versus the number graph. The optimum number is calculated using Equation (6). Fig. 5 shows that an optimum number of seven templates are selected. This means that the first seven PQ and ST templates were selected.
Optimum = MSE × (|Coef.| - 1) (6)
where MSE and Coef. are as defined by Equations (4) and (5).
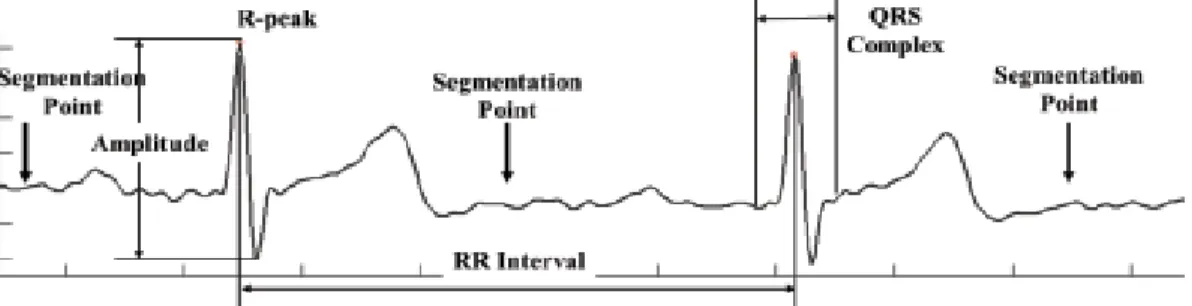
The ECG signal mainly consists of three parts: the PQ interval, QRS complex, and ST interval. Other low amplitude variations are considered non-useful information, and thus we segment them. Fig. 6 shows the segmentation point, with the exception of the three parts.
Figure 6. Segmentation point, with exception of three divided parts
3.2 Evaluation results of segmentation template matching compression algorithm
The proposed ECG compression algorithm is evaluated using ten records from the Massachusetts Institute of Technology– Boston’s Beth Israel Hospital (MIT-BIH) Normal Sinus Rhythm Database. Each record contains 10 min of ECG data recording. The database contains long-term ECG recordings of subjects referred to the Arrhythmia Laboratory at BIH (now known as Beth Israel Deaconess Medical Center). Records in this database are from healthy subjects with no significant arrhythmias. The subjects were five males with ages ranging from 26 to 45 years, and 13 females with ages ranging from 20 to 50 years.
We use the percentage of root mean square difference (PRD) and CR to evaluate the performance of the proposed algorithm.
PRD is the common parameter used to quantify the reconstructed signal quality of the compression algorithm. PRD indicates the error between the original ECG samples and the reconstructed data, and is defined in Equation (7).
PRD =
√
∑
ni=1
(xi -x∼i)2
∑
n i=1 xi2
×100 (7)
Sampling (Hz) MIT-BIH CR PRD R-Peakdetectionaccuracy (%) 16265m 6.64 4.04
16483m 7.81 4.50 16539m 8.04 5.70 16773m 8.76 5.05 16786m 9.47 3.63 16795m 9.75 5.91 17052m 8.11 5.45 17453m 8.52 4.77 18177m 6.43 6.82 19088m 5.88 7.49 Average 7.94 5.33
128 100
where n is the number of samples, and xi and xi are the original data and the reconstructed data, respectively. The proposed algorithm is evaluated using the MIT BIH Normal Sinus Rhythm. We extract 10 min of data from ten records. Table 1 lists the CR, PRD, and successful R-peak detection rate.
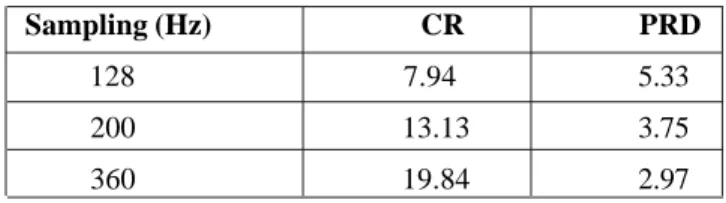
The evaluation shows that an average CR = 7.94 and average PRD = 5.33 are achieved. CR is moderate, but not high, and it is directly proportional to sampling frequency. The sampling frequency used for the MIT-BIH Normal Sinus Rhythm Database is only 128 Hz, and therefore, it shows only a moderate CR. The proposed compression algorithm can increase its CR by increasing the sampling frequency. Table 2 lists the CR performance results using different sampling frequencies.
∼
Sampling (Hz) CR PRD
128 7.94 5.33
200 13.13 3.75
360 19.84 2.97
Table 2. Compression result according to sampling
4. Conclusion
In this paper, a segmentation and template matching-based compression algorithm was proposed and implemented. The proposed algorithm can be applied for mobile ECG measurement systems. For high sampling measurement systems, we demonstrated that CR performance increases. CR performance was evaluated using the MIT-BIH Normal Sinus Rhythm Database. When a 128-Hz sampling rate was used, the average PRD and CR obtained were 5.33 and 7.94, respectively. However, when a 500-Hz sampling was used, the average CR obtained was 27.92. In comparison with other common compression algorithms, PRD was lower, but we achieved a higher CR. This paper also demonstrated that the higher the sampling frequency, the higher is CR. For future research, we plan to improve PRD, and to enhance the characteristic point detection, rather than only detect the R-peak.
5. Acknowledgements
This research was supported by the Basic Science Research Program through the National Research Foundation of Korea (NRF) funded by the Ministry of Education (No. 2013R1A1A2011905, 2015R1D1A1A01061131). And This research was supported by a research program of Dongseo University’s Ubiquitous Appliance Regional Innovation Center supported by the grants from Ministry of Commerce, Industry and Energy (No. B0008352)
References
[1] Zigel, Y., Cohen, A., Katz, A (2000). The weighted diagnostic distortion(WDD) measure for ECG signal compression. IEEE trans. Biomed.Eng., 47 (11) 1422-1430.
[2] Welch, T.A(1984). A technique for high-performance data compression. Computer, 17 (6) 8-19.
[3] Health Informatics. Standard Communication Protocol(2005). Computer assisted Electrocardiography, British-Adopted European Standard BS EN1064.
[4] Dipersio, D. A., Barr, R. C(1985). Evaluation of the fan method of adaptive sampling on human electrocardiograms. Med. Biol. Eng. Computing., 23, 401-410.
[5] Cox, J. R., Nolle, F. M., Fozzard, H. A., Oliver, G. C. AZTEC, a preprocessing program for real time ECG rhythm analysis. IEEE Trans. Biomed. Eng., 15 (4) 128-129.
[6] Mueller, W. C. (1978). Arrhythmia detection program for an ambulatory ECG monitor. Biomed. Sci. Instrum.,14, 81-85.
[7] Hilton, M. L(1997). Wavelet and wavelet packet compression of electrocardiograms. IEEE Trans. Biomed. Eng., 44 (5) 394-402.