O R I G I N A L P A P E R
Open Access
Using the spring constant method to analyze
arterial elasticity in type 2 diabetic patients
Ching-Chuan Wei
1,4*, Shu-Wen Huang
2and Cho-Tsan Bau
3Abstract
Background:This study tests the validity of a newly-proposed spring constant method to analyze arterial elasticity in type 2 diabetic patients.
Methods:The experimental group comprised 66 participants (36 men and 30 women) ranging between 46 and 86 years of age, all with diabetes mellitus. In the experimental group, 21 participants suffered from atherosclerosis. All were subjected to the measurements of both the carotid-femoral pulse wave velocity (cfPWV) and the spring constant method. The comparison (control) group comprised 66 normal participants (37 men and 29 women) with an age range of 40 to 80 years who did not have diabetes mellitus. All control group members were subjected to measurement by the spring constant method.
Results:Statistical analysis of the experimental and control groups indicated a significant negative correlation between the spring constant and the cfPWV (P<.001;r=−0.824 and–0.71). Multivariate analysis similarly indicated a close relationship. The Student’sttest was used to examine the difference in the spring constant parameter between the experimental and control groups. AP-value less than .05 confirmed that the difference between the 2 groups was statistically significant. In receiver operating characteristic curve (ROC), the Area Under Curve (AUC, = 0.85) indicates good discrimination. These findings imply that the spring constant method can effectively identify normal versus abnormal characteristics of elasticity in normal and diabetic participants.
Conclusions:This study verifies the use of the spring constant method to assess arterial elasticity, and found it to be efficient and simple to use. The spring constant method should prove useful not only for improving clinical diagnoses, but also for screening diabetic patients who display early evidence of vascular disease.
Keywords:Spring constant, Arterial elasticity, Type 2 diabetes, Carotid-femoral pulse wave velocity
Background
Arterial elasticity is a significant predictor of cardiovas-cular risk. Many studies have consistently linked a de-crease in arterial elasticity to both Type 1 and Type 2 diabetes [1-3]. This finding may indicate an important pathway linking diabetes to increased cardiovascular risk and mortality [4,5]. Researchers have proposed several methods of measuring arterial elasticity, including the pulse wave velocity (PWV) method, the arterial ultrason-ography method, compliance, augmentation index (AIx), and the second derivative of photoplethysmogram (SDPTG). The PWV method measures the pulse
propagation speed, whereas arterial ultrasonography relates the change in diameter of an artery to its distend-ing pressure. The method of compliance, AIx, and SDPTG all evaluate arterial elasticity using arterial pressure waveforms [6-8]. Different methods are suitable for assessing arterial elasticity in different regions. The PWV method can be used to assess regional stiffness. The ultrasonography method is appropriate for assessing local stiffness, and the compliance method is suitable for assessing systemic stiffness [9]. Aortic PWV measures the speed at which a pressure wave is transmitted from the aorta to the vascular tree. The carotid-femoral PWV (cfPWV) is related to the aortic PWV and is considered the gold standard for measuring aortic stiffness. The new guidelines for the management of arterial hypertension presented by the European Society of Hypertension and European Society of Cardiology indicate that a threshold * Correspondence:[email protected]
1Department of Information and Communication Engineering, Chaoyang University of Technology, Taichung, Taiwan, (R.O.C.)
4No. 6, 591 Lane, Yonglong Rd, Dali District, Taichung City 412, Taiwan, (R.O.C.) Full list of author information is available at the end of the article
of cardio-femoral PWV exceeding 12 m/s is an indicator of subclinical organ damage [10,11]. Furthermore, the cfPWV method can also be used for the analysis of the arterial elasticity of diabetic patients [12-15]. However, all these methods are essentially indirect methods of assessing arterial elasticity, and include inconveniences in signal measurement.
Of all the methods of assessing arterial elasticity, the arterial pulse plays an important role. The pulse is gener-ated by the left ventricle and propagates from the aorta to the peripheral arteries, such as the radial and femoral arteries. The arterial pulse is distorted from its original pulse waveform in whatever region the artery is hardened, and then propagates to the end of the artery. As a result, the peripheral arterial pulse waveform pro-vides information on the arterial elasticity of the central or peripheral artery. Among peripheral arterial pulses, the pulse at the radial artery is the most easily and con-veniently detected signal. Thus, an increasing number of studies have focused on the radial arterial pulse, with the goal of finding its time-domain and frequency-domain features to detect certain early cardiovascular-related diseases. For example, researchers have attempted to estimate the aortic artery pulse using radial tonometry by a transfer function [6,16-18].
Previous research proposes a direct measurement method of peripheral arterial elasticity. This method, which is based on the highly elastic structure of the ar-terial wall, uses an elastic spring to model the radial vi-bration of the peripheral arterial wall at the radial artery [19]. The characteristic parameter of the spring is the spring constant, which represents the ratio between exerted force and displacement according to linearity and Hooke’s law. Unlike the value of the spring constant of a normal spring, a lower value is often used to simulate the result of aging or damage to the spring in a mechanical system [20-22]. In other words, a lower value for the spring constant denotes that the elasticity of the spring has deteriorated. Similarly, a lower value for the spring con-stant implies deterioration in the elasticity of the arterial wall. Previous research verifies this inference [19].
Through careful verification and correlation analysis with the cfPWV, previous study confirms that the spring constant method can effectively evaluate the elasticity of the arterial wall. Because the elasticity of the arterial wall has important implications for complications such as cardiovascular-related diseases in diabetes mellitus, long-term diabetic patients require an effective and convenient index to monitor the characteristics of the arterial wall. Therefore, this study evaluates the elasticity or stiffness of the radial arterial wall in type 2 diabetic patients using both the spring constant and cfPWV methods, and compares these characteristics with those of control participants.
Methods
Basic theory of the spring constant method
This section briefly reviews the basic theory of the spring constant modeling. In traditional hemodynamics, the major kinetic energy of blood moves in a longitudinal direction; thus, the radial dilation is assumed to be small or negligible. The Moens-Korteweg equation and the related pulse wave velocity are based on these assump-tions. Pulse wave velocity is further used as an indirect index of arterial stiffness. However, over 90 % of the energy for an in situ artery is stored in the arterial wall, and less than 10 % is stored in the circulating blood [23,24]. Thus, the vibration in a radial (transverse) direc-tion should be emphasized over the axial (longitudinal) direction. In circulation physiology, the left ventricle ejects blood fluid into the aortic arch, which comprises a large turn, and transforms most of the axial kinetic energy into radial potential energy. Because the arter-ial wall (especarter-ially the media layer) consists mainly of smooth muscle cells and elastic tissue, it behaves like a spring and can transform the pumping force from the left ventricle into radial vibration of the artery. Thus, the assumptions of traditional hemodynamics should be modi-fied, and the radial dilation should not be viewed as small or negligible. The corresponding pressure wave equation of this important concept can be derived as follows [25,26]:
@2P zð Þ;t @t2 þb
@P zð Þ;t
@t þν
2
0P zð Þ ¼;t V12
@2P zð Þ;t @z2 ð1Þ
Where P(z,t) is the radial pressure defined as the dif-ference between the internal fluid pressure and the fluid pressure in the static condition. The attenuation termb
is related to the kinetic viscosity of the artery wall, the adherent fluid in the radial direction, and the stretching and contraction of the arterial wall itself. The character-istic angular frequency vo is related to Young’s modulus, arterial compliance, the mass of the wall, the adherent fluid, and the radius of the tube. The symbol V1denotes
the high-frequency phase velocity related to the shear modulus of the wall. V2
1d
2P tð Þ
dz2 is the term resulting from the Windkessel effect [25].
To determine the propagation pressure wave in the peripheral artery at a fixed position, Eq. (1) is simplified to the following equation:
d2P tð Þ dt2 þb
dP tð Þ dt þν
2
0P tð Þ ¼ kp2V12P tð Þ ð2Þ
Wherekpis the wave number [25]. In a relatively small
assumption of linear approximation. Consequently, Eq. (2) can be transformed into the following:
d2x tð Þ dt2 þb
dx tð Þ
dt þkx tð Þ ¼ kp 2V2
1x tð Þ ð3Þ
Equation (3) is analogous to describing a unit mass spring system with external force (Fexternal¼kp2V12x tð Þ),
damping force (bdx tdtð Þ), and a spring constant (k¼ν2 0).
In physics, elasticity is the physical property of a ma-terial that returns to its original shape after an external deforming force is removed. The stiffness, k0, of a body is a measure of the resistance offered by an elastic body to deformation. For an elastic body with a single degree of freedom, stiffness is defined as k0 ¼F=δ. The force applied to the body is denoted byF, andδrepresents the displacement produced by the force. A spring constant can be used as a measure of the force required to achieve a particular extension. For a given displacement,x(t), the larger the value ofk, the greater the restoring force; that is, the elastic muscle fiber of the artery wall produces greater force to restore its original shape. Accordingly, using the spring constant to assess elastic force makes it possible to evaluate the characteristics of the elastic muscle fiber. These characteristics are related to the so-called elasticity or stiffness of the arterial wall [29].
Pulse Acquiring System
Figure 2 illustrates the proposed pulse-acquiring instru-ment. We measured the radial arterial pulse at the wrist of the right hand, adjacent to the ventral surface of the radial styloid process (Figure 2). The pulse recorder was used to record the radial arterial pulse. The peak and valley of the radial pulses were respectively calibrated using the SBP (Systolic Blood Pressure) and DBP (Diastolic Blood Pressure) of an oscillometric cuff system
(Omron Healthcare Co., Ltd.). Measurements were taken immediately after the radial pulses in the same arm. Three supine blood pressure measurements were taken 3 min apart, and the average of the 3 readings was used.
The pressure sensor was mounted in a holder that allowed it to travel in 3 dimensions. The patient’s wrist was held motionless and adjusted in such a manner that the sensor made direct contact with the skin at the desired position on the radial artery. The measurement and analysis procedure took approximately 3–5 min when executed by an experienced operator. A pulse sequence of 10 s (roughly 10 pulses) was selected. Finally, we removed a continuous, piecewise linear trend to reduce the respiratory effect on pulse waveform. Within-operator and between-operator analyses revealed significantly high reproducibility [19].
To measure the arterial pulse, we gently compressed the radial artery against the bone to detect the pulse waveform of the radial artery with low distortion. Adjust-ing the pressure sensor vertically or horizontally obtained the maximum amplitude of the arterial pulse under various contact pressures, and then the acquired pulse was supposed to be optimum. In other words, the sensor was positioned exactly over the radial artery. With the optimum contact pressure (i.e., transmural pressure = 0), the sensor was considered well matched with the vibration of the arterial wall. Greater or lesser contact pressures would caused a distortion in the arter-ial pulse waveform and the spring constant [30-32]. The optimum pulse accurately reflects the vibration of the arterial wall, and can therefore be used to evaluate arter-ial elasticity. Figure 3 shows the acquired pulse sequence on the radial artery at the wrist. Some physiological factors, such as heart rate or respiration, may exert a small influence on arterial displacement. Thus, the arter-ial pulse waveforms for each pulse are not identical. Consequently, the values of the calculated spring Pressure
Vessel Diameter Linear Approximation
Spring
Arterial Pulse
Figure 1The concept of linear approximation of the pressure-diameter relationship.
Sensor
Detection point
constants for each pulse vary slightly. To reduce these influences, the analysis in this study uses the average of the spring constants of 5 steady pulse signals.
Spring constant calculation
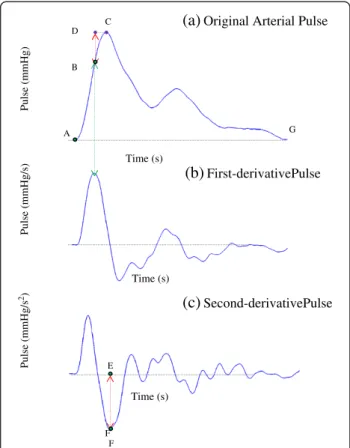
The arterial pulse is separated by points A, B, C, and G, and divided into 3 segments, A!B, B!C, and C!G, as Figure 4(a) shows. The points A and C represent the valley and peak of the arterial pulse, respectively. While the arterial wall dilates from A to B, it is driven by the force because of the Windkessel effect, the restoring force of the spring, and damping force. The force caused by the Windkessel effect acts on the arterial wall mainly between points A and B, since the peak of blood flow in the peripheral artery occurs approximately within this period [33]. The total blood flow gradually decreases be-tween points B and G, and greatly decreases the driving force generated by the Windkessel effect. At point C, the driving force caused by the Windkessel effect can be dis-regarded. B is defined as the maximum velocity point, that is, the equilibrium point while the arterial wall dilates from A to C [29].
Because the first derivative of the arterial pulse wave-form denotes the moving velocity of the arterial wall, the maximum velocity point can be derived by finding the peak of the first-order differential curve of the arterial pulse waveform (4(b)). At point B, the second derivative of the arterial pulse waveform (Figure 4(c)) relating to the force is 0. Thus, the net (total) force acting on the artery wall is 0 according to Newton’s laws, and the ar-terial wall simultaneously approaches maximum velocity. Therefore, this point is considered an equivalence point in spring vibration. As the dilation extends from B to C, the restoring force of the spring and the damping forces become the major forces acting on the arterial wall. However, at the end point C of this dilation process, the velocity of arterial wall is 0, resulting from the zero value of the first derivative of the arterial pulse waveform illustrated in Figure 4(b), and starts to contract. Conse-quently, no damping force acts at point C because the damping force is assumed to relate to the velocity.
Therefore, at point C, the damping force and the exter-nal force originating from the Windkessel effect are both 0. Equation (3) can then be simplified as follows:
d2x tð Þ
dt2 at point Cþk∗x tð Þat point C¼0 ð4Þ
The spring constantkof the arterial wall is derived as
k¼
d2x tð Þ
dt2 jat point C x tð Þjat point C ¼
EF
BD ¼
EF
BD ð5Þ
Whereksignifies the elasticity of the arterial wall. The symbol BD represents the displacement between the equivalent point B and point C. The symbolEFdenotes the magnitude of the second derivative of the arterial pulse waveform at point C. Point C plays an important role in calculating the spring constantk.
Pulse measurement experiment
The research parameters were measured in the study participants between November 15, 2010, and August
Pulse (mmHg)
Pulse (mmHg/s)
Pulse (mmHg/s
2)
F A
B
C
(a)
Original Arterial Pulse(b)
First-derivativePulse(c)
Second-derivativePulseD
E
G
F
Time (s)
Time (s)
Time (s)
Figure 4(a) The oscillation procedure of the arterial pulse is separated by points A, B, and C, and divided into two segments A!B and B!C. (b) The first-order differential curve of the arterial pulse waveform. (c) The second-order differential curve of the arterial pulse waveform.
Pulse (mmHg)
Time (s)
30, 2011, at hospital in Taiwan. The experimental proto-col was approved by Institutional Review Board of Taichung Hospital, and written informed consent was obtained from all participants before they enrolled in the study. We designed an experiment to investigate the arterial elasticity in type 2 diabetic patients using both the spring constant and cfPWV methods, and then compared the results with those of the control partici-pants. According to the World Health Organization (WHO) definition of diabetes, the inclusion criteria for type 2 diabetic patients includes a fasting plasma glucose≥7.0 mmol/L or an oral glucose tolerance test (OGTT) 2-h postprandial glucose≥11.1 mmol/L [34]. The subjects of diabetic group and control group were randomly selected. Participants with a history of heart failure, arrhythmia (atrial fibrillation, atrial flutter, and so on) were excluded because such diseases may affect the propagation speed of the arterial pulse. The inclusion criteria of control group included sex, age, and body mass index (BMI) that matched the diabetic patients. Subjects with a history of diabetes mellitus or athero-sclerosis were excluded from the control group.
Members of the experimental group included 66 parti-cipants with diabetes mellitus (aged 46 to 86 years; 36 men and 30 women) subjected to measurement by both the cfPWV and spring constant methods. Participants in the control group of 66 normal participants (aged 40 to 80 years; 37 men and 29 women) were measured only by the spring constant method. All participants were asked not to imbibe any alcoholic or caffeinated beverages on the day of the experiment. For pulse measurement, parti-cipants were instructed to sit and relax for 5 min prior to the radial pulse measurement to reduce respiration interference. The patient’s right hand was placed on the measuring platform (Figure 3), and the operator took 10 arterial pulses at the wrist. Five steady pulse signals were selected in sequence for the spring constant calculation, and these 5 calculated values were averaged to represent the spring constant of the participants. For the cfPWV
measurement, participants were instructed to rest in a supine position for 5 min, after which an automatic device (SphygmoCor system, AtCor Medical, Australia) was used to obtain the measurement.
Statistical analysis
We used the statistical toolbox in Matlab 7.11. Data were expressed as means and standard deviations, and the Student’st-test was used to compare group differences. Simple and multiple regression analyses were performed to identify the relationships between arterial elasticity measures and other hemodynamic and clinical variables. A value ofP<.05 was considered statistically significant.
Results
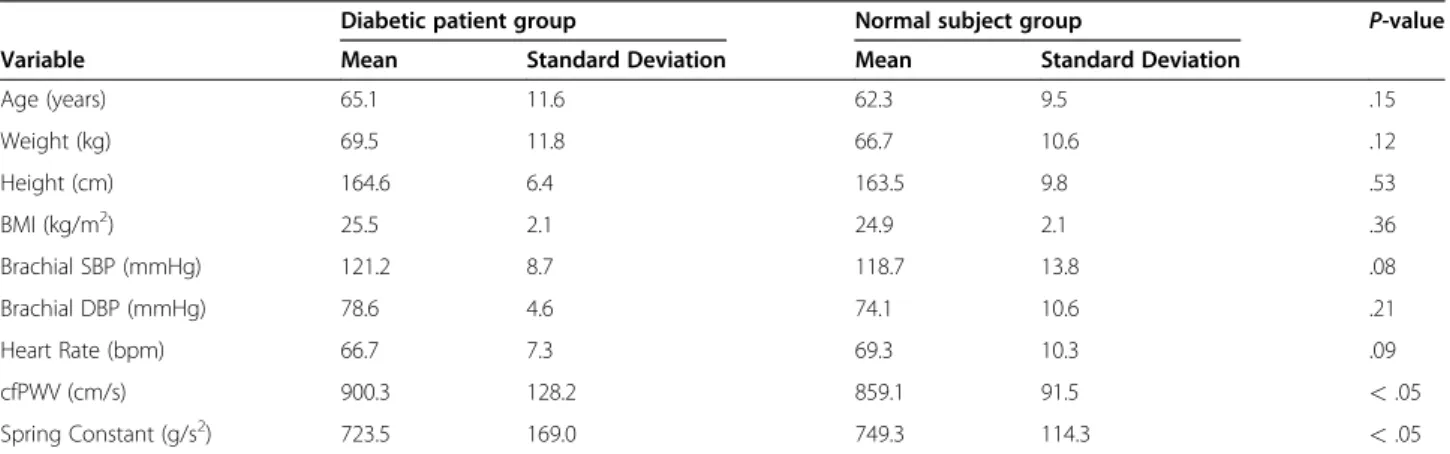
Table 1 shows a summary of the means and standard deviations for the clinical characteristics of both the diabetes-patient and normal-participant groups. The radial pulse measurement was started 5 min after the cfPWV measurement. Table 1 shows the evaluated cfPWV, spring constants, andP-values of the experimen-tal and control groups. Figure 5(a) plots the spring constant versus the cfPWV of the experimental group. As the cfPWV increased, the spring constant tended to decrease. This tendency is reflected by the negative-slope line ( y¼ 1:09xþ1701:3 ) produced by the linear regression method. The P-values and correlation coeffi-cients (< .001 and -.824) indicate a significant negative correlation between the spring constant and the cfPWV. Thus, if the calculated value of the spring constant is lower, the value of the cfPWV is higher. This finding im-plies that the elasticity of the arterial wall deteriorates over time, possibly through aging, damage, or diabetes mellitus. The control group revealed a similar relation-ship, as Figure 5(b) shows. We used the Student’st test to analyze the differences between the experimental and control groups for the spring constant. The resulting
P-value (< .05) indicated a significant difference in this parameter between the two groups. This finding implies
Table 1 Clinical characteristics of the diabetic patient group, normal subject group, andP-value
Diabetic patient group Normal subject group P-value
Variable Mean Standard Deviation Mean Standard Deviation
Age (years) 65.1 11.6 62.3 9.5 .15
Weight (kg) 69.5 11.8 66.7 10.6 .12
Height (cm) 164.6 6.4 163.5 9.8 .53
BMI (kg/m2) 25.5 2.1 24.9 2.1 .36
Brachial SBP (mmHg) 121.2 8.7 118.7 13.8 .08
Brachial DBP (mmHg) 78.6 4.6 74.1 10.6 .21
Heart Rate (bpm) 66.7 7.3 69.3 10.3 .09
cfPWV (cm/s) 900.3 128.2 859.1 91.5 <.05
that the spring constant method can distinguish between normal and abnormal elasticity characteristics in normal and diabetes participants as effectively as the cfPWV [12-15].
Table 2 shows the multivariate regression analysis of the relationship between the spring constant and age, height, brachial systolic blood pressure, heart rate, and cfPWV, respectively. The spring constant is independ-ently influenced by all 5 clinical parameters, with an adjusted R2 of 0.59. The measureβ(standardized coeffi-cient) indicates how strongly each predictor variable influences the criterion variable. These results also imply that the spring constant is significantly related to the
cfPWV (P<.001). The results in Table 2 show that as age, brachial SBP, and cfPWV increased, the spring con-stant significantly decreased, indicating deteriorating elasticity in the artery. These results agree with a basic physiological understanding and prior research findings on vessel elasticity, and confirm the validity of using a spring constant to model vessel elasticity [35,36].
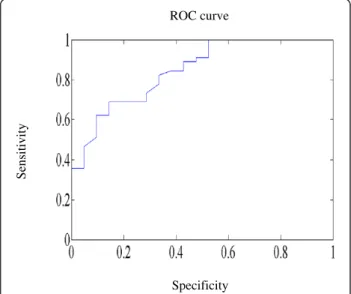
In the experimental group of 66 participants with diabetes mellitus, 21 participants suffered from athero-sclerosis; thus, they were viewed as patients with arterial stiffness. We used the receiver operating characteristic curve (ROC) to assess the sensitivity of the proposed method to evaluate arterial stiffness (Figure 6). The Area Under Curve (AUC) (= 0.85) indicates good discrimination. The mean and standard deviation of the 21 participants with atherosclerosis are 578.8 ± 144.1 (g/s2). This mean value approaches the best operating point of the ROC curve. Thus, a spring constant less than the mean (578.8 (g/s2)) may preliminarily predict a risk of arterial stiffness for diabetic patients.
Discussion
Effect of diabetes on arterial elasticity
The possible reasons for increased arterial stiffening in type 2 diabetes include impaired glycemic control and the formation of advanced glycation endproducts (AGEs) that destroy the function of endothelial cells and lead to structural changes in the vessel walls [37,38]. Arterial stiffness is related to endothelial dysfunction, which leads to an imbalance in the release of vasoactive substances from the endothelium. Smaller arterioles and branch vessels are more prone to be affected than larger arteries because the thinner media of the smaller arteries
(a)
(b)
cf PWV (cm/s)
Spring constant (g/s
2)
cf PWV (cm/s)
Spring constant (g/s
2)
Figure 5(a) Plot of the spring constant versus the cfPWV for experimental group. (b) Plot of the spring constant versus the cfPWV for control group.
Table 2 Multivariate relationship between spring constant and clinical characteristics of the diabetic patient group
Variable β(Standardized Coefficient) P-value
Age (years) - 0.512 <.001
Height (cm) - 0.315 Not Significant
Brachial SBP (mmHg) - 0.522 <.001
Heart Rate (bpm) - 0.335 Not Significant
cfPWV (cm/s) - 0.725 <.001
Sensitivity
Specificity ROC curve
responds strongly to the endothelial release of nitric oxide. Thus, the presymptomatic monitoring of the arterial elasticity of both large and small arteries in patients with type 2 diabetes should decrease the risk of cardiovascular complications. Many studies have demon-strated an increased arterial stiffening of the large artery in both type 1 and type 2 diabetes using both central PWV and central pulse pressure [1,39]. The stiffening of the peripheral artery may be more obvious than that of the larger central arteries in type 2 diabetic patients [40]. Nevertheless, few studies have discussed the effect of dia-betes on the elasticity of small or peripheral arteries.
Validity of spring constant method
Some noninvasive modalities, such as MR imaging (MRI), computed tomography (CT), and digital subtrac-tion angiography (DSA) can provide more accurate infor-mation about plaque, stenosis, or stroke [41]. In addition, the circulating level of microparticles, oxidized low-density lipoproteins, and intima-media thickness are associated with the arterial elasticity of diabetes patient [42-44]. However, these techniques are expensive and inconvenient, and are therefore not suitable for the early and fast diagnosis of arterial stiffness.
Because the radial pulse is easily detected at the peripheral artery, it is feasible to quickly evaluate the elasticity of the peripheral artery of diabetic participant using the radial pulse waveform. Using the proposed spring constant method, this study analyzes the periph-eral arterial elasticity of diabetes and normal participants. Results show that the spring constants of diabetes parti-cipants are significantly lower than those of normal participants. This implies that the arterial stiffening of diabetes participants is more serious than that of normal participants. These results agree with prior research. This study also evaluates the sensitivity of this method based on the receiver operating characteristic curve, and the value of AUC shows good discrimination. Although more subjects are required to define the risk value of spring constant for arterial stiffness, a spring constant below 578.8 (g/s2) may imply a risk of arterial stiffness for diabetic patients in this study. This suggests that the spring constant method can effectively distinguish between peripheral arterial elasticity in the experimental and control groups. In addition, the spring constants of diabetic participants and normal subjects are signifi-cantly correlated with their cfPWV values. This confirms the accuracy of the spring constant method for assessing peripheral arterial elasticity.
The pressure-diameter or stress–strain relationship of the artery wall is non-linear when pressure and diameter are observed over a wide range [27]. However, the dynamic variation in arterial pulse pressure is relatively small compared with the overall blood pressure. Thus, a
linear approximation of the pressure-diameter or stress– strain relationship is feasible. Because of the complexity of a non-linear physiological system, the assumption of linearity is an essential approach to find the average effect or tendency of a complex system. Although approximations may cause some distortion, the signifi-cant correlation between the cfPWV and the spring constant in these results confirms the feasibility of a linear approximation.
Currently available methods are basically qualitative and indirect in principle. For example, some problems still occur with PWV. First, arterial stiffness does not affect PWV independently. The contraction ability of the left ventricle, the blood viscosity, and the resistance of the terminal vascular bed may also affect PWV. Second, it is difficult to estimate the actual wave travel distances [45,46]. In contrast, the spring constant method directly and quantitatively evaluates peripheral arterial elasticity. It is theoretically based on the pressure wave equation, and can simply derive the spring constant using 1 optimum pulse at a single measurement position. The proposed method requires only a few minutes to meas-ure a radial pressmeas-ure pulse and calculate the spring constant, making it convenient and practical for clinical use.
Although the radial pulse is detected at the radial artery, it propagates from the heart, through the aortic region, and to the peripheral artery. Thus, this pulse measurement may include information about systemic, regional, or local arterial stiffness, and it can be used to assess arterial elasticity [10,47]. Stiffened arteries may cause sudden death from events such as stroke or myo-cardial infarction, which often occur in diabetic patients. Thus, effective long-term monitoring of the status of arterial elasticity is an important issue for diabetic patients. The method proposed in this study has the advantage of directly measuring peripheral arterial elasti-city. The spring constant method should prove to be useful not only for improving clinical diagnosis, but also for screening diabetic patients for early signs of vascular disease.
Abbreviations
PWV: pulse wave velocity; cfPWV: carotid-femoral pulse wave velocity; AIx: Augmentation index; SDPTG: Second derivative of photoplethysmogram; AGEs: Advanced glycation endproducts.
Competing interests
The authors declare that they have no competing interests.
Author details
Authors’contributions
C-C W carried out the research design, performed the statistical analysis, and prepared the final manuscript. S-W H participated in the design of this study and result interpretation. C-T B made contributions to the acquisition of data. All authors read and approved the final manuscript.
Received: 2 April 2012 Accepted: 25 April 2012 Published: 25 April 2012
References
1. Aoun S, Blacher J, Safar ME, Mourad JJ:Diabetes mellitus and renal failure: effects on large artery stiffness.J Hum Hypertens2001,15:693–700. 2. Brooks BA, Molyneaux LM, Yue DK:Augmentation of central arterial
pressure in Type 2 diabetes.Diabetic Med2001,18:374–380. 3. Richard JW, Gerald FW, Richard JW, Gerald FW:Measurement and
application of arterial stiffness in clinical research: focus on new methodologies and diabetes mellitus.Med Sci Monit2003,9(5):81–89. 4. Stehouwer CDA, Henry RMA, Ferreira I:Arterial stiffness in diabetes and
the metabolic syndrome: a pathway to cardiovascular disease. Diabetologia2008,51:527–539.
5. Pyorala K, Laakso M, Uusitupa M:Diabetes and atherosclerosis: an epidemiologic view.Diabetes Metab Rev1987,3:463–524.
6. Oliver JJ, Webb DJ:Noninvasive assessment of arterial stiffness and risk of atherosclerotic events.Arterioscler Thromb Vasc Biol2003,23:554–566. 7. Takazawa K, Tanaka N, Fujita M, Matsuoka O, Saiki T, Aikawa M, Tamura S,
Ibukiyama C:Assessment of vasoactive agents and vascular aging by the second derivative of photoplethysmogram waveform.Hypertens1998, 32:365–370.
8. Yamashina A, Tomiyama H, Takeda K, Tsuda H, Arai T, Hirose K, Koji Y, Hori S, Yamamoto Y:Validity, reproducibility, and clinical significance of non-invasive brachial-ankle pulse wave velocity measurement. Hypertension Res2002,25:359–364.
9. Pannier BM, Avolio AP, Hoecks A, Mancia G, Takazawa K:Methods and devices for measuring arterial compliance in humans.Am J Hypertens 2002,15:743–753.
10. Laurent S, Cockcroft J, Bortel LV, Boutouyrie P, Giannattasio C, Hayoz D, Pannier B, Vlachopoulos C, Wilkinson I, Struijker-Boudier H:Expert consensus document on arterial stiffness methodological issues and clinical applications.Eur Heart J2006,27:2588–2605.
11. Mancia G, De Backer G, Dominiczak A:2007 Guidelines for the management of arterial hypertension. The Task Force for the Management of Arterial Hypertension of the European Society of Hypertension (ESH) and the European Society of Cardiology (ESC).J Hypertens2007,25:1105–1187.
12. Hiromichi T, Takahiko K, Masanori E, Tetsuo S, Hiroyuki K, Kiyoshi M, Yoshiki N, Hirotoshi M:Correlation between the intima-media thickness of the carotid artery and aortic pulse-wave velocity in patients with type 2 diabetes.Diabetes Care1999,22:1851–1857.
13. Anna P, Pierre B, David C, Anne-Isabelle T, Brigitte L, Stéphane L:Carotid and aortic stiffness: determinants of discrepancies.Hypertension2006, 47:371–376.
14. Zhang M, Bai Y, Ye P, Luo L, Xiao W, Wu H, Liu D:Type 2 diabetes is associated with increased pulse wave velocity measured at different sites of the arterial system but not augmentation index in a Chinese population.Clin Cardiol2011,34:622–627.
15. Luciano FD, Luiz AB, Maria CL, Adelaide CF, Eduardo MK, Geraldo LF:Early signs of atherosclerosis in obstructive sleep apnea.Am J Respir Crit Care Med2005,172:613–618.
16. Urbina EM, Williams RV, Alpert BS, Collins RT, Daniels SR, Hayman L, Jacobson M, Mahoney L, Mietus-Snyder M, Rocchini A, Steinberger J, McCrindle B:Noninvasive assessment of subclinical atherosclerosis in children and adolescents.Hypertens2009,54:919–950.
17. Wei CC, Huang CM, Liao YT:The exponential decay characteristic of the spectral distribution of blood pressure wave in radial artery.Comput Biol Med2009,39:453–459.
18. Fetics B, Nevo E, Chen CH, Kass DA:Parametric model derivation of transfer function for noninvasive estimation of aortic pressure.IEEE Trans Biomed Eng1999,46:698–706.
19. Wei CC:An innovative method to measure the peripheral arterial elasticity: spring constant modeling based on the arterial pressure wave with radial vibration.Ann Biomed Eng2011,39:2695–2705.
20. Fang SE, Perera R:Power mode shapes for early damage detection in linear structures.J Sound Vib2009,324:40–56.
21. Lardner TJ:Resonance and the aging spring.J Appl Mech2002, 69:397–398.
22. Zill DG, Cullen MR:Advanced Engineering Mathematics.Jones & Bartlett Publishers; 2006.
23. Milnor WR: Hemodynamics. 2nd ed. Baltimore, MD: Williams & Wilkins Co, 1989:95–97, 106–108
24. Nichols WW, O’Rourke MF:McDonald’s blood flow in arteries. 5th edition. New York: Oxford University Press; 2005:49–58.
25. Lin Wang YY, Lia WC, Hsiu H, Jan MY:Effect of length on the fundamental resonance frequency of arterial models having radial dilation.IEEE Trans Biomed Eng2000,47:313–318.
26. Wang Lin YY, Chang CC, Chen JC, Hsiu H, Wang WK:Pressure wave propagation in arteries: a model with radial dilation for simulating the behavior of a real artery.IEEE Eng Med Bio Mag1997,16:51–56. 27. Armentano RL, Barra JG, Levenson J, Simon A, Pichel RH:Arterial wall
mechanics in conscious dogs.Circ Res1995,76:468–478.
28. VanBavel E, Siersma P, Spaan JAE:Elasticity of passive blood vessels: a new concept.Am J Physiol Heart Circ Physiol2003,285:1986–2000.
29. Hecht E:Physics: Calculus. 2nd edition. CA, Brooks/Cole: Pacific Grove; 2000:408–429.
30. Baker PD, Westenskow DR, Kuck K:Theoretical analysis of non-invasive oscillometric maximum amplitude algorithm for estimating mean blood pressure.Med Biol Eng Comput1997,35:271–278.
31. Raamat R, Talts J, Jagomagi K, Lansimies E:Mathematical modeling of non-invasive oscillometric finger mean blood pressure measurement by maximum oscillation criterion.Med Biol Eng Comput1999,37:784–788. 32. Yoon YZ, Lee MH, Soh KS:Pulse type classification by varying contact
pressure.IEEE Eng Med Biol Mag2000,19:106–110.
33. Nichols WW, O’Rourke MF:McDonald’s Blood Flow in Arteries. 5th edition. New York: Oxford University Press; 2005.
34. World Health Organization: Definition diagnosis and classification of diabetes mellitus and Its complications: report of a WHO consultation. Geneva, World Health Org., 1999.
35. McVeigh GE, Bratteli CW, Morgan DJ, Alinder CM, Glasser SP, Finkelstein SM, Cohn JN:Age-related abnormalities in arterial compliance identified by pressure pulse contour analysis: aging and arterial compliance.Hypertens 1999,33:1392–1398.
36. Yasmin Brown MJ:Similarities and differences between augmentation index and pulse wave velocity in the assessment of arterial stiffness.QJM 1999,92:595–600.
37. Amar J, Ruidavets JB, Chamontin B, Drout L, Ferriers J:Arterial stiffness and cardiovascular risk factors in a population-based study.J Hypertension 2001,19:381–387.
38. Wahlqvist ML, Lo CS, Myers KA, Simpson RW FRACP, Simpson JM:Putative determinants of arterial wall compliance in NIDDM.Diabetes Care1988, 11:787–790.
39. Lehmann ED, Gosling RG, Sonksen PH:Arterial wall compliance in diabetes.Diabetic Med1992,9:114–119.
40. Jokiniitty JM, Majahalme SK, Kahonen MA, Tuomisto MT, Turjanmaa VM: Pulse pressure is the best predictor of future left ventricular mass and change in left ventricular mass: 10 years of follow-up.J Hypertens2001, 19:2047–2054.
41. He C, Yang ZG, Chu ZG, Dong ZH, Shao H, Deng W, Chen J, Peng LQ, Tang SS, Xiao JH:Carotid and cerebrovascular disease in symptomatic patients with type 2 diabetes: assessment of prevalence and plaque morphology by dual-source computed tomography angiography.Cardiovasc Diabetol 2010,9:91.
42. Feng B, Chen Y, Luo Y, Chen M, Li X, Ni Y:Circulating level of microparticles and their correlation with arterial elasticity and endothelium-dependent dilation in patients with type 2 diabetes mellitus.Atherosclerosis2010,208:264–269.
43. Pohjantähti-Maaroos H, Palomäki A, Kankkunen P, Laitinen R, Husgafvel S, Oksanen K:Circulating oxidized low-density lipoproteins and arterial elasticity: comparison between men with metabolic syndrome and physically active counterparts.Cardiovasc Diabetol2010,9:41.
45. Jatoi NA, Mahmud A, Bennett K, Feely J:Assessment of arterial stiffness in hypertension: comparison of oscillometric (Arteriograph), piezoelectronic (Complior) and tonometric (SphygmoCor) techniques.J Hypertens2009, 27:2186–2191.
46. Rajzer MW, Wojciechowska W, Klocek M, Palka I, Brzozowska-Kiszka M, Kawecka-Jaszcz K:Comparison of aortic pulse wave velocity measured by three techniques Complior SphygmoCor and Arteriograph.J Hypertens 2008,26:2001–2007.
47. Mackenzie IS, Wilkinson IB, Cockcroft JR:Assessment of arterial stiffness in clinical practice.QJM2002,95:67–74.
doi:10.1186/1475-2840-11-39
Cite this article as:Weiet al.:Using the spring constant method to analyze arterial elasticity in type 2 diabetic patients.Cardiovascular
Diabetology201211:39.
Submit your next manuscript to BioMed Central and take full advantage of:
• Convenient online submission
• Thorough peer review
• No space constraints or color figure charges
• Immediate publication on acceptance
• Inclusion in PubMed, CAS, Scopus and Google Scholar
• Research which is freely available for redistribution