AJPRHC Volume 5 Issue 1 24-31
AJPRHC
Research Article
QUANTITATIVE DETERMINATION OF TENOFOVIRDISPROXIL FUMARATE AS AN ACTIVE PHARMACEUITCAL INGRADIENT IN TABLET FORMULATIONS BY VISIBLE
SPECTROPHOTOMETRY
KALYANA RAMU BURIDI
For Author affiliations see end of the text
This paper is available online at www.jprhc.in
ABSTRACT
In the present investigation, a direct, simple and sensitive visible spectrophotometric method without using any buffer solution is described for the assay of tenofovir disproxil fumarate in pure and tablet dosage forms. The method is based on the formation of yellowish brown colored species by the drug with NQS reagent and exhibits absorption maxima at 451 nm. Regression analysis of Beer-Lambert plots showed good correlation in the concentration ranges (8-40) µg/ml. The proposed method is applied to commercial available tablets and the results are statistically compared with those obtained by the reported UV reference method and validated by recovery studies. The results are found satisfactory and reproducible. The method is applied successfully for the estimation of the tenofovir disproxil fumarate in the presence of other ingredients that are usually present in dosage forms. The method offers the advantages of rapidity, simplicity and sensitivity and normal cost and can be easily applied to resource-poor settings without the need for expensive instrumentation and reagents.
Key words: Assay, Beer’s Law, Chemotherauptic agent, NQSreagent, Regression equation, Statistical analysis.
INTRODUCTION:
Tenofovir Disoproxil Fumarate (TDF) (Fig.1) is an antiretroviral agent belonging to the class of nucleotide reverse transcriptase inhibitors (NRTI) used in the management of HIV infection in adults. It is an orally bio available pro drug of tenofovir and the first nucleotide analogue approved for HIV-1 treatment1-2. In vivo, TDF is converted to tenofovir, an acyclic nucleoside phosphonate (nucleotide) analog of adenosine 5’-monophosphate. Tenofovir exhibits activity against HIV-1, HIV-2 and hepatitis-B virus. Chemically it is the 1:1 salt of the bis-isopropyloxy carbonyl oxy methyl ester of tenofovir and fumaric acid [9-[(R)-2-[[bis [(isopropoxycarbonyl) oxy] methyl] phosphinyl] methoxy] propyl] adenine fumarate]. Its empirical formula is C19H30N5O10P.C4H4O4
AJPRHC Volume 5 Issue 1 24-31
N N N H2
N N
C H3 O P
O
O O O O O O O O H
H O2C
C O2H H c = c .
Figure 1: Chemical structure of tenofovir disproxil fumarate
Before phosphorylation, TDF is converted to tenofovir in the intestinal lumen and plasma by diester hydrolysis. Tenfovir then internalized into cells, possibly by endocytosis, and subsequently phosphorylated in sequential steps to tenfovir monophosphate and to the active metabolite, tenfovir diphosphate. In a mechanism similar to that of NRTI’s, tenfovir diphosphate competes with its natural nucleotide counterpart deoxyadenosine5’-triphosphate, for incorporation into newly forming HIV DNA. Once successfully incorporated, termination of the elongating DNA chain ensues, and DNA synthesis is interrupted.
Extensive literature review reveals that several spctrophotometric UV4-11 &Visible12-15, HPLC16-24, HPTLC25-26 and LC/LC-MS27-33 methods have been reported so far for determination of tenofovir alone and its combination with other drugs. Even though some visible spectrophotometric assay procedures have been reported for the determination of TDF, many of them concern with biological fluid samples and very few in pharmaceutical formulations and functional groups present in the drug not fully exploited. So the author has made some attempts in this direction and succeeded in developing the method based on the reaction between the drug and folin reagent (NQS) 34 in presence of NaOH instead of phosphate buffer pH8.0 under specified experimental conditions. The method can be extended for the routine quality control analysis of pharmaceutical products containing TDF.
MATERIALS & METHODS (EXPERIMENTAL)
Apparatus and chemicals: A Shimadzu UV-Visible spectrophotometer 1800 with10mm matched quartz cells was used for all spectral measurements. A Systronics digital pH meter mode-361 was used for pH measurements. All the chemicals used were of analytical grade.
Folin reagent (NQS) solution (Loba, 0.5%, 1.93x10⁻²M prepared by dissolving 500mg of NQS in 100 ml of distilled water), NaOH solution (E. Merck, 20%, 5M prepared by dissolving 20 g of NaOH in 100 ml of distilled water) were prepared.
Preparation of Bulk and Sample solution: About 100mg of TDF [pure or formulation] was accurately weighed and dissolved in 100ml of 3M Hydrochloric acid in a volumetric flask to form the stock solution of 1mg/ml. The solution was refluxed gently for 60 minutes to hydrolyze the phosphate groups from the drug. The hydrolyzed drug was partitioned with chloroform (25ml x4). The chloroform extract was evaporated to dryness and the residue so obtained was dissolved in 10 ml 0.1M sodium hydroxide and the volume was brought to 100 ml with distilled water. The working standard solution of TDF (200 µg/ml) was obtained by appropriately diluting the standard stock solution with the same solvent. The prepared stock solution was stored at 4 C protected from light. From this stock solution, a series of standards were freshly prepared during the analysis day.
Determination of wavelength maximum ( max):
AJPRHC Volume 5 Issue 1 24-31 Figure 2: Absorption spectra of TDF-NQS system
Preparation of calibration curve:
Aliquots of the standard TDF solution [1.0-5.0ml, 200µg/ml] were placed in a series of 25ml standard flask. Then 0.5ml of folin reagent (1.092x10⁻²M), 1.0ml NaOH and 1.5ml of distilled water were added and kept aside for 15 min for complete color development. Then the volume was made up to 25 ml using distilled water and sonicated for 1 minute. The absorbance was measured at 451 nm against a reagent blank within the stability period (5minutes to 30min). The calibration graph was constructed by plotting the drug concentration versus absorbance. The amount of drug was computed from its calibration graph (Fig.3).
Figure 3: Calibration graph of TDF-NQS system
RESULTS AND DISCUSSION
AJPRHC Volume 5 Issue 1 24-31
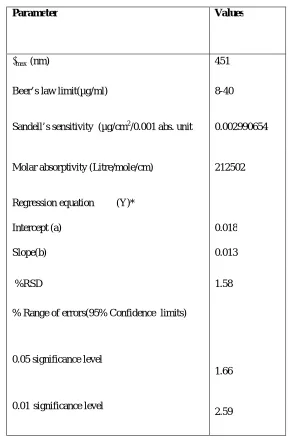
limit, Sandell‘s sensitivity, molar absorptivity, percent relative standard deviation, (calculated from the six measurements containing 3/4th of the amount of the upper Beer’s law limits), Regression characteristics like standard deviation of slope (Sb), standard deviation of intercept (Sa), standard error of estimation (Se) and % range of
error (0.05 and 0.01 confidence limits) were calculated and the results are summarized in Table-1.
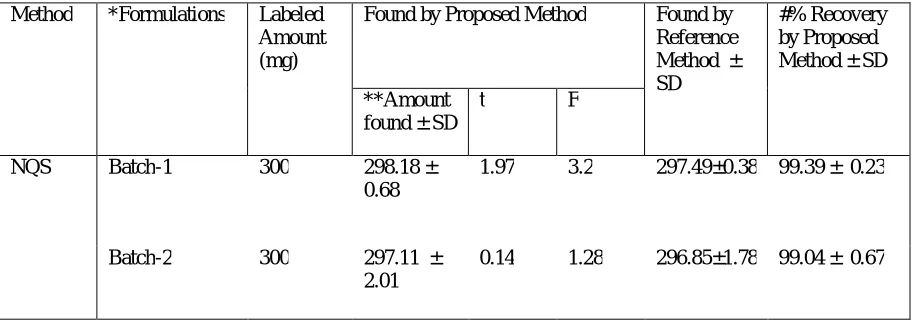
Commercial formulations containing TDF were successfully analyzed by the proposed method. The values obtained by the proposed and reference method (reported UV method using distilled water after dissolving in 1ml methanol,
max=260nm) for formulations were compared statistically by the t-and F-test and found not to differ significantly. As
an additional demonstration of accuracy, recovery experiments were performed by adding a fixed amount of the drug to the pre analyzed formulations at three different concentration levels. These results are summarized in Table-2.
Chemistry of colored species:
In the present investigation, the presence of hetrocyclic amino moiety of TDF permits the development of visible spectrophotometric method for its determination. Yellowish brown colored species (N-alkyl amino napthaquinone) was formed by replacement of the sulphonate group of the napthaquinone sulphonic acid by a primary amino group of drug. The formation of colored species with the reagent may be assigned through above analogy as shown in scheme (Fig.4).
H
O O S O3N a
O O N R R H H N N N N
C H3 O
P O
O O O O O O O O H
H O2C
C O2H
H
N
+
N - A l k y l a m i n o n a p t h a q u i n o n e C o l o r e d s p e c i e s
R =
d r u g a n a l y t e
c = c .
AJPRHC Volume 5 Issue 1 24-31 TABLE 1: OPTICAL CHARACTERISTICS, PRECISION AND ACCURACY OF PROPOSED METHOD.
Parameter Values
max (nm) 451
Beer’s law limit(µg/ml) 8-40
Sandell’s sensitivity (µg/cm2/0.001 abs. unit 0.002990654
Molar absorptivity (Litre/mole/cm) 212502
Regression equation (Y)*
Intercept (a) 0.018
Slope(b) 0.013
%RSD 1.58
% Range of errors(95% Confidence limits)
0.05 significance level
1.66
0.01 significance level
2.59
AJPRHC Volume 5 Issue 1 24-31 TABLE 2: ANALYSIS OF TENOFOVIR DISPROXIL FUMARATE BY PROPOSED AND REFERENCE METHODS.
Method *Formulations Labeled Amount (mg)
Found by Proposed Method Found by Reference Method ± SD
#% Recovery by Proposed Method ± SD
**Amount found ± SD
t F
NQS Batch-1 300 298.18 ± 0.68
1.97 3.2 297.49±0.38 99.39 ± 0.23
Batch-2 300 297.11 ± 2.01
0.14 1.28 296.85±1.78 99.04 ± 0.67
* Batch 1 and Batch 2 are different pharmaceutical companies of Tenof (Hetro) and Tavin (Emcure).
**Average ± Standard deviation of six determinations, the t- and F-values refer to comparison of the proposed method with reference method. (UV). Theoretical values at 95% confidence limits t =2.57 and F = 5.05.
# Recovery of 10mg added to the pre analyzed sample (average of three determinations).
Reference method (reported UV method) using distilled water after dissolving in 1ml methanol ( max=260nm).
CONCLUSION
The reagents utilized in the proposed method are normal cost, readily available in all chemical laboratories and small scale industries and the procedure does not involve any critical reaction conditions or tedious sample preparation. The proposed colorimetric method possesses reasonable precision, accuracy, and simple, sensitive and can be used as alternative method to the reported ones for the routine determination of TDF depending on the need and situation.
ACKNOWLEDGEMENTS
AJPRHC Volume 5 Issue 1 24-31 REFERENCES
1. Sweetman SC. Martindale The complete drug reference, 35 th ed. Published by Pharmaceutical Press. London, UK, 2007, 811.
2. Gilead Sciences Inc. Viread (tenofovir) product monograph. Faster city CA 2001.
3. Indian Pharmacopoeia. The Indian Pharmacopoeia Commission, Ghaziabad, 2007, Vol. 3 1783-1784. 4. Gnanarajan G, Gupta AK, Juyal V, Kumar P, Yadav PK, Kailash P, Journal of Young Pharmacist Pharm
Analysis, 2009,1(4),, 351-53.
5. Shela Rani T, Sujatha K, Chitra K, Jacob DM, Ramya Y, Manasa D, Sushma B, Reseach and Reviews: Journal of Pharmaceutical Analysis, 2012, 1(1), 9-12.
6. Prasanna A. Nevase, Hemalata M. Nimje, Rajesh J. Oswal, Rishikesh V. Antre, Sandip S. Kshirsagar., Inter. J. of Pharmaceutical Research and Development, 2011, 3(3), 73-75.
7. Shirkhedkar AA, Bhirud H, Surana SJ, Pakistan Journal of Pharmaceutical Sciences, 2009, 22(1), 27-29. 8. Patel S, Baghel US, Rajesh P, Prabhakar D, Engla G, Nagar PN, International Journal of Pharmaceutical
and Clinical Research, 2009, 1(1), 28-30.
9. Johnson O. Onnah and Ukpe Ajima, Int. J. Drug Dev. & Res., 2011, 3(1), 199-204. 10. Pratap Reddy AJ, Chakravarthi IE, IOSR Journal of Applied Chemistry 2012, 1(2), 29-33.
11. Srinivasa Rao M, Shanmukh Kumar J, Ravikumar D, Ramachandran D, International Journal of Pharmaceutical Sciences Review and Research, 2013, 18(1), 18-20.
12. Janaki pathi P, Ravindra Reddy P and Appala Raju N, Research Journal of Pharmacy and Technology, 2011, 4(3), 446-449.
13. Vanitha Prakash K, Padmalatha M, Eranna Dopadally, Biosciences, Biotechnology Research Asia 2010, 7(1), 726.
14. Johnson O. Onnah and Ukpe Ajima, Tropical Journal of Pharmaceutical Research 2011, 10(1), 89-96. 15. Appala Raju N, Begum S, Research Journal of Pharmacy and Technology, 2008, 1(4), 522-525.
16. Seshachalam U, Rajababu U, Haribabu B, Chandrasekhar KB, Journal of Liquid Chromatography & Related Technologies, 2008, 31 (1-4), 410-420.
17. Kandagal PB, Manjunatha DH, Seetharamappa J, Kalanur SS, Analytical Letters, 2008, 41(4), 561-570. 18. Sentenac S, Fernandez C, Thuillier A, Lechat P, Aymard G, Journal of Chromatography B, 2003, 793(2),
317-324.
19. Jullien V, Treluyer JM, Pons G, Rey E, Journal of Chromatography B, 2003, 785(2), 377-381. 20. Rezk NL, Crutchley RD, Kashuba AD, Journal of Chromatography B, 2005, 822(1-2), 201-208.
21. Sparidans RW, Crommentuyn KML, Schellens JHM, Beijnen JH, Journal of Chromatography B, 2003, 791 (1-2), 227-233.
22. Malapatil SM and Nandedkar MA, Journal of Ind. Council Chem., 2009, 26(1), 67-69.
23. Sagar Suman Panda, Pratik Das, Annapurna MM, International Journal of Pharmaceutical Research and Development, 2009, 1(10), 1-9.
24. Joshi M, Nikalje AP, Shahed M, Dehghan M, Indian journal of Pharmaceutical Sciences, 2009, 71(1), 95-97.
25. Kumar Pradeep, Dwivedi SC, Kushnoor Ashok, Research Journal of Chemical Sciences, 2011, 1(7), 33-37. 26. Barkil MEI, Gagnieu MC, Guitton J, Journal of Chromatography B, 2007, 854 (1- 2), 192-197.
27. King T, Bushman L, Kiser J, Anderson PL, Ray M, Delahunty T, Fletcher CV, Journal of Chromatography B, 2006, 843 (2,7), 147-156.
28. Bezy V, Morin P, Couerba P, Leleu G, Agrofoglio L, Journal of Chromatography B, 2005, 821(2), 132-143.
29. Delahunty T, Bushman L, Robbins B, Fletcher CV, Journal of Chromatography B, 2009, 877 (20-21), 1907-1914.
30. Dunge Ashenafi, Varalakshmi Chintam, Daisy Van Veghel Sanja Dragovic Jos Hoogmatens Erwin Adams, J. Sep. Sci., 2010, 33, 1708-1716.
AJPRHC Volume 5 Issue 1 24-31
32. Takahashi M, Kudaka Y, Okumura N, Hirano A, Banno K, Kanneda T, Biol. Pharm. Bull. 2007, 30(9), 1784-86.
33. Delahunty T, Bashman L, Fletcher CV, Journal of Chromatography B, 2006, 830, 6-12.
34. Rosenblatt DH, Hlinka P, Epstein J. Colorimetric determinations of aromatic amines. Anal Chem 1955; 27: 1290.
AUTHORS AFFILIATION AND ADDRESS FOR CORRESPONDENCE
Department of Chemistry, Maharajah’s College (Aided & Autonomous),Vizianagaram-535002 (AP) India