Research Article
a
September
2018
Computer Science and Software Engineering
ISSN: 2277-128X (Volume-8, Issue-9)
Computer Aided Diagnosis System of Skin Cancer using
Artificial Neural Network
Seniora. H. Elsheikh*, Zeinab .A .Mustafa, Banazier. A. Ibraheem
Biomedical Engineering Department, Sudan University of Sciences and Technology, Khartoum, Sudan
Email- [email protected], [email protected], [email protected]
Abstract— The skin is the largest organ of the body, with a total area of about 20 square feet. The skin protects us from microbes, helps regulate body temperature, and permits the sensations of touch, heat, and cold. Skin cancer is the deadliest form of cancers in humans. Skin cancer is commonly known as Melanoma. Melanoma is named after the cell from which it presumably arises, the melanocyte. Skin Cancers are of two types- Benign and Malignant Melanoma. Melanoma can be cured completely if it is detected early. Both benign and malignant melanoma resembles similar in appearance at the initial stages. So it is difficult to differentiate both. This is a main problem with the early skin cancer detection. Only an expert dermatologist can classify which one is benign and which one is malignant. The Artificial Neural Network based Classification methodology uses Image processing techniques and Artificial Intelligence for early diagnosis. Main advantage of this computer based classification is that patient does not need to go to hospitals and undergo various painful diagnosing techniques like Biopsy. In this Computer Aided Classification, dermoscopy image of skin cancer is taken and it is subjected to various pre-processing and image enhancement techniques. The cancer affected region is separated from the healthy skin using Segmentation. In order to reduce the complexity of classification, some unique features of malignant and benign melanoma are extracted. These features are given as the input to the Artificial Neural Network Classifier. It classifies the given data set into benign or malignant melanoma.The system successfully classified and differentiate between benign and malignant melanoma with accuracy 98.3%.
Keywords— Skin cancer, melanoma, dermoscopic images, image processing, Segmentation, Feature extraction, Artificial Neural Networks
I. INTRODUCTION
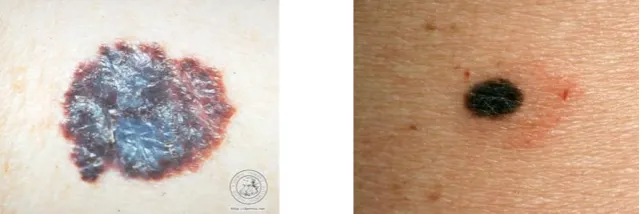
Skin Cancer is the cancer affecting the skin. It is a deadly form of cancer. Skin cancer may appear as malignant or benign form. Skin cancer at its early stages can be cured. But when it is not recognized at its early stages, it begins to spread to other parts of the body and can be deadly. Benign Melanoma is simply appearance of moles on skin. A normal mole is usually an evenly colored brown, tan, or black spot on the skin. It can be either flat or raised. It can be round or oval. Moles are generally less than 6millimetres. Malignant melanoma is the appearance of sores that cause bleeding. Malignant Melanoma is the deadliest from of all skin cancers. It arises from cancerous growth in pigmented skin lesion. Malignant melanoma is named after the cell from which it presumably arises, the melanocyte. If diagnosed at the right time, this disease is curable. Melanoma diagnosis is difficult and needs sampling and laboratory tests [1]. Melanoma can spread out to all parts of the body through lymphatic system or blood. The main problem to be considered dealing with melanoma is that, the first affliction of the disease can pave the way for future ones. Biopsy is the conventional method for skin cancer detection, involving the removal of skin and it undergoes various laboratory tests. Laboratory sampling often causes the inflammation or even spread of lesion. So, there has always been lack of less dangerous and time-consuming methods. Computer based diagnosis can improve the speed of skin cancer diagnosis which works according to the disease symptoms. The similarities among skin lesions make the diagnosis of malignant cells a difficult task. But, there are some unique symptoms of skin cancer, such as: Asymmetry, Border irregularity, Color variation and Diameter. Those are popularly known as ABCD parameters. ABCD parameters. A symmetry, Border irregularity, Color, Diameter [2]. Asymmetry is one half of the tumor does not match the other half. Border Irregularity is the unevenness of images. Color intensity change in the lesion region is irregular. Malignant melanoma is having a diameter greater than 6mm.
ISSN(E): 2277-128X, ISSN(P): 2277-6451, pp. 15-24
Fig. 1: flow chart of the proposed method
II. METHODOLOGY
First step in the skin cancer detection system is the input image. Dermoscopic image in digital format is given as input to the system. Next step is the noise removal. The image contains hairs and other noises. These noises cause errors in classification. The noises are removed by filtering. . The image after filtering is subjected to segmentation. Segmentation separates the suspicious lesion from normal skin. There are some unique features that distinguish malignant melanoma from benign melanoma. Those features are extracted using histogram based statistical Features. Then these features are given as the input to Artificial Neural Network Classifier (ANN). The classifier classifies the given datasets into benign and malignant melanoma.
A. Data Acquisition
Dermoscopy is an imaging methodology for the exanimation of skin lesions [1]. This method provides a good and detailed view of the lesions. The imaging equipment used for taking the images is Dermatoscope. It is a handheld device which is compact and easy to use. An oil film is placed between the lens of detematoscope and skin lesion. Main purpose of placing oil film is to obtain the magnified view of skin tissues. Lighting is provided from both sides of the equipment so that information about deeper layers and more clear view of the skin tissues are obtained [4]. The database is composed of 120 skin cancer images: 60 cases are benign, 60 cases are malignant. The digital images are collected from The Cancer Imaging Archive (TCIA). DICOM is the primary file format used by TCIA for image storage.
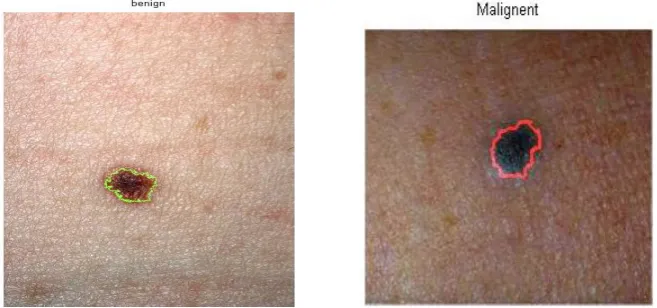
Fig. 2: Medical diagram of two types of melanoma skin cancer
B. Image Pre-Processing
Preprocessing of the Dermoscopic image is the first step in our proposed system. Preprocessing of an image is done to reduce the noise and to enhance the image for further processing. The purpose of these steps is basically to improve the image and the image quality to get more surety and ease in the segmentation step. Before applying any processing step the images are resized because they were too big to display and to have same dimension for processing purpose. Then the image was converted to gray scale because all the next steps were done on gray image. The noise removal and enhancement of contrast are done using median filter and the fine details of the image are further improved.
ISSN(E): 2277-128X, ISSN(P): 2277-6451, pp. 15-24 C. Image Segmentation
After enhancing the dermoscopic image, the next step of the proposed method is to segment the lesion region from healthy region. Segmentation is done to separate the image foreground from its background. Segmenting an image also saves the processing time for further operations which has to be applied to the image.
Firstly, we segment the image into N super pixels by the SLIC method and use them as the minimum processing units. The SLIC algorithm generates super pixels by clustering pixels based on their color similarity and proximity in the image plane. This is done in the five-dimensional [labxy] space, where [lab] is the pixel color vector in CIELAB color space, which is widely considered as perceptually uniform for small color distances, and xy is the pixel position.
The advantages brought by segmenting an image into several super pixels are that the super pixels can not only capture the structural information of an image but also speed up the processing. Then, an undirected weighted graph G= (V, E) is constructed. Each nodes vi∈V corresponds to a super pixel and each edge eij∈E connects two super pixels. We enforce that the nodes on the four sides of image are connected, i.e., any pair of boundary nodes are considered to be adjacent. Thus, we denote the graph as the close-loop graph.
We observe that background often presents local or global appearance connectivity with each of four image boundaries and foreground presents appearance coherence and consistency. In this work, we exploit these cues to compute pixel saliency based on the ranking of super pixels. For each image, we construct a close-loop graph where each node is a super pixel. We model saliency detection as a manifold ranking and propose a two-stage for graph labeling. In the first stage, we exploit the boundary prior by using the nodes on each side of image as labeled background queries. From each labeled result, we compute the saliency of nodes based on their relevance (i.e., ranking) to those queries as background labels. The four labeled maps are then integrated to generate a saliency map.
In the second stage, we apply binary segmentation on the resulted saliency map from the first stage, and take the labeled foreground nodes as salient queries. The saliency of each node is computed based on its relevance to foreground queries for the final map.
Fig. 4: final segmented image
D. Feature extraction:
The automatic recognition and classification of biomedical objects can enhance work efficiency while identifying new inter-relationships among biological features .Feature extraction is the first step of image texture analysis. There are some unique features that distinguish malignant melanoma from benign melanoma. Feature extraction extracts the eminent and important features of image data, from the segmented image. It makes the raw data more useful in processing. By extracting features, the image data is narrow down to a set of feature [5]. Feature extraction technique used is histogram based First-order intensity statistical features are applied which calculate ten of the features.
ISSN(E): 2277-128X, ISSN(P): 2277-6451, pp. 15-24
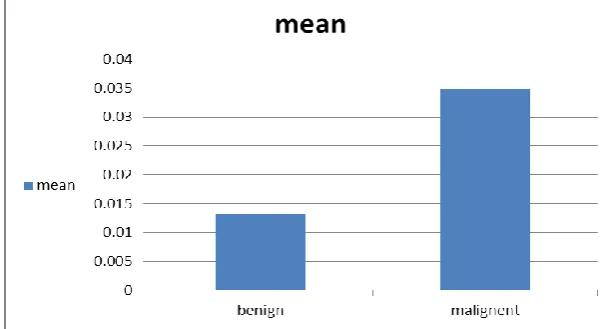
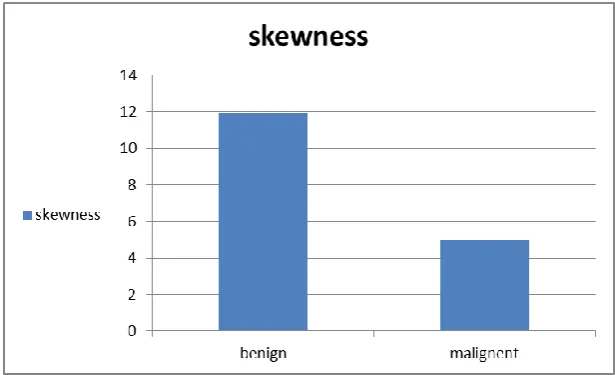
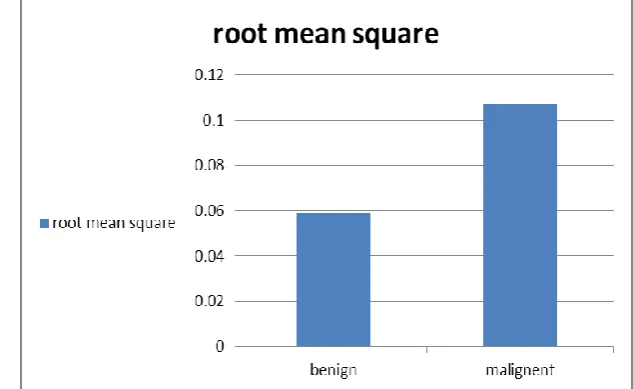
Table I Average value for texture features for all cases (Benign and malignant melanoma). Average
Features benign malignant
Mean 0.013150155 0.034791537
Std 0.056557143 0.100343378
Skewness 11.95923309 4.934852947
Kurtosis 231.7010891 45.49112407
Variance 0.005890179 0.012459634
root mean square 0.058623156 0.106932324
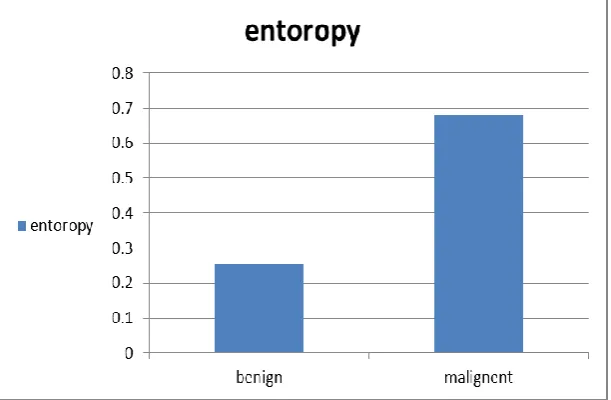
Entropy 0.254537623 0.681161773
Energy 12589.92942 3893.423052
Std error 0.051471877 0.089430219
Correlation -0.057220751 -0.014796267
We can show all these features in the below figures
Mean value for the malignant is higher than the benign melanoma, because the malignant melanoma is more bright than malignant.
Fig. 5.b: show the graph of the STD features for benign & malignant melanoma cases
This feature tells us about the contrast. The standard deviation for the malignant melanoma is higher than the benign.
ISSN(E): 2277-128X, ISSN(P): 2277-6451, pp. 15-24
The Skewness gives indication about the symmetry in the texture. So the malignant melanoma has the lowest value, it has less symmetry in the texture.
Fig. 5.d: show the graph of the Kurtosis features for benign & malignant melanoma cases
As well as for the Kurtosis. This means that the texture is not regular and non homogenous.
Fig. 5.e: show the graph of the Variance features for benign & malignant melanoma cases
This feature measure the variation of the gray level in the image, a high contrast image will have a high variance and low contrast image will have a low variance.
ISSN(E): 2277-128X, ISSN(P): 2277-6451, pp. 15-24
The RMS is the square root of the average of the sum of all pixel values squared. In contrast to the mean, the RMS value is not affected by a pixel value being positive or negative.
Fig. 5.g: show the graph of the Entropy features for benign & malignant melanoma cases
Malignant melanoma gives a high value in entropy; this means it has less energy value since the energy inversely proportional to the entropy. This means that the malignant melanoma has great number of gray level.
Fig. 5.h: show the graph of the Energy features for benign & malignant melanoma cases
ISSN(E): 2277-128X, ISSN(P): 2277-6451, pp. 15-24
Fig. 5.j: show the graph of the STD error features for benign & malignant melanoma cases
E. Artificial Neural Network Classifier:
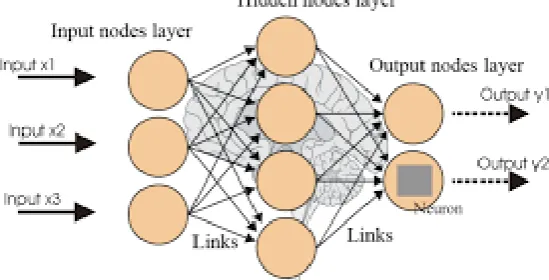
Classifier is used for classifying Malignant Melanoma from other skin diseases. Based on the computational simplicity Artificial Neural Network (ANN) based classifier is used [3]. Neural Network is able to solve highly complex problems due to the nonlinear processing capabilities of its neurons. In this proposed system, a feed forward multilayer network is used. Back propagation (BPN) Algorithm is used for training. There must be input layer, at least one hidden layer and output layer. The hidden and output layer nodes adjust the weights value depending on the error in classification. In BPN the signal flow will be in feed forward direction, but the error is back propagated and weights are updated to reduce error. The modification of the weights is according to the gradient of the error curve, which points in the direction to the local minimum. Thus making it much reliable in prediction as well as classifying tasks.
Fig. 6: Artificial Neural Network structure
ISSN(E): 2277-128X, ISSN(P): 2277-6451, pp. 15-24
Fig. 7: classification result: a) for benign and b) for malignant data
III. RESULTES AND DISCUSSION
For the proposed system, Dermoscopic images were collected from The Cancer Imaging Archive (TCIA). They were undergone Median Filtering. After that, Filtered images were segmented to separate the lesions skin from healthy skin. Feature Extraction of images was done using histogram based first order intensity statistical features. All these were done in MATLAB software. The obtained Features were given as inputs to a Feed Forward Neural Network. Activation function used is Log Sigmoid, which gives an output of 0 or 1. One represents benign condition and zero represents malignant condition. The neural network is designed using NEURAL LAB software.
For ANN additional window appear when running it which clarify the architecture of the network that was created. In this case there are two input set to get two output set also (benign and malignant), and the hidden layers were set to be 50 layers as recommended in the literature. Then from the neural network window the confusion matrix figure was plotted.
Fig. 8: Neural Network Architecture
ISSN(E): 2277-128X, ISSN(P): 2277-6451, pp. 15-24 A. Result Validation
The obtained results are validated with Diagnosis results prepared by doctors, using the conventional diagnosing procedures. Among the 60 images given for classification, the ANN based classifier gives the output of 30 malignant and 29 benign conditions. When compared with the actual results, it was found that, there was 1 misclassification. The obtained results show that the methodology has an accuracy of 98.3%.
Table II Performance evaluation of ANN classification
In terms of classification, we can say that, Malignant= positive, Label=M
Benign= negative, Label=B
Considering the above terms, hence:
True Positive (TP): Actually Positive (M), Classified as Positive (M). True Negative (TN): Actually Negative (B), Classified as Negative (B). False Positive (FP): Actually Negative (B), Classified as Positive (M). False Negative (FN): Actually Positive (M), Classified as Negative (B).
From TABLE II, TP = 30, FP = 1, FN = 0, TN =29, Total =60, and by applying in the above equation:
IV. CONCLUSIONS
Diagnosis of skin cancer using morphology in image processing is proposed in this research, the aim of this study is to help Dermatologist to diagnose melanoma in early stages. Skin cancer is the deadliest form of cancers in humans. Skin cancer is commonly known as Melanoma. Melanoma is named after the cell from which it presumably arises, the melanocyte. Skin Cancers are of two types- Benign and Malignant Melanoma. Melanoma can be cured completely if it is detected early. Both benign and malignant melanoma resembles similar in appearance at the initial stages. So it is difficult to differentiate both. This is a main problem with the early skin cancer detection. Only an expert dermatologist can classify which one is benign and which one is malignant.
The diagnosing methodology in this research uses Digital Image Processing Techniques and Artificial Neural Networks for the classification of Malignant Melanoma from benign melanoma. Dermoscopic images were collected and they are processed by various Image processing techniques. The unique features of the segmented images were extracted using histogram based features. Based on the features, the images were classified as Malignant or Benign. This classification system has good accuracy of 98.3%.
REFERENCES
[1] Ho Tak Lau and Adel Al-Jumaily, “Automatically Early Detection of Skin Cancer: Study Based on Neural Network Classification”, International Conference of Soft Computing and Pattern Recognition, IEEE , pp 375-380, 2009 Actual Value (Target Class) P re d ict ed Valu e (O u tp u t clas s) P os it ive
Positive negative Total
30 (TP) 1 (FP) 31 N egat ive 0 (FN) 29 (TN) 29
ISSN(E): 2277-128X, ISSN(P): 2277-6451, pp. 15-24
[2] FikretErcal, Anurag Chawla, William V. Stoecker, Hsi-Chieh Lee, and Randy H.Moss, “Neural Network
Diagnosis of Malignant Melanoma from Color Images”, IEEE Transactions on Biomedical Engineering. vol. 41, No. 9, 1994
[3] Siddiq Iqbal, Divyashree.J.A, Sophia.M, Mallikarjun Mundas, Vidya.R, “Implementation of Stolz’s Algorithm
for Melanoma Detection” , International Advanced Research Journal in Science, Engineering and Technology, June 2015 .
[4] Michael, M., Human Evolutionary Biology. Cambridge University Press, 2010: p. 192–213.