Sharif University of Technology
Scientia IranicaTransactions B: Mechanical Engineering www.scientiairanica.com
3D-1D simulation of ow in Fontan operation: Eects
of antegrade ow on ow pulsations
M. Monjezi
a, S.M. Ghoreyshi
a, M.S. Saidi
a;, M.A. Navabi
band B.D. Firoozabadi
a a. School of Mechanical Engineering, Sharif University of Technology, Tehran, Iran.b. Department of Pediatric Cardiac Surgery, Imam Hospital, Children's Medical Center, Tehran University of Medical Sciences, Tehran, Iran.
Received 5 September 2012; received in revised form 4 November 2013; accepted 3 February 2014
KEYWORDS Fontan operation; Total cavopulmonary connection (TCPC); Computational Fluid Dynamics (CFD); Flow pulsations; Antegrade Flow (AF).
Abstract. This study considers blood ow in total cavopulmonary connection (TCPC) morphology created in Fontan surgical procedure in patients with a single ventricle heart disease. Ordinary process of TCPC operation reduces pulmonary blood ow pulsatility since the right ventricle being bypassed. This reduction may limit the long term outcome of Fontan circulation. There is an idea of increasing pulmonary ow pulsations by keeping Main Pulmonary Artery (MPA) partially open while it was closed in ordinary TCPC operation. The purpose of the present study is to verify the eects of Antegrade Flow (AF) coming through stenosed MPA on pulmonary ow pulsations. The 3D geometry is reconstructed from CT angiography scan of a patient who has undergone an ordinary TCPC procedure. The stenosed MPA or Pulmonary Stenosis (PS) is virtually added to the original geometry. We applied a 3D-1D coupled method to simulate blood ow in this situation more precisely. The results show that adding AF increases Pulsatility Index (PI) in both Left and Right Pulmonary Artery (LPA and RPA respectively). Moreover, adding AF leads to an increase in energy loss. It also increases the pulmonary-to-systemic ow ratio leading to increase in total cardiac ow rate and hence heart power.
© 2014 Sharif University of Technology. All rights reserved.
1. Introduction
In 1971, Fontan and Baudet introduced a new surgery for palliation of single ventricle heart disease [1]. Since then, the original method of the Fontan surgery has gone through lots of numerical and experimental in-vestigations and has been revised for several times. Nowadays, the best modication of Fontan surgery is the total cavopulmonary connection (TCPC), which is used as the most promising treatment for the single ventricle patients. In the process of TCPC, superior and inferior vena cava (SVC and IVC, re-spectively) get connected directly to the Right
Pul-*. Corresponding author. Tel.: 021-66165558; Fax: 021-66000021
E-mail address: [email protected] (M.S. Saidi)
monary Artery (RPA), and right atrium and ventricle get bypassed [2]. Since the right ventricle does not pump the blood ow to the lungs anymore, the blood stream should have enough pressure head to reach the lungs and return to the heart. So, there is a crucial challenge to reduce the pressure and energy losses along the created path. Many articles have been published in this area, considering eects of dierent geometrical congurations on ow patterns and energy losses [3-9]. Marsden et al. [10] and Yang et al. [11] proposed that pressure drop and energy lost could be reduced signicantly by utilization of a Y-shaped graft. The Y-Y-shaped graft has been added to the IVC for leading the IVC ow to combine with SVC ow, directionally. Their studies demonstrated that Y-shaped geometry could be a good replace-ment for T-shaped geometry in order to reduce the
pressure lost and also for better ow distribution in TCPC.
Bypassing the right atrium and ventricle causes a major reduction of pulsatility of pulmonary blood ow. This reduction may lead to an increase in pulmonary vascular resistance that could limit the long term outcome of Fontan circulation in grown children [12]. To create pulsation in Fontan circulation, much eort has been done. Back in 1985, Guyton and his colleagues created pulsatility by intermittent abdominal compression for failing Fontan patients [13]. Later, atrial cardiomyoplasty was performed in exper-imental model with Fontan circulation by wrapping latissimus dorsi over right atrium [14]. In 2003 Brown et al. [15] from Indiana used an axial ow pump in Fontan circulation in animals. Although his group demonstrated in their animal models that axial ow pump can be useful for Fontan circulation, it causes hemolysis and also venous pathway obstruction due to thrombogenesis. The same group has designed a three bladed propeller pump to provide cavopulmonary assist in failing Fontan [15,16].
There is an idea for increasing the pulsation of blood ow in Fontan surgery. It oers to maintain a little blood stream through Main Pulmonary Artery (MPA), which is called restrictive antegrade pulsatile ow. Since in most single ventricle patients, there is a high pressure blood behind the pulmonary valve, it could make a pulsatile ow through Pulmonary Stenosis (PS) and increase pulsatility of pulmonary blood ow. Several studies advocated the potential benet of leaving pulsatile sources of antegrade pul-monary blood ow after bidirectional cavopulpul-monary anastomosis (BCPA) procedure [17-19]. Wal et al. [20] represented that mean pulmonary artery pressure and oxygen saturation with accessory pulsatile ow were signicantly higher and no pulmonary hypertension developed. They showed that long term survival follow-ing Fontan with accessory pulsatile fow is signicantly better than conventional Fontan and associated with better pulmonary artery growth. However, Fontan patients are still susceptible to numerous, long-term complications.
The present study intends to verify the im-pacts of antegrade ow on ow properties in Fontan surgery, using Computational Fluid Dynamics (CFD). A patient-specic geometry is considered with and without PS, and blood ow is simulated numerically in four dierent levels of stenosis. The pulmonary arteries are connected to LPA and RPA. As a result, it is required to model pulmonary arteries in order to obtain the outlet boundary condition of LPA and RPA. In addition a 1D model is developed to model pulmonary arteries. Consequently a coupled 3D-1D method is employed in contrast to previous work of Ghoreyshi et al. [21] without considering downstream
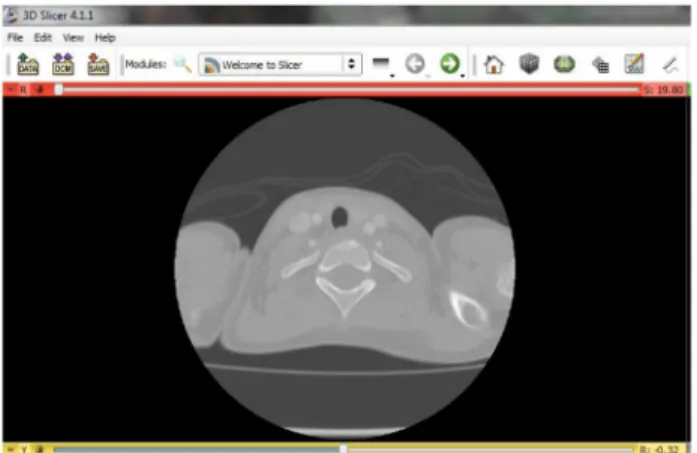
Figure 1. CTA images with 3D slicer.
arteries. The parameter which measures the ow pulsatility in a vessel is Pulsatility Index (PI), dened as (Q max Q min)=Qmean in which Q represents the blood ow rate [22]. The objective of this study is to investigate the impact of increased antegrade ow on blood ow pulsatility. A comparison of PIs illustrates the inuence of antegrade ow on increasing pulmonary ow pulsations. Moreover, the eects of AF on ow patterns, energy losses, and heart work are considered in the current study.
2. Materials and methods
CTA images of a 9-year-old girl undergone a regu-lar Fontan operation was used. We had 275 cross sectional slides with 0.6 mm distances which covered a 16*16*16 cm area of the patient's thorax. The resolution of the images was 96*96 dpi. CTA slides are imported to 3D Slicer software package (see Figure 1) for segmentation and the result is a highly accurate 3D model of the patient's anatomy. For 3D ow simulation, the in-house code Rayan [23] is used. Also a separate code is used for 1D modeling.
3. The model
3.1. Governing equations
A compliant model of the whole pulmonary tree was developed. It comprises a 3D model of the TCPC region embedded in a 1D representation for the rest of the pulmonary tree. The governing equations for the 1D portion of the pulmonary system are derived from a reduced Navier-Stokes equation previously described for arterial ow by [24,25]. Then, the following 1D uid momentum equation is applied:
@u @t + u
@u @x +
1
@p @x =
r
@ @r
r@u@r
; (1)
where u is the velocity in the streamwise direction, t is time, is the density, is viscosity and r is measured along the radius of the vessel. The other equation is
the continuity equation: @(Au)
@x + @A
@t = 0; (2)
where A is the cross section area.
To close this system of equations, we use the state equation:
A = A0
1 p2; (3)
where is inversely related to the vessel compliance and is given by the following equation:
= 43Ehr
0 ; (4)
with r0 as the root radius of vessel, E the elastic
modulus and h the wall thickness. To estimate the value of , the relation recommended by Olufsen [26] is used.
For TCPC region we consider a patient-specic morphology obtained from CT Angiography (CTA) scan images of a patient's (9-year-old girl) thorax, after an extracardiac fenestrated TCPC operation. The lo-cal 3D uid dynamics in this region was described using the 3D time-dependent Navier-Stokes and continuity equations for incompressible Newtonian uids:
@u
@t + (u:r)u = rp + 2r:"(u); (5)
r:u = 0; (6)
where u represents the velocity vector (u = [u; v; w]), p is the air pressure, "(u) is the stress tensor and is the dynamic viscosity. Blood is assumed as a Newtonian, incompressible uid with = 1060 kg/m3and
=3.5E-3 Pa.s [8]. Flow regime is assumed laminar due to low Reynolds number (about 1300). Also, we have employed a rigid wall approximation.
3.2. Boundary conditions
There are three inlet boundaries (SVC, IVC, and PS) in the current model. Velocity inlet boundary condition is applied on all of these boundaries. For IVC and SVC, echocardiography data (Doppler ow pattern) of the same patient in quiet inspiration condition is used. These data show velocity variations for the center points of IVC and SVC inlets in a cardiac cycle. The 6th order curve t is selected because it is the lowest order polynomial which ts that prole very well. Moreover, since SVC and IVC are long vessels and ow pulsatility is low in this region, the velocity distribution on SVC and IVC inlet is assumed fully developed [6,8]. Figure 2 shows IVC and SVC ow rate variations during a cardiac cycle. The average
Figure 2. IVC and SVC ow rate proles in a cardiac cycle versus lit/min.
ow rate and pulsatility index of each prole is shown as well.
Velocity inlet boundary condition is also used at PS. Since the physiological data are not available on this boundary, we use the left ventricular pressure cycle to approximate velocity changes on PS. This is based on the assumption of a linear relationship between ow rate and pressure gradient in PS, and low impact of AF on pulmonary pressure. So, PS velocity prole is similar to the left ventricular pressure, except that uid keeps owing only when ventricular pressure is more than pulmonary pressure. At other times, a one-way valve (pulmonary valve) prevents uid ow. Finally, the inlet velocity prole is scaled according to the PS desired ow rate. Moreover, since high pressure blood from heart passes through the pulmonary valve and enters the TCPC domain, the velocity distribution is assumed to be uniform at the PS inlet surface. Moreover, the no-slip boundary condition is applied at the vessel walls.
LPA and RPA boundaries are set as pressure outlet. The pulmonary arteries are connected to LPA and RPA. As a result, we use 1D model of pulmonary arteries in order to obtain the outlet boundary condi-tion of LPA and RPA.
3.3. 3D-1D coupling
A schematic representation of the coupled 3D-1D model is shown in Figure 3. One important issue in this simulation is the procedure used for establishing the coupling between the 3D and 1D model. This goal can be achieved by using the following algorithm [26]:
1. First, the 3D model is solved by prescribing the inlet velocity conditions and the pressure at both outlets provided by the 1D model (at the rst step,
Figure 3. Illustration of the coupled 3D-1D model.
it is suitably initialized). The model provides the value of ow rate at each outlet.
2. By means of the computed ow rate at the outlet of the 3D model in the previous step, we are able to specify the inlet pressures of 1D model. Actually a separate code is written to compute blood ow and pressures in 1D model. This code is modied to give us the inlet pressure as a function of inlet ow rate in 1D model.
3. Using this function at each time step we can correct the outlet pressure of 3D region. We compare the values of pressures at the interface of 1D and 3D models and in case of any dierence between the results, the pressures are corrected accordingly and we return to the rst step until coupling is established within a tolerance.
This algorithm is used at each time step to achieve the complete coupling.
4. Numerical approach 4.1. The 3D model
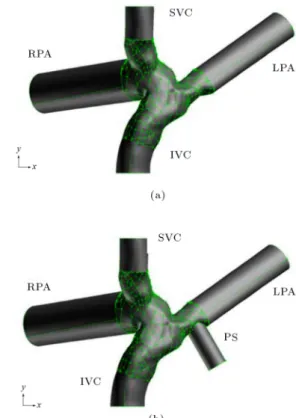
Figure 4(a) shows the reconstructed three dimensional geometry of TCPC. As shown, inlets and outlets are extended virtually in order to minimize the eects of boundary conditions on the upstream ow pat-terns. SVC and IVC inlets are extended to elliptical sections in order to provide smooth edges at the boundaries.
Figure 4. TCPC congurations: a) Without PS; and b) with PS.
Since MPA gets closed in the process of Fontan surgery, there is no PS in the regular TCPC geometry. The PS location is a characteristic of a patient specic geometry. In fact, PS is nothing but a stenosed pulmonary artery which has a denite location in each patient. We added the virtual PS in the location of the patient's MPA which has got closed during the surgery. So, in order to verify the AF eects, a cylindrical PS is virtually added to the available anatomical data. The use of cylindrical shape for the PS is for generalization and simplicity of the solution. Also, since the real stenosed MPA does not exist in this case, the cylindrical shape would be the best approximation for the PS geometry.
Figure 4(b) shows the geometry of TCPC with added PS. As shown, the middle part of the geometry is made of lots of small surface patches, combined together, making vessel walls. But the inlet and outlet extensions are continuous surfaces. In the process of mesh generation, rst, a structured (Hex/Wedge) grid is developed on each extension, based on a boundary layer mesh on vessel walls. Then, based on this structured grid, an unstructured (Tet/Hybrid) grid is generated on central part of the body. Having started with a boundary layer and a structured mesh on extensions, the unstructured central grid will be ner near the walls, which improves the mesh quality. For the numerical solution of the 3D ow problem the nite volume method was applied.
4.2. The 1D model
The small arteries connected to LPA and RPA are mod-eled as binary asymmetric structured trees attached at the terminals of LPA and RPA (see Figure 3). The structured tree is constructed such that it is geomet-rically self-similar. All parameters can be specied in terms of the vessel radius. Each of the vessels within the structured trees is modeled as a straight segment of compliant vessel. Unlike the large arteries, the structured trees do not mimic the actual geometry of the vessels, but are based on general statistical relationships which are estimated from literature data. According to [27] we continue to use the structured tree outow condition as described by Olufsen [23]. So, it is reasonable to assume that the parameters which determine branching structure including the branching exponent, xi, the asymmetry ratio and the area ratio are similar to systemic parameters and are = 2:70, = 0:9 and = 1:16. By this algorithm we can nd diameter of vessels in each generation. According to [28] and knowing that the number of terminal vessels is approximately equal to that of order 8, minimum vessel diameter before entrance to pulmonary region is 0.51 mm. Hence the structured tree is continued until the vessel diameter became smaller than 0.51 mm.
After determining diameters, we can compute length of vessels using length to diameter ratio [28]. Although geometry of vessels varies from patient to patient, but using this procedure we have found a struc-tured tree which could describe the average geometry of downstream vessels with acceptable accuracy.
In order to describe the boundary conditions, we considered a tree with only three branches. Consider-ing a bifurcation point, three conditions are needed to close the system of equations at this point. Let the Subscripts p, d1 and d2 denote the parent and two
daughter branches, respectively. The rst condition can be achieved from the continuity equation by as-suming that there is no leakage at the bifurcations as: Qp(l) = Qd1(0) + Qd2(0): (7)
The remaining conditions are found by assuming that static pressure is continuous across the bifurcation, that is:
pp(l) = pd1(0) = pd2(0): (8)
For any Fourier mode, the frequency dependent impedance, obtained by the structured tree model, can be related to pressure and ow by:
P (x; !) = Q(x; !):Z(x; !); (9) where we have used the terminology of electrical net-works, with P playing the role of voltage and Q the
role of current. Because the inow boundary condition is periodic we assume that ow and pressure can be expressed using complex periodic Fourier series.
By dening impedance based on the ratio of the pressure drop to the ow rate in the frequency domain and dividing Eq. (7) to Eq. (8), a standard bifurcation condition is obtained, which is a relation between the end impedance of the parent tube and the start impedance of daughter tubes, given by:
1 Zp(l) =
1 Zd1(0)+
1
Zd2(0): (10)
The start impedance of each individual branch is then computed by summing the end impedance of the tube and its impedance obtained as:
Z(0) = Ztube+ Z(L): (11)
The impedance at the root of the distal part is equal to the impedance of acinar region.
As a rst estimation for impedance of each tube, by considering only viscous resistance, one may use:
Ztube= 8lr4
0 : (12)
Starting from the terminal vessels and moving upward, the impedance at each tube inlet will be approximated. In order to obtain the total impedance of a specic tree, the impedances are summed in series and parallel.
Details of nding the impedance of vessels smaller than 0.51 mm are similar to those described here for pulmonary vessels but pretty simpler because in this region we can neglect the convection term of momen-tum equation and use the Womersley's solution [25].
By calculating the impedances and knowing the rate of inlet ow to the tree, the volume ow rate and outlet pressure of each tube can be found according to:
Qd1=Z QpZd2(0)
d1(0) + Zd2(0); (13)
Qd2=Z QpZd1(0)
d1(0) + Zd2(0); (14)
Pp(L) = QpZp(L): (15)
Fourier transform of ow rate is used in these equations and nally by inverse Fourier transform we have real boundary conditions in the time domain.
Now, using the boundary conditions (13)-(15), we can solve Eqs. (1)-(3) for each tube. After solving 1D Navier-Stockes equations, the tubes impedances as the ratio of volume ow rate to the pressure drop are again computed and corrected until the convergence in each time step is achieved. By this procedure at each time step the inlet pressure of 1D region is computed.
4.3. Implementation
The whole model was computationally implemented in a numerical framework with in-house code, Rayan. Steady state results are used as the initial conditions of unsteady solution. One cardiac cycle of the patient is 0.57 seconds. Each cycle is divided into 120 time steps with time step size of 0.00475 seconds. In order to assure that ow reaches pure pulsatile regime, the calculations are performed for three cardiac cycles, then the results are saved in the 4th cycle.
5. Flow conditions
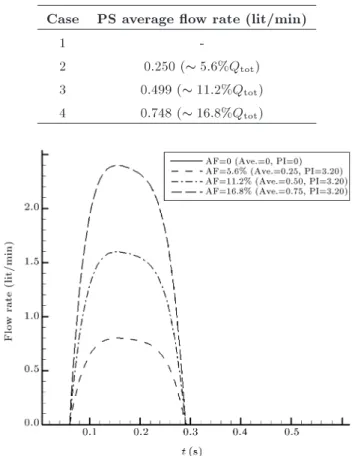
Flow is simulated in four cases in which the average AF increases gradually by increasing the amount of stenosis or the diameter of the PS. The average AF increases from 0 to 16.8% of systemic ow by the amount of 5.6% for each case. The ow rate of each case is expressed in Table 1. Geometry of the TCPC with PS is used in these cases. Figure 5 shows proles of PS ow rate in a cardiac cycle.
6. Results
6.1. Grid and method study
Some introductory solutions in steady state conditions are performed to assure independence of the results
Table 1. Average values of AF in each case. Case PS average ow rate (lit/min)
1
-2 0.250 ( 5:6%Qtot) 3 0.499 ( 11:2%Qtot) 4 0.748 ( 16:8%Qtot)
Figure 5. PS ow rate proles with PS.
from the grid size. Four grids with dierent sizes are developed in order to attain the optimum size.
Velocity magnitude on a cross line on LPA branch in the critical area is studied on these grids. By comparison of velocity proles, a grid size of 0.4 mm and approximately 1,620,000 elements is selected as the solution grid.
In the same way, the eect of discretization method of convective term of momentum equation is studied. The 2nd order upwind is selected as the discretization method of convective term of momentum equation.
6.2. The eects of AF on pulmonary ow rates
The ow rate portions of LPA and RPA of total inlet ow (summation of IVC, SVC and PS) remain approximately constant (49/51) by increasing the AF. This can be explained due to ow patterns. AF causes SVC and IVC streamlines to skew toward RPA. This is because of ow separation at the entrance of PS ow to LPA, which creates a low velocity zone and ow vortices. This causes a part of IVC and SVC ow to change path toward RPA. Although AF enters LPA, it makes a part of IVC and SVC ow lean toward RPA and it decreases LPA portion of IVC and SVC ow. So although AF enters LPA, LPA portion of total ow rate remains constant by increasing AF.
Figure 6 shows the calculated ow rates of LPA and RPA for each level of stenosis. As seen, the average ow rate at RPA is larger than LPA. It can easily be justied by larger diameter of RPA and consequently smaller resistance of right pulmonary region.
We split the cardiac cycle into three parts. The rst period is before the AF starts owing. In this period all cases show the same rates of ow, as expected. The second period starts when uid starts owing in PS. In this period, LPA and RPA ow rates increase with the increase of average AF. The third period starts when the AF stops again. In this period all cases show approximately same rates of ow.
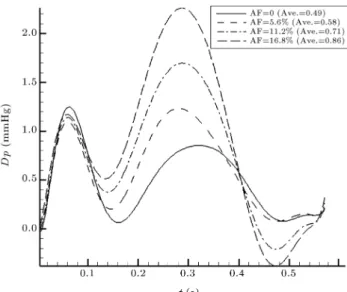
Figure 7 shows pressure dierences between RPA and LPA. As we can see with increasing AF, pressure dierence between LPA and RPA is increasing. 6.3. The eects of AF on pulmonary ow
pulsation
Now, we consider the eects of AF on pulsatility indices of LPA and RPA ow. Figure 8 shows PI changes of LPA and RPA in dierent level of stenosis.
As it can be seen, PI of both LPA and RPA increases with increase of average AF. This increase is almost linear in RPA, but in LPA it has a change of slope in linear relation with AF. PI values in LPA are smaller than RPA. One reason is the larger value of RPA ow portion. According to Figure 8, PI of LPA
Figure 6. Calculated ow rates at the outlet boundaries: a) LPA; and b) RPA.
Figure 7. Variation of pressure dierence between RPA and LPA.
Figure 8. PI changes of LPA and RPA for dierent AFs.
in AF level of 11.2% is almost 1.5 times larger than the case without PS. This shows a considerable eect of antegrade ow on pulmonary ow pulsations. Result of 3D-1D model shows that LPA and RPA portions for each level of AF are unchanged. In contrast to 3D model in which LPA portion by increasing AF is decreased due to decrease of its ow rate after stopping AF. According to the above discussion, in 3D-1D model, LPA ow is not decreased after AF stopping; hence average ow rate of LPA is increased and portion of LPA from total ow rate is almost constant.
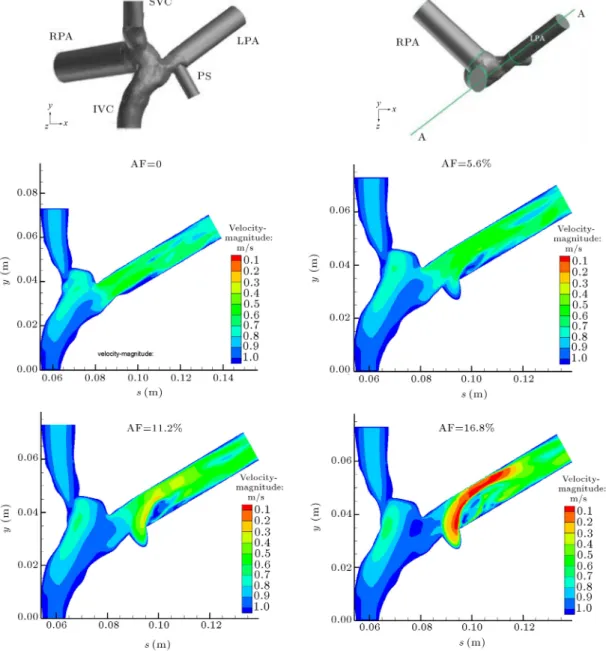
6.4. Flow patterns
Figure 9 shows the velocity magnitude contours and two dimensional streamlines at plane AA. These plots are related to the time t = 0:15 second in which AF has the largest value. As it has been shown, AF causes SVC and IVC streamlines to lean toward RPA. This is because of ow separation at the entrance of PS ow to LPA, which creates a low velocity zone and ow vortices. As a result, resistance of LPA against the blood ow increases. This causes a part of IVC and SVC ow to change path toward RPA. This event explains why LPA portion of ow decreases with increase of AF. Although AF enters LPA, it makes a part of IVC and SVC ow lean toward RPA and it decreases LPA portion of total ow. The other phenomenon was the decrease of LPA ow rate in the third part of cardiac cycle. This could be explained by leaning of IVC and SVC ow toward RPA too. When AF stops, ow does not change path right away. So when AF stops, that part of IVC and SVC ow takes a little time to turn back toward LPA. As a result, LPA ow rate in the third part of the cycle is less than the case without PS.
Figure 9. Velocity magnitude contours and streamlines at plane AA.
AF goes toward LPA. This ow is from the heart and has high density of oxygen. So, the blood ow going through LPA might have a little more concentration of oxygen.
6.5. The eects of AF on pulmonary pressures One concern in this surgery is vinous return pres-sure. Increasing venous pressure translates into higher pressures in the lymphatic system and subsequent development of chylothorax. We have examined this phenomenon in our simulation. The pressure values are reported in Figure 10 which shows that IVC and SVC increased pressures are approximately 1 mmHg. This result is agreed with experimental evidence [20], because the PA ow rate does not exceed 16.8% of systemic ow rate. Therefore, there is low concern about increased pressure.
6.6. Energy losses
For examining total energy loss in ow eld, we have to subtract the inlet ow energies from the outlet ones. Ignoring gravity, the rate of energy transmitted by uid ow originates from static and dynamic pressures, and is computed as:
_Ei= (pstat+ pdyn)iQi: (16)
In this equation, the index i represents the correspond-ing boundary, Q is the ow rate, and pstat and pdyn
are static and dynamic pressures, respectively. pdyn
represents the Kinetic Energy (KE) of the uid ow. So, the rate of total energy loss in the ow eld is derived as below:
Figure 10. Pressures on boundaries for all models by reference of LPA.
Figure 11. Power loss in TCPC region during a cardiac cycle for dierent AFs.
+(pstat+pdyn)psQps (pstat+pdyn)lpaQlpa
(pstat+ pdyn)rpaQrpa: (17)
Figure 11 shows the changes of power loss in a cardiac cycle for all models.
There are two major changes in power loss when AF starts and stops owing. It is because of sudden onset or cease of uid ow from PS. Figure 12 shows the average power loss in a cardiac cycle for all models. As shown, the average power loss increases with the increase of AF with a parabolic relationship. The average energy loss in TCPC region without PS is 4.41 mW while by adding 5.6%, 11.2% and 16.8% AF, it increases to 5.11, 6.93 and 10.02 mW.
Figure 12. Average power loss in TCPC region in a cardiac cycle for dierent AFs.
7. Discussion
As it has been illustrated, after Fontan surgery, pul-monary ow pulsations reduce considerably due to right ventricle being bypassed. This may cause side eects for patients and aect long term outcome of the operation. There is an idea to increase pulmonary ow pulsations by adding restrictive antegrade ow through stenosed pulmonary artery. This study aimed to consider the eects of adding AF on ow properties in general, and ow pulsations in particular, by numerical methods. A patient specic geometry reconstructed from CTA scan images of a person undergone a regular Fontan operation was used for this purpose. PS was assumed to be cylindrical and added to the geometry virtually. Inlet boundary conditions on IVC and SVC obtained from echocardiography data of the same patient. Velocity inlet prole on PS obtained from left ventricular pressure cycle, assuming linear relationship between ow rate and pressure gradient in PS.
Average ow spilt between two lungs is not predescribed. For this reason we used a 1D model of pulmonary vessels and coupled it with a 3D model.
Pressure outlet boundary condition is used on the LPA and RPA boundaries. It should be mentioned that the outow boundary condition cannot be used on these boundaries, because there are changes of ow split between two lungs during a cardiac cycle. These changes are due to SVC, IVC and PS ow changes during a cardiac cycle. Therefore, a constant value of ow split, as there is in outow boundary condition, cannot be used here. When pressure outlet boundary condition is used, since there are only two boundaries with denite pressures, the determinant parameter would be pressure dierence between LPA and RPA. The constant pressures applied on these boundaries
represent left and right lungs' resistances against the ow. Nevertheless, since the pressure dierence be-tween LPA and RPA is not necessarily constant during a cardiac cycle, assuming constant pressures on these boundaries may not be completely true. So, in order to reach a more precise boundary condition, pulmonary vessels can be coupled with TCPC in a multiscale method. The 3D-1D coupling of pulmonary vessels and TCPC would be selected here.
Flow is simulated in four dierent cases in which average AF increases gradually. Results show that PI of both LPA and RPA increase with increase of AF. PI increase in RPA is almost linear but in LPA, at rst, its rate of change is slow and then will be rapid demonstrating that by increasing AF, rate of increase of PI in LPA is more rapid.
The percentage of PI increase in LPA is about 140% in the last model. But, although the increase in PI is considerable compared to its initial value, it is still much less than normal PI value of pulmonary arteries, which is about 3. So, further studies are needed in order to verify that how much this amount of PI increase can help to improve physiological properties of pulmonary vessels.
Flow patterns show separation and vortices at the entrance of AF to LPA, which increases pressure loss in this area. As a result, energy loss in the whole eld rises. By adding PS of 16.8%, there is an increase of 57% in power loss compared to no PS case. This is an adverse eect to the idea of adding AF to the ow eld. Since in a Fontan patient, there is only a single ventricle circulating the blood, it is quite important to lessen the energy losses along the ow path. Increase in energy losses, which means an increase in vascular resistance, may cause a reduction in cardiac output, since ventricular pressure remains constant. Therefore, it is the price we are paying to increase the ow pulsatility. So, in order to obtain the best combination, this factor should be considered seriously.
Since the antegrade ow will be circulated exces-sively by the heart in the pulmonary vasculature, the excessive ow imposes an excessive load on the heart. It means that the addition of AF increases the heart work with respect to the total ow rate. We have to consider that the increase of heart ow rate and hence heart power is permanent and might aect the long term eciency of the operation.
Assuming blood ow for pulmonary Qp and
systemic Qs circulation, in a patient with pulsating
TCPC, the pulmonary-to-systemic ow ratio Qp=Qs
increases. Imbalances of pulmonary to systemic blood ow ratio Qp=Qs results in inadequate systemic
oxy-gen delivery and mortality after surgery. Photiadis et al. [29] found that Qp=Qs of 1.5 has maximum
oxygen delivery, optimal hemodynamic status and
end organ function and higher survival for Fontan patients.
In order to gain the optimum value of PS ow rate, one can consider both heart power increase and Qp=Qsratio.
8. Conclusion
We conclude that adding antegrade ow leads to an increase in pulsations of pulmonary ow after Fontan operation. This increase is seen in both pulmonary arteries as well, but it is relatively higher in RPA. Although the increase in PI is considerable compared to its initial value, it is still much less than normal PI value of pulmonary arteries. So, further studies are needed to verify the impact of PI on physiological properties of pulmonary vessels. On the other hand, power loss in ow eld increases with the addition of AF. This means an increase in vascular resistance which may reduce cardiac output. Moreover, adding AF increases pulmonary-to-systemic ow ratio, which leads to decrease oxygen delivery. Since, the patient's heart has only one pumping chamber, the excessive ow imposes an excessive load on the heart. It means that the addition of AF increases the heart work. In order to design the best conguration of TCPC and obtain the optimum value of antegrade ow, all these favorable and adverse eects should be considered together.
Acknowledgment
This work was supported by Iranian National Science Foundation (INSF) under grant number 89000153. We also acknowledge Dr. A. Kiani for processing echocardiography data.
References
1. Fontan, F. and Baudet, E. \Surgical repair of tricuspid atresia", Thorax, 26, pp. 240-248 (1971).
2. Marcelletti, C., Corno, A., Giannico, S. and Marin, B. \Inferior vena cava-pulmonary artery extracardiac conduit", J. Thorac. Cardiovasc. Surg., 100, pp. 228-232 (1990).
3. Kim, S.H., Park, Y.H. and Cho, B.K. \Hemodynamics of the total cavopulmonary Connection: An in vitro study", Yonsei Med. J., 38, pp. 33-39 (1997).
4. Dasi, L.P., Pekkan, K., Katajima, H.D. and Yo-ganathan, A.P. \Functional analysis of Fontan energy dissipation", J. Biomech., 41, pp. 2246-2252 (2008).
5. Hager, A., Fratz, S., Schwaiger, M., Lange, R., Hess, J. and Stern, H. \Pulmonary blood ow patterns in patients with Fontan circulation", Ann. Thorac. Surg., 85, pp. 186-191 (2008).
6. DeLeval, M.R., Dubini, G., Migliavacca, F., Jalali, H., Camporini, G., Redington, A. and Pietrabissa, R. \Use of computational uid dynamics in the design of surgical procedures: Application to the study of competitive ows in cavopulmonary connections", J. Thorac. Cardiovasc. Surg., 111, pp. 502-513 (1996).
7. Migliavacca, F., DeLeval, M.R., Dubini, G., Pietra-bissa, R. and Fumero, R. \Computational uid dy-namic simulations of cavopulmonary connections with an extracardiac lateral conduit", Med. Eng. Phys., 21, pp. 187-193 (1999).
8. Wang, C., Pekkan, K., DeZ'Elicourt, D., Horner, M., Parihar, A., Kulkarni, A. and Yoganathan, A.P. \Progress in the Cfd ing of ow instabilities in anatom-ical total cavopulmonary connections", Ann. Biomed. Eng., 35, pp. 1840-1856 (2007).
9. Dasi, L.P., Krishnankuttyrema, R., Kitajima, H.D., Pekkan, K., Sundareswaran, K.S., Fogel, M., Sharma, S., Whitehead, K., Kanter, K. and Yoganathan, A.P. \Fontan hemodynamics: importance of pulmonary artery diameter", J. Thorac. Cardiovasc. Surg., 137, pp. 560-564 (2009).
10. Bernstein, A., Reddy, V.M., Shadden, S.C., Spilker, R.L., Chan, F.P., Taylor, C.A. and Feinstein, J.A. \Evaluation of a novel Y-shaped extracardiac Fontan bae using computational uid dynamics", J. Thorac. Cardiovasc. Surg., 137(2), p. 394-403.e2 (2009).
11. Yang, E.G., Feinstein, J.A. and Marsden, A.L. \Con-strained optimization of an idealized Y-shaped bae for the Fontan surgery at rest and exercise", Comput. Meth. App. Mech. Eng., 199(33-36), pp. 2135-2149 (2010).
12. Ovroutski, S., Ewert, P., Alexi-Meskishvili, V., Holscher, K., Miera, O., Peters, B., Hetzer, R. and Berger, F. \Absence of pulmonary artery growth after Fontan operation and its possible impact on late outcome", Ann. Thorac. Surg., 87, pp. 826-31 (2009).
13. Guyton, R.A., Davis, S.C., Michalik, R.E., Williams, W.H. and Hatcher, C.R. Jr. \Right heart assist by intermittent abdominal compression after surgery for congenital heart disease", Circulation, 72, pp. 97-100 (1985).
14. Voss, B., Sack, F.U., Saggau, W., Hagl, S. and Lange, R. \Atrial cardiomyoplasty in a Fontan circulation", Eur. J. Cardiothorac. Surg., 21(5), pp. 780-6 (2002).
15. Rodefeld, M.D., Boyd, J.H., Myers, C.D., LaLone, B.J., Bezruczko, A.J., Potter, A.W. and Brown, J.W. \Cavopulmonary assist: circulatory support for the univentricular Fontan circulation", Ann. Thorac. Surg., 76, pp. 1911-6 (2003).
16. Throckmorton, A.L., Ballman, K.K., Myers, C.D., Frankel, S.H., Brown, J.W. and Rodefeld, M.D. \Per-formance of a 3-bladed propeller pump to provide cavopulmonary assist in the failing Fontan circula-tion", Ann. Thorac. Surg., 86, pp. 1343-7 (2008).
17. Yoshida, M., Yamaguchi, M., Yoshimura, N., Mu-rakami, H., Matsuhisa, H. and Okita, Y. \Appropriate
additional pulmonary blood ow at the bidirectional Glenn procedure is useful for completion of total cavopulmonary connection", Ann. Thorac. Surg., 80, pp. 976-81 (2005).
18. Gray, R.G., Altmann, K., Mosca, R.S., Prakash, A., Williams, I.A., Quaegebeur, J.M. and Chen, J.M. \Persistent antegrade pulmonary blood ow post-glenn does not alter early post-Fontan outcomes in single-ventricle patients", Ann. Thorac. Surg., 84, pp. 888-93 (2007).
19. Berdat, P.A., Belli, E., Lacour-Gayet, F., Planche, C. and Serraf, A. \Additional pulmonary blood ow has no adverse eect on outcome after bidirectional cavopulmonary anastomosis", Ann. Thorac. Surg., 79, pp. 29-36 (2005).
20. van de Wal, H.J.C.M., Ouknine, R., Tamisier, D., Levy, M., Vouhe ^A, P.R. and Leca, F. \Bi-directional cavopulmonary shunt: Is accessory pulsatile ow, good or bad?", Eur. J. Cardiothorac. Surg., 16(2), pp. 104-110 (1999).
21. Ghoreyshi, M., Saidi, M., Navabi, M.A., Firoozabadi, B.D. and Shabanian, R. \Numerical investigation of antegrade ow eects on ow pulsations in Fontan operation", International J. Biomedical Engineering and Technology, 10(3), pp. 221-238 (2012).
22. Klimes, K., Abdul-Khaliq, H., Ovroutski, S., Hui, W., Alexi-Meskishvili, V., Spors, B., Hetzer, R., Felix, R., Lange, P.E., Berger, F. and Gutberlet, M. \Pulmonary and caval blood ow patterns in patients with intrac-ardiac and extracintrac-ardiac Fontan: A magnetic resonance study", Clinical Research in Cardiology, 96, pp. 160-167 (2007).
23. Sani, M. and Saidi, M.S. \Rayan: A polyhedral grid co-located incompressible nite volume solver (Part I: basic design features)", J. Scientia Iranica, Transac-tions B, 17(6), pp. 443-455 (2010).
24. Olufsen, S. \Modeling the arterial system with ref-erence to an anesthesia simulator", Ph.D. Thesis, universitas roskildensis (1998).
25. Olufsen, M.S., Peskin, C.S., Kim, W.Y., Pedersen, E.M., Nadim, A. and Larsen, J. \Numerical simulation and experimental validation of blood ow in arter-ies with structured-tree outow conditions", Anna. Biomed. Eng., 28, pp. 1281-1299 (2000).
26. Formaggia, L. and Veneziani, A., Geometrical Mul-tiscales for the Cardiovascular System, ABIOMED Lecture Notes (2005).
27. Vaughan, G.D.A. \Pulse propagation in the pulmonary and systemic", PhD Thesis, University of Glasgow (2010).
28. Huang, W., Yen, R.T., McLaurine, M. and Bledsoe, G. \Morphometry of the human pulmonary vasculature", J. Appl. Physiol., 81, pp. 2123-2133 (1996).
29. Photiadis, J., Sinzobahamvya, N., Fink, Ch., Schnei-der, M., Schindler, E., Brecher, A.M., Urban, A.E. and Asfour, B. \Optimal pulmonary to systemic blood ow ratio for best hemodynamic status and outcome
early after Norwood operation", Eur. J. Cardiothorac. Surg., 29, pp. 551-556 (2006)
Biographies
Mojdeh Monjezi obtained her BS and MS degrees at Isfahan University of Technology, Iran, and is currently a Ph.D. degree candidate at the Center of Excellence in Energy Conversion in the School of Mechanical Engineering, Sharif University of Technology, Tehran, Iran. Her research interests are biouid simulation, modeling of particle transport and respiratory systems and aerosol dynamics.
Seyed Mostafa Ghoreyshi obtained his BS and MS degrees respectively at Tehran University and Sharif University of Technology, Tehran, Iran. His research interests are biouid simulation specially modeling of cardiovascular system.
Mohammad Said Saidi is Professor of Mechani-cal Engineering at Sharif University of Technology,
Tehran, Iran. His research interests include: modeling and numerical analysis of transport and deposition of aerosol particles, modeling and numerical analysis of biouids.
Mohammad Ali Navabi is a cardiovascular sur-geon at Shiraz University of Medical Science (1970-1982) MD - G/S, Tehran Heart Hospital (1982-1985) Card.Surg, Dusseldorf Uniklinik Germany (1985-1987) Card.Surg, The hosp. for sick Child. (GOS UK.) (1987-1989) Ped.Card.Surg, Shiraz University of Med-ical Science (since 1989) and Tehran University of Medical Science (since October 2000). His research interests are right heart bypass, international service and congenital heart surgery.
Bahar Dehghan Firoozabadi is Professor of Me-chanical Engineering at Sharif University of Technol-ogy, Tehran, Iran. Her research interests include: modeling and numerical analysis of biouids, particle laden ow and density current in settling tanks, and turbidity current in settling tanks and reservoirs.