Sharif University of Technology
Scientia IranicaTransactions A: Civil Engineering www.scientiairanica.com
Change point of river streamow in Turkey
C. Yerdelen
Department of Civil Engineering, Engineering Faculty, Ege University, 35100, _Izmir, Turkey. Received 2 April 2013; received in revised form 27 May 2013; accepted 9 September 2013
KEYWORDS Change point analysis; Streamow;
Hydrological change; Rivers of Turkey.
Abstract. The present study aims to determine the hydrological change-year by evaluating the homogeneity of average annual streamow data in Turkey. Pertaining to the years 1936-2005, change-year streamow data from 74 streamow gauging stations, which have no regulatory structure on the source side, and possessing a minimum of 39 years of data, from streamow gauging stations located on 26 streamow basins in Turkey, have been collected. By using the employed homogeneity tests, it has been attempted to detect the change year. Employed methods are the Buishand test, the Pettitt test, the Standard Normal Homogeneity test and the Von Neumann test. By comparing the results obtained from tests, it is aimed to detect the consistency of the change years in gauging stations. The change year could be detected in 16 gauging stations using three tests each every year, and 18 stations using 2 tests in the same year. It has also been ascertained that change years of streamow are geographically closer to each other in western Turkey in comparison to the east. The reason for values in the west to be closer, with respect to both location and time, might be attributed to the precipitation characteristics and uniformity of measured data.
c
2014 Sharif University of Technology. All rights reserved.
1. Introduction
Climate change corresponds to short or long term changes exhibited by climate indicators. This interval of change might vary between decades to millennia. This particular change can emerge upon the change of average values, as well as the widening gap of change between averages. Climate change can dier with respect to physically small territory to huge areas of land that might aect the entire earth. The studies aiming to use water resources eectively should focus on the changes in climate parameters. Climate changes might depend on several factors: natural changes on earth, industrialization, urbanization, land use and agricultural water usage, which increased after the 19th century. Data that is employed in hydrological modeling which is feasible for detecting climatic change *. Tel.: +90 232 3885163; Fax: +90 232 3425629
E-mail address: [email protected]
years will demonstrate more valid results. For the model studies to be implemented, it is known that the main resource is the accumulated hydrological-meteorological data [1,2]. In any issues concerning nature, the length and reliability of input parameters are directly proportional to the result.
In its statistical meaning, homogeneity implies that the series under inspection belongs to a main group, and, thus, has an average value that re-mains constant over the course of time. Nonetheless rapid changes witnessed in the mid-1900s brought forth the necessity to reexamine the homogeneity of hydrological-meteorological series. Changes experi-enced in streamow, which is one of the hydrological indicators, diminish homogeneity and cause eects that limit the validity of classical hydrological measure-ments. For instance, disruption of homogeneity in ood records undermines the reliability of predicting design oods. Changes in climate conditions or basins turn hydrological data into some kind of data
incom-patible with the modeling method to be employed. It is acknowledged that in hydrological analyses, the data series is stationary [3]. Due to meteorological, topographic and human-based changes, disruption of stationarity in hydrological data causes the failure of streamow predictions to reect reality and to obtain correct predictions. In order to detect the extent to which changes in physical processes aect data, the data need to be statistically tested. Provided that the eect of the changes in measured data is high, prior to conducting the analyses, this change should be taken into account. The planning and operation of any water structure can only be initiated upon a correct statistical analysis of streamow data. Hence, in all planning related to water streamow, data that contain input parameters bear great importance [4].
It is possible to investigate the existence of any change points in the series via statistical homogeneity tests [5]. To detect change points by investigating homogeneity, a number of non-parametric methods have been developed. The survey interval of these methods could be monthly, seasonal or annual. It is feasible to identify the change point by examining the homogeneity of a series. Four methods have been utilized towards this end: the Von Neumann Test (VNT), the Pettitt Test (PT), the Buishand Test (BT) and the Standard Normal Homogeneity Test (SNHT). These four methods, also utilized in various other elds, have provided brilliant results in homogeneity research (see, for example [5-14]). Of all these nonparametric methods, only the Von Neumann method identies if the series is homogenous, while other methods can also detect the change point of the series if there is one.
For a great number of meteorological indicators, both globally and in Turkey, statistical analysis has been employed in an attempt to detect the change points. Turkes [15] (1996) examined annual precipita-tion changes in Turkey, with respect to time and space, and detected the 1970 -1980 interval. By employing SNHT and an identical method, Alexadersson and Moberg [16] (1997) analyzed Swedish temperature data and compared the obtained ndings. Wijngaard et al. [11], in their 2003-dated research, examined the ho-mogeneity of the temperature and precipitation series for Europe and compared the methods with respect to research ndings. Xiong and Guo [17] (2004), by statistically analyzing annual streamow data, probed into trends and change points and detected that the change point in Yichang hydrologic station on the Yangtze River was in 1968. Mazvimavi and Wolski [18] (2006), in their study covering South Africa streamow between years 1924-2004, detected the change points as years 1973-74 and 1980-81. Toreti et al. [19] (2008) determined the change years of precipitation data in Italy that classied change years with respect
to geographical position. Rasol et al. [20] (2008) have studied temperature data in Croatia, and, by employing dierent methods, they obtained approx-imate change years. Costa and Soares [21] (2008), by conducting homogeneity research with precipitation data for South Portugal, drew a comparison between PT, BT and SNHT methods. Dikbas et al. [13] (2010), in their research based on temperature data in Turkey, determined 1976-1994 time interval as the change point. Gao et al. [22] (2010), in their trend-change point research conducted with streamow and sediment data between years 1950-2005, employed a variety of statistical methods, and for the four gauging stations on the Yellow River, China, detected change years as 1979 and 1985.
In the present study, the change point in the annual average streamow data in Turkish Rivers between years 1936-2005 has been examined. The key objective of research is to test the homogene-ity of streamow data and designate what kind of relation this homogeneity has with climate change. The focus has been on interpreting change points of annual streamow tested via dierent methods in Turkey, which possesses a vast surface area and rich water potential. Through this analysis, it is aimed to compare the applicability of the methods and see if there is any common (shared) change year for annual streamow averages. Findings obtained via methods employed in searching the change point of river stream-ow in Turkey have been compared with each other, and the consistency of the results has been analyzed. What distinguishes this particular research from other relevant studies is that the homogeneity tests utilized in identication of the change point have been applied, for the rst time, on all streamow gauging stations in Turkey. This method, previously applied to a variety of meteorological data, has been applied, for the rst time, on annual average streamow on the basis of the entire country.
2. Study area and data
The total area of Turkey is 783,562 km2, of which
755,688 km2 are in Southwest Asia and 23,764 km2
are in Europe. Turkey lies between latitudes 35 and
43N, and longitudes 25and 45E. The area situated
on the Asian continent is called Anatolia, which is a peninsula surrounded by sea on three sides: the Black Sea on its north side, the Mediterranean Sea on its south side and the Aegean Sea on its west side.
Turkey is located between a tropical climate belt and a temperate belt. However, on account of its geographical position and land forms, it is possible to witness a variety of climatic forms in Turkey. In coastal regions, the temperature is warmer due to the eect of the sea. The position of the mountains prevents
the passage of the warming eects of the sea towards the inner regions. Hence, a continental climate is prevalent throughout these regions. In coastal regions, precipitation takes the form of rainfall, whereas at inner and higher regions, it transforms into snow.
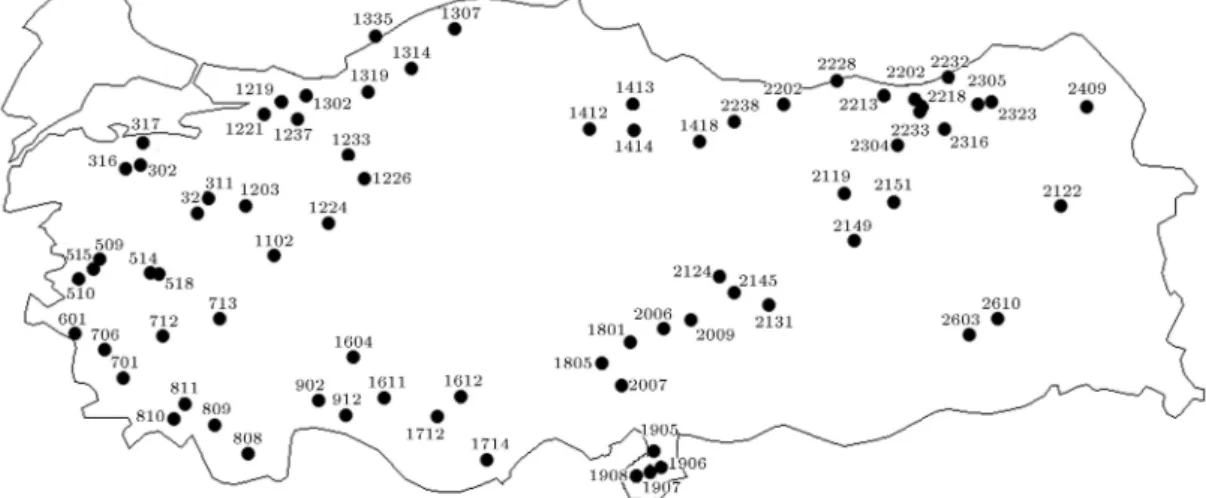
In this study, data obtained from streamow gauging stations operated by the State Hydraulic Works (DS_I) are utilized. With respect to its river streamow, Turkey is divided into 26 basins. Mea-surements initiated in 1935 are still in eect. In identication of the stations whose data will be em-ployed, particular care is rendered to see if there is any regulatory structure on the source side, if the measurement location remained stationary throughout the gauging process and if the data set had su-cient length. Hydro-climatologists are concerned with analyzing time series by concentrating on dierences in 30-year normal values during the whole period of recording [23]. This is why a period of 30 years is assumed sucient for a valid mean statistic. It also amounts to describing the hydro-climatic time series as non-stationary, with local periods of stationary [24]. Streamow data employed in the current study cover a minimum of 39 years, which is a sucient length of time to detect climatic changes, if there are any. Burn and Elnur [25] (2002) stated that the selection of stations in climate change research is substantial in the initial step, and that a minimum record length of 25 years ensures the validity of the trend results, statistically. 75 streamow gauging stations identied to possess these qualities have been marked with their numbers in Figure 1. In these 75 stations, annual average streamow is detected via monthly annual streamow. A closer look at the map in Figure 1 demonstrates that in the central and southeastern parts of the Anatolian peninsula, the number of stations is fewer compared to the other regions. This might be due to the fact that the Central Anatolian region is an endorheic basin. Available stations lack streamow series possessing
sucient length, whilst the Southeastern Region lacks unchanged raw data due to the implementation of large-size water projects.
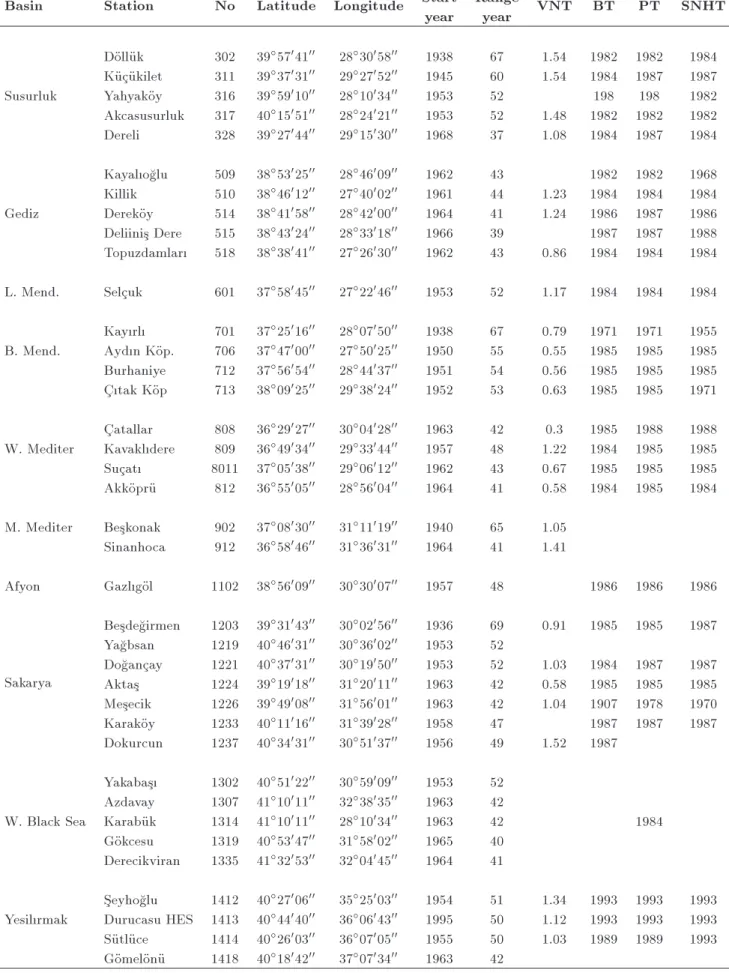
In Table 1, the positions of the stations em-ployed in these measurements and information on measurement records are summarized. The shortest measurement (39 years) has been recorded from the Dereli streamow gauging station (station no: 328) on the Susurluk Basin, and the longest measurement (70 years) from the Besdegirmen streamow gauging station (station no: 1203) on the Sakarya Basin and the Himmetli streamow gauging station (station no: 1801) on the Seyhan Basin. The records of stations from which research measurements have been gathered started in 1936 with 2 stations and reached 75 stations in 1968. In Figure 2, the annual increase of stations whose streamow data have been used is provided. In the streamow series of particular stations, there are minor level gaps, which are completed by the linear re-gression method, as done in some other studies [26-28]. 3. Methodology
The four methods selected in testing annual average streamow are the Buishand test [5], the Pettitt
Figure 2. Number of stations for the corresponding year.
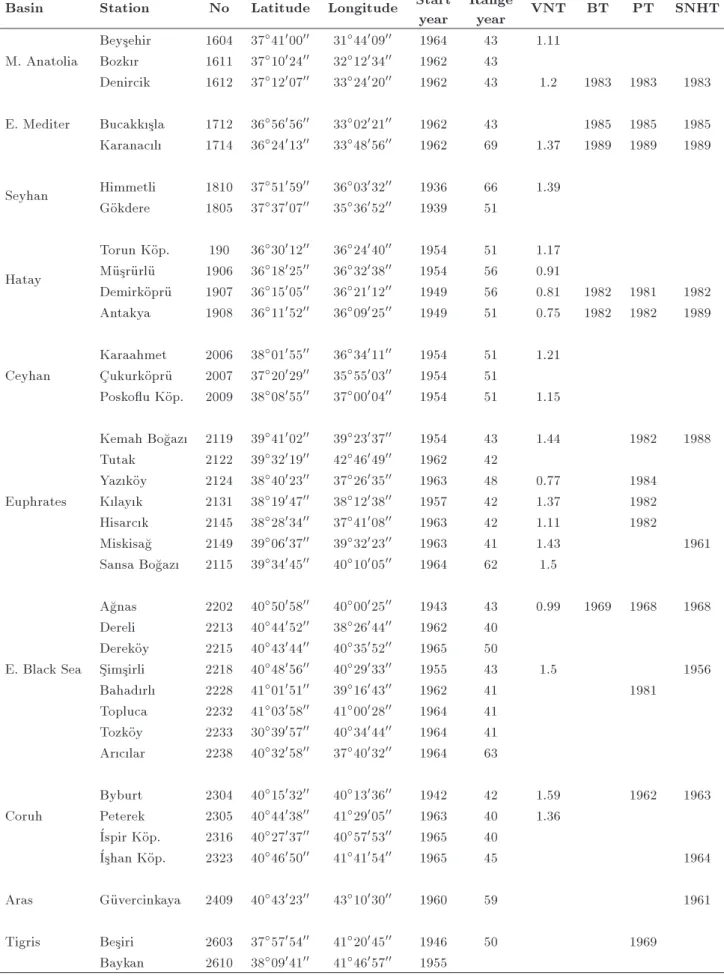
Table 1. Some facts of streamow gauging stations and change point analysis results.
Basin Station No Latitude Longitude Start
year
Range
year VNT BT PT SNHT
Dolluk 302 395704100 283005800 1938 67 1.54 1982 1982 1984
Kucukilet 311 393703100 292705200 1945 60 1.54 1984 1987 1987
Susurluk Yahyakoy 316 395901000 281003400 1953 52 198 198 1982
Akcasusurluk 317 401505100 282402100 1953 52 1.48 1982 1982 1982
Dereli 328 392704400 291503000 1968 37 1.08 1984 1987 1984
Kayaloglu 509 385302500 284600900 1962 43 1982 1982 1968
Killik 510 384601200 274000200 1961 44 1.23 1984 1984 1984
Gediz Derekoy 514 384105800 284200000 1964 41 1.24 1986 1987 1986
Deliinis Dere 515 384302400 283301800 1966 39 1987 1987 1988
Topuzdamlar 518 383804100 272603000 1962 43 0.86 1984 1984 1984
L. Mend. Selcuk 601 375804500 272204600 1953 52 1.17 1984 1984 1984
Kayrl 701 372501600 280705000 1938 67 0.79 1971 1971 1955
B. Mend. Aydn Kop. 706 374700000 275002500 1950 55 0.55 1985 1985 1985
Burhaniye 712 375605400 284403700 1951 54 0.56 1985 1985 1985
Ctak Kop 713 380902500 293802400 1952 53 0.63 1985 1985 1971
Catallar 808 362902700 300402800 1963 42 0.3 1985 1988 1988
W. Mediter Kavakldere 809 364903400 293304400 1957 48 1.22 1984 1985 1985
Sucat 8011 370503800 290601200 1962 43 0.67 1985 1985 1985
Akkopru 812 365500500 285600400 1964 41 0.58 1984 1985 1984
M. Mediter Beskonak 902 370803000 311101900 1940 65 1.05
Sinanhoca 912 365804600 313603100 1964 41 1.41
Afyon Gazlgol 1102 385600900 303000700 1957 48 1986 1986 1986
Sakarya
Besdegirmen 1203 393104300 300205600 1936 69 0.91 1985 1985 1987
Yagbsan 1219 404603100 303600200 1953 52
Dogancay 1221 403703100 301905000 1953 52 1.03 1984 1987 1987
Aktas 1224 391901800 312001100 1963 42 0.58 1985 1985 1985
Mesecik 1226 394900800 315600100 1963 42 1.04 1907 1978 1970
Karakoy 1233 401101600 313902800 1958 47 1987 1987 1987
Dokurcun 1237 403403100 305103700 1956 49 1.52 1987
Yakabas 1302 405102200 305900900 1953 52
Azdavay 1307 411001100 323803500 1963 42
W. Black Sea Karabuk 1314 411001100 281003400 1963 42 1984
Gokcesu 1319 405304700 315800200 1965 40
Derecikviran 1335 413205300 320404500 1964 41
Seyhoglu 1412 402700600 352500300 1954 51 1.34 1993 1993 1993
Yesilrmak Durucasu HES 1413 404404000 360604300 1995 50 1.12 1993 1993 1993
Sutluce 1414 402600300 360700500 1955 50 1.03 1989 1989 1993
Table 1. Continued.
Basin Station No Latitude Longitude Start
year
Range
year VNT BT PT SNHT
Beysehir 1604 374100000 314400900 1964 43 1.11
M. Anatolia Bozkr 1611 371002400 321203400 1962 43
Denircik 1612 371200700 332402000 1962 43 1.2 1983 1983 1983
E. Mediter Bucakksla 1712 365605600 330202100 1962 43 1985 1985 1985
Karanacl 1714 362401300 334805600 1962 69 1.37 1989 1989 1989
Seyhan Himmetli 1810 375105900 360303200 1936 66 1.39 Gokdere 1805 373700700 353605200 1939 51
Hatay
Torun Kop. 190 363001200 362404000 1954 51 1.17
Musrurlu 1906 361802500 363203800 1954 56 0.91
Demirkopru 1907 361500500 362101200 1949 56 0.81 1982 1981 1982
Antakya 1908 361105200 360902500 1949 51 0.75 1982 1982 1989
Karaahmet 2006 380105500 363401100 1954 51 1.21
Ceyhan Cukurkopru 2007 372002900 355500300 1954 51
Poskou Kop. 2009 380805500 370000400 1954 51 1.15
Kemah Bogaz 2119 394100200 392303700 1954 43 1.44 1982 1988
Tutak 2122 393201900 424604900 1962 42
Yazkoy 2124 384002300 372603500 1963 48 0.77 1984
Euphrates Klayk 2131 381904700 381203800 1957 42 1.37 1982
Hisarck 2145 382803400 374100800 1963 42 1.11 1982
Miskisag 2149 390603700 393202300 1963 41 1.43 1961
Sansa Bogaz 2115 393404500 401000500 1964 62 1.5
Agnas 2202 405005800 400002500 1943 43 0.99 1969 1968 1968
Dereli 2213 404405200 382604400 1962 40
Derekoy 2215 404304400 403505200 1965 50
E. Black Sea Simsirli 2218 404805600 402903300 1955 43 1.5 1956
Bahadrl 2228 410105100 391604300 1962 41 1981
Topluca 2232 410305800 410002800 1964 41
Tozkoy 2233 303905700 403404400 1964 41
Arclar 2238 403205800 374003200 1964 63
Byburt 2304 401503200 401303600 1942 42 1.59 1962 1963
Coruh Peterek 2305 404403800 412900500 1963 40 1.36
Ispir Kop. 2316 402703700 405705300 1965 40
Ishan Kop. 2323 404605000 414105400 1965 45 1964
Aras Guvercinkaya 2409 404302300 431003000 1960 59 1961
Tigris Besiri 2603 375705400 412004500 1946 50 1969
test [7], the Standard Normal Homogeneity test [8] and the Von Neumann test [6]. Null hypothesis (H0) assumes that the analyzed series are homogenous, while the opposite condition is an alternative hypothesis (H1). For BT, PT and SNHT, null hypothesis obtains the year when the homogeneity of annual average streamow is disrupted; VNT only detects if or not the series are homogenous. Despite their similarities, three tests locating the change point exhibit certain varia-tions. In his 2003-dated work, Wijngaard et al. [11] reported that SNHT is more sensitive in detecting change points in the beginning and end of a series, while PT and BT are more sensitive in detecting change points in mid series. Also, while BT and SNHT assume that the series is in normal distribution, there is no such acknowledgment in PT.
3.1. Buishand test
In his 1982-dated article, Buishand [5] stated that in the investigation of the homogeneity of any series, it is feasible to manipulate this method. In this method, suggested by Buishand for the x series, adjoint partial summations are calculated:
S0
k = ki(Xi X) 2; k = 1; 2; :::; N; So0 = 0:
In the event that time series (Xi) exhibits deviations
around averages, the series is homogenous, and, in that case, S0
k values shall oscillate around zero. In the event
that a fracture takes place in year k, the value of S0
k reaches a maximum or minimum value. Rescaled
adjusted partial sums are obtained by dividing S0 k by
the sample standard deviation: S00
k = Sk0=Sd;
where Sd is the standard deviation,
Sd= Ni (Xi X) 2=N:
A statistic which is sensitive to departures from homo-geneity is:
Q = max0kNjSk00j:
High values of Q are an indication of a change in level. Critical values for the test statistics can be found in Table 2 [5].
3.2. Von Neumann test
Von Neumann is a nonparametric test where the statis-tic is dened as the ratio of the mean square successive (year-to-year) dierence to the variance [6]. The
Table 2. 5% critical values for the statistic of Buishand range test as a function of n.
n 20 30 40 50 70 100
5% 1.43 1.50 1.53 1.55 1.59 1.62
Table 3. 5% critical values for N of the Von Neumann ratio test as a function of n .
n 20 30 40 50 70 100
5% 1.30 1.42 1.49 1.54 1.61 1.67
Von Neumann test assumes that under the alternative hypothesis, the series is not randomly distributed. This test is not location specic, which means that it does not give information on the year of the break. The von Neumann test is complementary to the other three tests because of its sensitivity to departures of homogeneity that are of a nature other than strict step-wise shifts [5]:
N = n 1i=1(Yi Yi+1)2=ni=1(Yi Y ) 2:
Critical values for N are given in Table 3. When the series is homogeneous, then the expected value is E(N) = 2. When the sample has a break, then the value of N must be lower than 2, otherwise we can imply that the sample has rapid variation in the mean. 3.3. Pettit test
The Pettitt test is a nonparametric test and analyzed from a point that will change over time [7]. The null hypothesis is that the data are independent, identically distributed random quantities, and the alternative is that a stepwise shift in the mean is present. The Pettit test is more sensitive to breaks in the middle of a time series [11]. The Pettitt test cuts the main series of N elements into two sets at each time, t, between 1 and N 1. This test is a non-parametric rank test. The ranks, r1; :::; rn, of the Y1; :::; Yn are used to calculate
the statistics:
Xk = 2ki=1ri k(n + 1); k = 1; 2; :::; n:
If a break occurs in year K, then the statistics are maximal or minimal near the year k = K:
XK = max 1knjXkj:
The signicance level is given by Pettitt [7]. Critical values for XK are given in Table 4.
3.4. Standard normal homogeneity test
Alexandersson [8] developed the Standard Normal Homogeneity Test (SNHT), which is widely used and taken as a reference in the hydrological and climatic sciences. The null hypothesis is that the data are independent, identically normally distributed random quantities, and the alternative is that a step-wise shift
Table 4. 5% critical values for XE of the Pettitt test as a
function of n.
n 20 30 40 50 70 100
in the mean (a break) is present. The SNHT for a single break is capable of locating the period (month or year) where a break is likely, and it detects breaks near the beginning and end of a series relatively easily [11]. Alexandersson [8] describes statistics, T (k), to compare the mean of the rst k years of the record with that of the last n k years:
T (k) = k:z2
1+ (n k):z22; c = 1; :::; n;
where:
Z1= ki=1(yi y)=s;
and:
Z2= ni=1+k(yi y)=s:
If a break is located in the year K, then, T (k) reaches a maximum near the year k = K. The T (k) is depicted in the graphs representing the results of this test. The test statistics, T0, are dened as:
T0= max 1knT (k);
The test has further been studied by Jaruskova [29] (1994). The relationship between her test statistics, T (n) and T0, is:
T0= (n:(T (n))2)=(n 2 + (T (n))2):
The null hypothesis will be rejected if T0is above
a certain level, which is dependent on the sample size. Critical values are given in Table 5.
4. Result and discussion
As illustrated, the results are obtained from homo-geneity research conducted by utilizing annual average streamow data received from the annual average data of dierent streamow gauging stations in Turkey, with a rich potential of water. According to the Von Neumann test, of the annual average streamow series belonging to 74 streamow gauging stations, 46 are non-homogenous, and 26 of these 46 streamow gauging stations with no homogeneity are scattered, partially homogenously, with respect to geographical position, in the western part of Turkey. The remaining 20 streamow gauging stations are condensed into a belt in the northeast and above the eastern part of the Mediterranean. Non-homogenous streamow gauging stations have been indicated with their numerical
Table 5. 5% critical values for the statistic T0 of SNHT
as a function of n.
n 20 30 40 50 70 100
5% 6.95 7.65 8.10 8.45 8.80 9.15
values in Table 1. 29 stations with no corresponding numerical values are, according to the VNT method, homogenous.
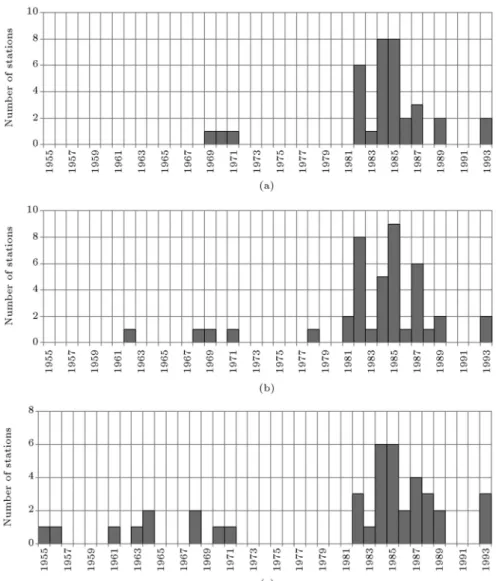
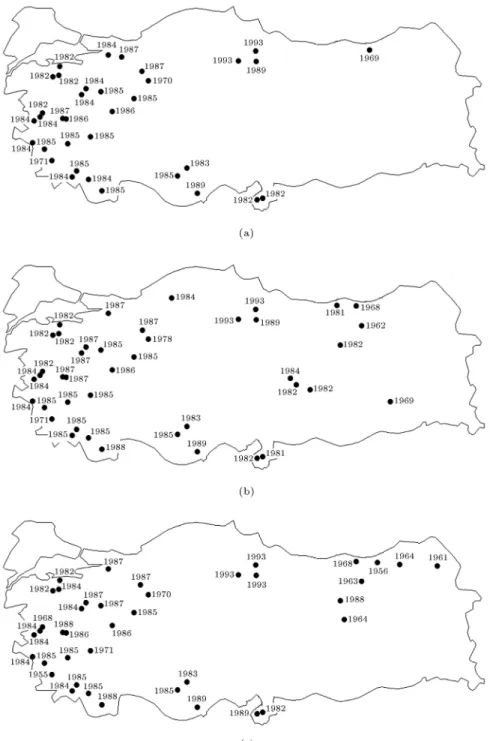
According to the analysis with the Buishand test, of the total 74 streamow gauging stations there are change points available in 35 stations. Obtained ndings demonstrate that during the rst half of the 1980s, in particular, streamow data went through a change (Figure 3(a)). 24 streamow gauging stations that have a change year in a 95% condence interval are situated in the western part of Turkey (Figure 4(a)).
In 35 (84%) stations, whose change year is de-tected by the Pettitt test, this change year is between 1980 and 1990 (Figure 3(b)). Findings related to the data analyzed by PT are marked on the map in Figure 4(b). In 42 stations out of 74 streamow gauging stations analyzed by PT, the change year has been detected at a 95% condence interval. Of all the analyzed stations, 15 are located in the eastern part of Turkey and 28 are in the western part of Turkey (Figure 4(b)).
In 30 (76%) stations, whose change year is iden-tied by the Standard Normal Homogeneity test, the change year is between 1980 and 1990 (Figure 3(c)). In the analysis based on SNHT, parallel to the ndings obtained via the other two methods, similar change years are identied. Of all the 74 stations analyzed, 40 have been detected to be meaningful at a 95% level. Of all the 40 stations providing results, 14 are in the eastern part of Turkey, whereas 26 are in the western part (Figure 4(c)).
It can be seen that the change year of annual average streamow detected by the Buishand [5] ho-mogeneity test varied particularly intensely between years 1982 and 1989. Besides, the change points of 47.2% of the stations were found to be in 1984-1985 time period. that change points detected via the PT method are centered between 1981 and 1989, and in years 1984 and 1985, 33% of the stations changed. Change years detected via the SNHT method varied densely between 1982 and 1989, while the change year in 32% of the stations pointed to the years 1984-1985 (Figure 3(a)-(c)). Streamow gauging stations which have been used to detect the change year for mean annual streamow in this study are almost in the same locations as the station trends determined by Kahya and Kalayci [23] in their study.
In the assessment of change year, results obtained for the annual average streamow ndings of previous hydrological and meteorological research are utilized. It should be particularly emphasized that change point research is mostly focused rstly on meteorological values (temperature, humidity etc.), but recently they have also been applied to hydrological data such as precipitation and streamow.
Figure 3. Detected number of streamow gauging stations by years: a) For Buishand test; b) for Pettitt test; and c) for standard normal homogeneity test.
data obtained from 229 precipitation stations in Turkey between years 1968-1998, determined the years that disrupted homogeneity in 50 stations. Change years detected by PT on 27 precipitation stations are be-tween 1983-1988, change years detected by SNHT on 34 precipitation stations are between 1969-1973 and 1995-1996. It is a known fact that there is positive correlation between precipitation and streamow. In that case, it goes without saying that the change years of these two climate indicators shall also be similar. If we are to compare change years of an-nual total precipitation detected by Frat et al. [30] with the change years of annual average streamow obtained in this research, we can claim that the results obtained by PT demonstrate that both indicators go through changes in similar years and in approx-imate geographical locations (in the western part of Turkey in particular). As the results obtained in both studies by SNHT methods are compared, it can be claimed that for the southwest part of Turkey,
there are similar change years in geographically nearby stations.
However, using the same method in the present study, the change years for streamow in the northeast part of Turkey was determined whereas in Frat et al. (2010) study the change years for precipitations in the southeastern part of Turkey was detected. This nding might prove, once again, that large-size water projects operating in the southeastern region have an eect on streamow.
Sahin and Cgzoglu [31] (2010), in their study, employed meteorological data collected between years 1974-2002 from 232 stations in Turkey, and provided a homogeneity analysis. For total precipitation data, by employing SNHT, BT, PT and VNT, change years are detected at 99% condence intervals throughout a total of 12 stations. As seen in the study of Sahin and Cgzoglu [31], the geographical locations of the stations in which precipitation homogeneity is disrupted are physically close to these research stations,
Figure 4. Geographical locations of streamow gauging stations and detected changing years: a) For Buishand test; b) for Pettitt test; and c) for standard normal homogeneity test.
whose change years of annual average precipitation have been detected. Turkes [15], in his study, examined the monthly precipitation data of 91 Turkish stations, whose data length varied between 54 years and 64 years, and identied that a drought period corre-sponded to the onset of 1970 and 1980. Furthermore, as classication based on the seasonal precipitation regime in Turkes's [15] study is compared with the regions whose change years are obtained in this study, it surfaces that in those regions where the dominant type of precipitation is rainfall, it is possible to detect the
change years. Aksoy [32] tested 1961 - 2000 period data from two streamow gauging stations on the European part of Turkey, and identied that the change years corresponded to 1982 and 1997. As can be seen, there are similarities between the ndings obtained from the above-summarized research and the change year interval identied in the present research (rst half of the 1980s).
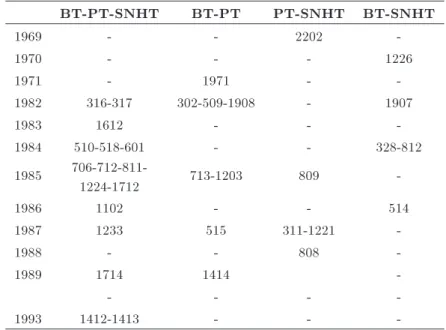
Stations in which the change year is obtained by BT, PT and SNHT are the same as summarized in Table 6. The number of stations detecting the same
Table 6. Streamow gauging stations which detected same changing year by test methods.
BT-PT-SNHT BT-PT PT-SNHT BT-SNHT
1969 - - 2202
-1970 - - - 1226
1971 - 1971 -
-1982 316-317 302-509-1908 - 1907
1983 1612 - -
-1984 510-518-601 - - 328-812
1985
706-712-811-1224-1712 713-1203 809
-1986 1102 - - 514
1987 1233 515 311-1221
-1988 - - 808
-1989 1714 1414
-- - -
-1993 1412-1413 - -
-year by employing the three methods used to identify the change year is 16. The number of stations in which the same change year has been identied by BT and PT methods is 8; the number of stations in which the same change year has been identied by PT and SNHT methods is 5; the number of stations in which the same change year has been identied by BT and SNHT methods is 5. 1984 and 1985 are the most frequent change years detected by these methods. Stations in which the same change year is detected by all three methods are stations in the western part of Turkey where the dominant precipitation form is rainfall. 5. Conclusion
Within the scope of the present research, an attempt is made to detect the climate change points of 74 streamow gauging stations in Turkey by analyzing their annual average streamow between years 1938-2005. Nonparametric statistical methods, namely, Von Neumann, Pettitt, Buishand, and Standard Normal Homogeneity methods, are utilized. Analyses are conducted on, statistically, a 95% condence interval. Compared to the eastern part of Turkey, the western part is climatically warmer, which enabled us to con-duct further systematic streamow measurements. In the western part of Turkey, where climate conditions resemble a Mediterranean climate, the climatic change year has been identied as the rst half of the 1980s. In geographically higher locations where precipitation characteristics turn into snow, it becomes substantially harder to nd both raw data and also to obtain a common change year with the obtained data. In the southeastern Anatolia region where no common change year could be detected, large-size water projects for
agricultural and energy purposes have been imple-mented in the aftermath of the 1970s. The eastern Anatolia region is the highest geographical region in Turkey with, approximately, 1500 meters of altitude, and is another region where no common change year could be detected. This high altitude created long and harsh winters with snowfall, which, in turn, makes it harder to make sensitive and systematic measurements. The failure to obtain a common change year in eastern Anatolia might be attributed to both the type of climate and challenges in measurement conditions. As regards the Black Sea region, the scarcity of habitable areas plays a role in the condensing of settlements near water resources. The industrial progress witnessed in the 19th century and agricultural needs triggered a change of course in water resources, which, in turn, caused the transformation or disruption of the streamow gauging stations that could be utilized. As the number of stations in which changes took place is taken into account, the method that detected the change year in the highest number of stations is PT (42 stations), followed by SNHT (40 stations) and BT (35 stations) in turn. All three methods are basically obtained from the western part of Turkey and detected change years mostly correspond to the rst half of the 1980s.
References
1. World Meteorological Organization (WMO) \Opera-tional hydrology report no. 48", Hydrological Data Management: Present State And Trends WMO-No. 964 (2003).
2. Kahya, E., Demirel, M.C. and Beg, A.O. \Hydrologic homogeneous regions using monthly streamow in
Turkey", Earth Sciences Research Journal, 12(2), pp. 181-193 (2008).
3. Kundzewicz, Z.W. and Kindler J. \Multiple criteria for evaluation of reliability aspects of water resource systems", Modelling and Management of Sustainable Basin-Scale Water Resource Systems, Proceedings of a Boulder Symposium, IAHS, 231, pp. 217-224 (July 1995).
4. Yenigun, K., Gumus, V. and Bulut, H. \Trends in streamow of the Euphrates basin, Turkey", Water Management, 161, pp. 189-198 (2008).
5. Buishand, T.A. \Some methods for testing the homo-geneity of rainfall records", Journal of Hydrology, 58, pp. 11-27 (1982).
6. Von Neumann, J. \Distribution of the ratio of the mean square successive dierence to the variance", Annals of Mathematical Statistics, 13, pp. 367-395 (1941).
7. Pettitt, A.N. \A non-parametric approach to the change-point detection", Applied Statistics, 28, pp. 126-135 (1979).
8. Alexandersson, H. \A homogeneity test applied to precipitation data", Journal of Climatology, 6, pp. 661-675 (1986).
9. Siegel, S. and Castellan, N.J. \Nonparametric statis-tics for the behavioral sciences", 2nd Ed., New York, McGraw-Hill (1988).
10. Tayanc, M., Dalfes, H.N., Karaca, M. and Yenigun, O. \A comparative assessment of dierent methodologies for detecting inhomogenous in Turkish temperature dataset", Int. Jour. of Climatology, 18, pp. 561-578 (1998).
11. Wijngaard, J.B., Klein Tank, A.M.G. and Konnen, G.P. \Homogeneity of 20th century European daily temperature and precipitation series", Int. J. Clima-tol., 23, pp. 679-692 (2003).
12. Wong, H., Hu, B.Q., Ip, W.C. and Xia, J. \Change-point analysis of hydrological time series using grey relational method", Journal of Hydrology, 324(15), pp. 323-338 (2006).
13. Dikbas, F., Frat, M., Koc, A.C. and Gungor, M. \Homogeneity test for Turkish temperature series", BALWOIS 2010 - Ohrid, Republic of Macedonia (2010).
14. Kang, H.M. and Yusof, F. \Homogeneity tests on daily rainfall series in Peninsular Malaysia", Int. J. Contemp. Math. Sciences, 7, pp. 9-22 (2012).
15. Turkes, M. \Spatial and temporal analysis of annual rainfall variations in Turkey", Int. J. of Climatol., (16), pp. 1057-1076 (1996).
16. Alexandersson, H. and Moberg, A. \Homogenization of Swedish temperature data. Part I: homogeneity test
for linear trends", Int. J. of Climatol., 17, pp. 25-34 (1997).
17. Xiong, L. and Guo, S. \Trend test and change-point detection for the annual discharge series of the Yangtze river at the Yichang hydrological station", Hydrological Sciences-Journal-des Sciences Hydrologiques, 49(1), pp. 99-112 (2004).
18. Mazvimavi, D. and Wolski, P. \Long-term variations of annual ows of the Okavango and Zambezi rivers", Physics and Chemistry of the Earth Journal, 31, pp. 944-951 (2006).
19. Toreti, A., Desiato, F., Fioravanti, G. and Perconti, W. \Homogenization of Italian precipitation series", Proceedings of the Sixth Seminar for Homogenization and Quality Control in Climatological Databases, Bu-dapest, Hungary, pp. 76-84 (2008).
20. Rasol, D., Likso T. and Milkovic. J. \Homogenisation of temperature time series in Croatia", Proceedings of the Sixth Seminar for Homogenization and Quality Control in Climatological Databases, Budapest, Hun-gary, pp. 85-93 (2008).
21. Costa, A.C. and Soares, A. \Homogenization of cli-mate data: Review and new perspectives using geo-statistics", Math Geosci, 41, pp. 291-305 (2009). 22. Gao, P., Zhang, X.C., Mu, X.M., Wang, F., Li,
R. and Zhang, X.P. \Trend and change-point anal-yses of streamow and sediment discharge in the Yellow river during 1950-2005", Hydrological Sciences Journal-Journal des Sciences Hydrologiques, 55(2), pp. 275-285 (2010).
23. Kahya, E. and Kalayc, S. \Trend analysis of stream-ow in Turkey", Journal of Hydrology, 289, pp. 128-144 (2004)
24. Kite, G. \Looking for evidence of climatic change in hydrometeorological time series", Western Snow Conference, Washington to Alaska, USA (1991) 25. Burn, H.B., Elnur, M.A.H. \Detection of hydrologic
trends and variability", Journal of Hydrology, 255, pp. 107-122 (2002).
26. Andrighetti, M., Zardi, D., de Franceschi, M. \History and analysis of the temperature series of Verona (1769-2006)", Meteorology and Atmospheric Physics, 103, pp. 167-277 (2009).
27. Acquaotta, F., Fratianni, S., Cassardo, C. and Cre-monini, R. \On the continuity and climatic variability of the meteorological stations in Torino, Asti, Vercelli and Oropa", Meteorol Atmos Phys., 103, pp. 279-287 (2009).
28. Khadr, M. \Water resources management in the con-text of drought (An application to the Ruhr river basin in Germany)", Bergsche Unverstat Wuppertal, Bericht Nr. 18. (2011).
meteorologi-cal measurement", Monthly Weather Review, 124, pp. 1535-1543 (1994).
30. Frat, M., Dikbas, F., Koc, A.C. and Gungor, M. \Missing data analysis and homogeneity test for Turk-ish precipitation series", Sadhana, 35(6), pp. 707-720 (2010).
31. Sahin, S., Cgzoglu, H.K. \Homogeneity analysis of Turkish meteorological data set", Hydrological Pro-cesses, 24(8), pp. 981-992 (2010).
32. Aksoy, H. \Hydrological variability of the European part of Turkey", Iranian Journal of Science &
Technol-ogy, Transaction B, Engineering, 31(B2), pp. 225-236 (2007)
Biography
Cahit Yerdelen received his PhD degree in Civil En-gineering from Ataturk University, Turkey, in 2007, and is currently Assistant Professor in the Civil Engineering Department, Hydraulics Division, at Ege University, Turkey. His main research interests include hydrology and experimental hydromechanics.