A New Wavelet-Based Approach
for Internal Fault Current
Identication in Power Transformers
H. Monsef
and S. Lotfard
1This paper demonstrates a novel approach for the dierential protection of power transformers. This method uses the Wavelet Transform (WT) and the Adaptive Network-based Fuzzy Inference System (ANFIS) to detect a fault current from an inrush current. The proposed method has been designed, based on the dierences between the amplitudes of wavelet transform coecients in a special band of frequency that is caused by faults and inrush currents. The performance of this algorithm has been simulated and tested under dierent conditions of the switching on of power transformers, using the PSCAD/EMTDC environment software.
INTRODUCTION
Transformers are important elements of power sys-tems. Dierential relays are commonly used for their protection and this protection system should be more reliable. This means that in non-fault situations, such as with inrush currents, it should not operate and under fault conditions, it should operate as fast as possible. Most methods for the digital dierential protection of transformers are based on the harmonic content of the dierential current. These methods are based on a concept, where in inrush current situations the ratio of the second harmonic of the dierential current, in respect to its rst component, is bigger than that of the fault current. To avoid mal-operation due to an inrush current, it is a common practice to detect the second harmonic component of the current and to block the dierential protection of the power transformer, should it exceed a certain value.
A second harmonic may also be generated during internal faults on the transformers, which may be due to CT saturation, parallel capacitances or the
*. Corresponding Author, Center of Excellence in Applied Electromagnetic Systems, Department of Electrical En-gineering, Faculty of EnEn-gineering, University of Tehran, Tehran, I.R. Iran.
1. Center of Excellence in Applied Electromagnetic Sys-tems, Department of Electrical Engineering, Faculty of Engineering, University of Tehran, Tehran, I.R. Iran.
distributed capacitances of long EHV transmission lines that are connected to the transformers and which may be greater than the second harmonic due to the inrush current [1].
In addition to current signals, voltage signals have also been used in some methods to increase the reliability of dierential protection systems [2]. Yabe [3] describes a new method to discriminate inter-nal fault from inrush current by summoning the active power owing into transformers from each terminal. Sidhu and Sachdev [4] present a microprocessor-based identication system, which implements the algorithm that uses modal transformation to identify the magne-tizing inrush and internal winding faults in three-phase transformers.
The main reason for including voltage transform-ers in the above-mentioned methods is the cost benet of increased reliability in the protection system. Some other methods detect faults, based on the wave-shape uctuations of dierential currents.
Regarding the fact that the time interval between two respective peaks is smaller in an inrush current compared to a fault current, one of the methods is based on the measuring of the time interval between the respective peaks of the dierential current [5]. The time of the current wave-shape being near zero is the main idea of another method [6]. The denotation of fault is time-delayed in such algorithms.
Some methods have used neural networks to identify fault conditions. In these methods, the input
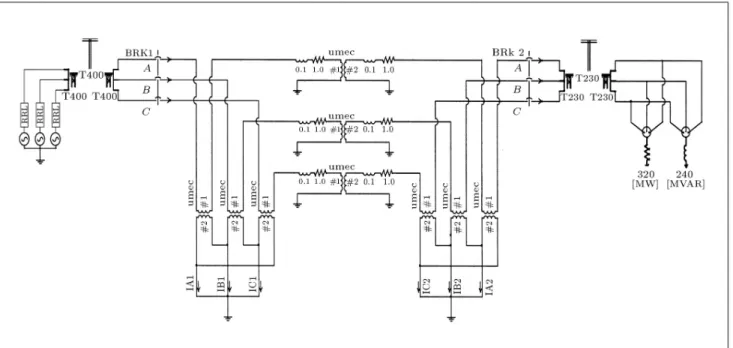
Figure 1. Sample network diagram in PSCAD environment.
of the neural network is the harmonic content of the dierential current [7]. The neural network has been trained using dierent samples under faulted and non-faulted conditions. The trained neural network output shows the fault or the normal condition of the transformers. Some other methods use fuzzy oriented approaches, based on the harmonics of dif-ferential currents to identify the fault from an inrush current [8].
Neural network-based methods need many sam-ples to train, which is the main deciency of these approaches [9]. Youssef [10] presents the development of a wavelet-based scheme for distinguishing between transformer inrush and fault currents. This paper uses the distance of two respective peaks in the wavelet transform of the current for identication between fault and inrush currents.
The wavelet transform is a powerful device for assessing signals generated by transients in power systems. The main applications of a wavelet transform in a power system are: Power quality assessment [11], protection [12] and fault detection [13]. In this paper, a new approach for the dierential protection of power transformers, using a fuzzy-neural network, based on a wavelet transform, has been proposed. Fuzzy logic and neural networks are powerful devices for classication and can identify faults with high reliability, but they need a lot of patterns to train. In order to solve this problem, one must extract data which contains important information as inputs of the neural network. This solution decreases the number of input patterns and quickens the identication process. For this reason, in this paper the wavelet transform is used as a reliable
and fast method to decrease the number of input pat-terns. Consequently, the number of input samples of the system decreases to three and, hence, the learning patterns decrease considerably. The eciency of the proposed method, with dierent faults and switching situations in the power transformer, has been studied. For this purpose, a small part of Iran's power system network, including a transformer that is connected to two power transmission lines, has been simulated in the PSCAD/EMTDC environment software and other elements that aect the dierential current have been studied.
SAMPLE NETWORK
To study the proposed method for identifying the fault current from the inrush current in a power transformer, a part of Iran's power system network has been se-lected. The sample network contains a 500 MVA and 400/230 kV transformer with two current transformers that are connected to 230 kV and 400 kV lines, which are linked to the power transformer.
In this study, a detailed model of the transmission lines has been chosen. Figure 1 shows the sample network in the PSCAD/EMTDC environment. PROPOSED METHOD FOR
DISCRIMINATION BETWEEN FAULT CURRENT AND INRUSH CURRENT
It must be taken into account that the proposed method, based on the ANFIS decision, is established upon dierences between wavelet transform coecients
in a special frequency band caused by the fault current and the inrush current. In this part of the paper, rstly, the wavelet transform and ANFIS have been described. Therefore, the diering behaviors of the dierential current, in consequence of the fault current and the inrush current, have been characterized. Finally, a suggested technique, based on the above-mentioned characteristics, has been oered.
Wavelet Transform
The waveforms associated with fast electromagnetic transients are typically non-periodic signals, which con-tain both high frequency oscillations and localized im-pulses added to the power frequency and its harmonics. These characteristics make problems for the traditional Discrete Fourier Transform (DFT), because its usage assumes a periodic signal and the representation of a signal by the DFT is best reserved for periodic signals. As power system disturbances are subject to transient and non-periodic components, the DFT alone can be an inadequate technique for signal analysis. On the other hand, DFT can be used for stationary signals. If a signal is altered in a localized time instant, the entire frequency spectrum can be aected. To reduce the eects of non-periodic signals on the DFT, the Short-Time Fourier Transform (STFT) is used. It assumes local periodicity within a continuously translated time window. So, STFT is dependent upon time and, hence, disturbance time can be determined by it. Due to the constant value of the window width for all signals, the resolution degree of all signals is considered to be constant.
A Wavelet Transform (WT) expands a signal, not in terms of trigonometric polynomials, but by a wavelet generated using the translation (shift in time) and dilation (compression in time) of a xed wavelet function called the mother wavelet. The wavelet function is localized in time and frequency, yielding wavelet coecients at dierent scales. This gives the WT the ability to support the analysis of signals with localized transient components. The Discrete Wavelet Transform (DWT) output can be represented by a two-dimensional grid in a similar manner to the STFT, but with very dierent divisions in time and frequency, such that the windows are narrow at high frequencies and wide at low frequencies. In comparison with the STFT, the WT can detect transient components at the higher frequency isolated at a shorter part of the power frequency cycle. In other words, in WT, unlike STFT, the frequency spectrums are not activated all together.
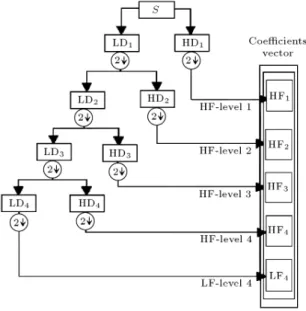
The single-level decomposition process in the wavelet analysis of a signal simply consists of passing it through two complementary lters, called a Low pass Decomposition lter (LD) and a High{pass
Decompo-sition lter (HD), and convolving the signal with lter coecients. After this process, by down sampling the results, they come out as two components called low frequency and high frequency coecients.
In multi-level wavelet analysis, the above men-tioned single level decomposition process is iterated by successive low frequency components and, then, being decomposed in turn, so that the signal is broken down into many lower-resolution components. Figure 2 shows a four level decomposition process.
In Figure 2, the rst level includes a wide band of high frequencies. If one assumes the sampling frequency of the main signal to be equal, f, then, the frequency band of the rst level is f
4 to f2, while the
last level covers the lower frequencies of the signal in the narrow frequency band. Generally, the nth level of the wavelet transform comprises a frequency band of f
2n+1
to 2fn. In an opposite manner, in the time domain, the
rst and last levels of the wavelet transform have the smallest and largest interval times, respectively. The ability of WT to focus on upper frequency components and on small and lower frequency components at big intervals of time, can improve the analysis of signals with high frequency oscillations and localized impulses. So, a wavelet transform is suitable for the identication of wave-shape properties, transients and non-stationary signals [10].
In this paper, the sampling frequency is selected to be 2.5 kHz and the Daubechies9-db9 function is selected as the mother wavelet function [14]. The Daubechies9 function is a better frequency extractor than the Harr function. This is due to its low-pass and high-pass lters, which more resemble ideal lters than those of a Harr wavelet. On the other hand, because of its orthogonality, it satises the Parsaval theorem,
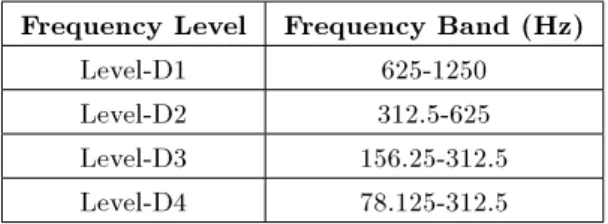
Table 1. Frequency band of wavelet transform coecients.
Frequency Level Frequency Band (Hz) Level-D1 625-1250 Level-D2 312.5-625 Level-D3 156.25-312.5 Level-D4 78.125-312.5
unlike biorthogonal wavelets, such as Coiet and Meyer wavelets.
The frequency components, which are conned to wavelet analysis, are according to the scheme listed in Table 1.
Fuzzy Interface System
The general scheme of a Fuzzy Inference System (FIS) has been illustrated in Figure 3 [15]. According to this gure, rstly, inputs of the system are fuzzied with membership functions. Then, a decision-making unit uses a rule-base and a data-base to make a decision in fuzzy form. Finally, the consequences of the decision-making unit are de-fuzzied and the nal output is generated. There are three structures for a fuzzy decision-making unit. In this paper, the Takagi-Sugeno structure has been selected.
A Takagi Sugeno Fuzzy Inference System with n inputs and one output is shown in Figure 4 [16]. This FIS has n + 1 linguistic variables, n fuzzy inputs and one fuzzy output. For the system with n inputs and one output, the set of linguistic rules is dened in the form of below:
Rk : If x1is Ak1 and x2 is Ak2: : : and xn is Akn;
then:
fi= pk1x1+ pk2x2+ + pknxn+ ck;
where fi is a consequence function resulted from a
fuzzy rule. If all the inputs have an equal number of
membership functions, such as M, then, the number of fuzzy linguistic rules will be P = Mn.
From Figure 4, the output from the Takagi-Sugeno FIS is as follows:
y =
p
X
i=1
uifi;
where: ui= Ppui
i=1ui
; and ui= M
Y
j=1
ij(xj):
If the membership functions are taken in the Gaussian form, then:
ij= 1
1+xj aij
cij
2bij; i=1; :::; n; j =1; :::; M:
The consequence functions of the fuzzy rules are in the form of:
fi= M
X
j=1
pijxj+ ci:
Then, from the above relations, the output of the FIS is as follows [17]:
y = Pp1
i=1ui p
X
i=1
ui
0 @XM
j=1
pijxj+ cj
1 A :
In the above equations, aij, bij, cij, pij and cj
are the adapting parameters, which must be learned. ANFIS uses an iterative procedure, which is based on a decreasing gradients method. In order to learn the adapting parameters, aij, bij and cij,
and the parameters of the fi functions, pij and
Figure 4. Fuzzy Takagi-Sugeno with n input and one output.
cj are being adapted by the least square error
method [16].
The learning procedure requires a set of data for training as p = fp1; p2; ; prg. Each element of the
set, px= (xk; yzx), is dened by the input vector, xk=
(x1kx2k: : : :xmk), and related response, yzk.
After the learning of ANFIS, the error sum of the square is as follows [17]:
"=Xr
k=1
0 B B @yzk
0 B B @Pp1
i=1uik p
X
i=1
0 @uik
M
X
j=1
pijxij+ci
1 A 1 C C A 1 C C A
2
;
uik= M
Y
j=1
ij(xjk):
DIFFERENTIAL CURRENT BEHAVIOR IN DIFFERENT CASES OF FAULT AND
SWITCHING
Dierential currents have dierent behaviors under fault and inrush current conditions. Since the mag-netizing inrush current corresponds to the transformer core saturation, the inrush current has a conical shape (non-sinusoidal); in other words, the inrush current at the switching time increases very slowly and, as time passes, its slope increases. However, when a fault occurs, the dierential current slope increases compared to the starting of the inrush current. This slope decreases as time passes. In other words, when a short circuit occurs on the transformer windings, the rst and second harmonics of the dierential current are increasing faster, in order to reach their maximum values, sooner than in the case of an inrush current [17].
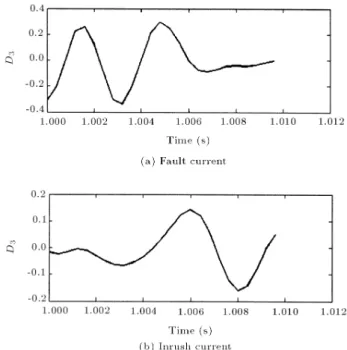
Figure 5. (a) Fault current; and (b) Inrush current.
This phenomenon has been illustrated in Figure 5. Figure 5a shows the dierential current of phase A due to a fault that occurs at t = 1 sec and continues for half of the period (0.01 sec at 50 Hz).
If an inrush current ows in the transformer wind-ings, the dierential current of the relay has a dierent behavior, with respect to the internal fault current. In the switching condition, in transformers, the rst and second harmonics of the dierential current increase, in order to reach their maximum values very slowly and after some cycles decrease with the same slope. Figure 5b illustrates the dierential current of phase A of the transformer in the half cycle after switching. The dierential current of phases B and C also have the same behavior as phase A.
Figures 6a and 6b show the coecients of the wavelet transforms of the fault current and the inrush current, respectively, in diagrams D1 to D4. The ampli-tudes of high frequencies (frequencies which are bigger than the power frequency) in an internal fault condition are bigger than the inrush current frequencies, due to the following two reasons [17]:
The increasing ramp rate of the fault current is bigger than the inrush current;
The bigger ramp rates of the signals include higher frequencies in the frequency-spectrum of the sig-nals.
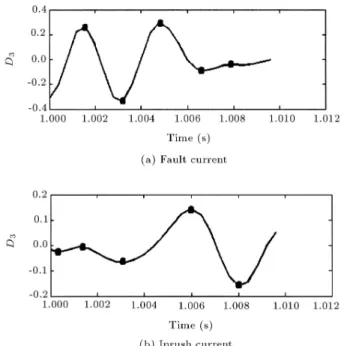
These properties have been illustrated in Fig-ures 7a and 7b for D3 in the frequencies between 156.25 Hz to 312.5 Hz , in the two cases of fault and inrush currents, respectively.
Figure 6. Wavelet transform coecients.
Figure 7. Wavelet transform coecients in D3.
For these reasons, by varying the power system or the power transformer and their parameters, the fault and inrush current wavelet transform coecients do not change. So, these coecients and their behavior are not aected by transformer type or power system. This property of the amplitude of the wavelet transform (such as D3) makes coecients that can be used to identify the fault current from the inrush current. In this paper, the proposed method uses this reality.
PROPOSED APPROACH
According to the above-mentioned explanations, a set of primary data is necessary for the FIS as training patterns. Their number is highly dependent on the number of adaptive parameters, which themselves are dependent on the number of inputs. Since each Gaussian membership function has three parameters, then by this assumption, each input has an M mem-bership function. Therefore, the number of all input parameters for n inputs is equal to: 3 M n.
On the other hand, there are Mnfuzzy rules, each
of which is a linear combination of inputs in addition to a constant value. Therefore, the number of parameters is equal to: Mn(n + 1). As a result, the number of all
FIS adaptive parameters is: 3Mn + Mn(n + 1):
Suppose that the consequence part of each fuzzy rule is a constant value, then the number of adaptive parameters will be reduced to:
3Mn + Mn:
It is obvious from the above that the number of parameters has an exponential relation with inputs. It means that a small variation in the number of inputs causes a large variation in the number of parameters. Table 2 shows a comparison between the number of parameters for 3, 4, 5 and 6 inputs, in which every input has three membership functions.
By increasing the number of inputs and, conse-quently, adaptive parameters, in addition to the need for more samples for system training, the calculation burden and algorithm response time are also increasing relatively. Therefore, the number of inputs must be decreased as much as possible, but be sucient enough for FIS to distinguish between fault conditions and switching conditions, so that the selected input data should have the most proper information. Dierences between fault and inrush currents in the D3 curves are very recognizable. In order to obtain the most proper information, the inputs have been chosen from maximum values of wavelet coecients of D3 curves.
It is possible to nd out the main reason for cur-rent wave-shape variations by the behavior of wavelet transform coecients. This behavior is apparent in
Table 2. The number of parameters vs. the number of inputs.
No. of Parameters No. of Inputs
54 3
117 4
288 5
748 6
Figure 8. Peak values of wavelet transform coecients (D3).
Figure 8. As shown in this gure, at rst, the D3 curve of the fault current varies greatly and, then, its variation will be slow. In the inrush current, this behavior is opposite. Therefore, it is enough to feed the peak values of the current, in the rst half cycle after the variations as input data to the FIS. Due to the fact that D3 contains a frequency band of 156.25 to 312.5, the rst half-cycle of the current waveform includes 3 cycles or six peak points in the D3 curve. The rst ve peak points can be used as input data for the FIS. It must be a normalized current waveform, because the identication process must be independent from the amplitude of the current. To reach this aim, the maximum value of the current in the D3 curve should be selected as a base value and the other points must be divided by it. Consequently, the proposed algorithm should be based on the dierences between the nature of the current under fault and safe conditions and not be established upon the magnitude of the current. As a result, the maximum value of the current in the D3 curve is equal to one in all cases and, so it can be removed from the set of ve input data. Hence, the number of inputs decreases to four. On the other hand, because the algorithm is based on the dierences between the current magnitudes, by calculating the dierence values, one of the inputs can be omitted without reducing the abilities of the proposed algorithm. Finally, the number of input data will be equal to 3 and the number of FIS training parameters is equal to 54. After FIS training, the nal error of the training process is 0.017. Figure 9 shows this fact.
Figure 9. Training process error.
of the FIS is a real number, but the desirable output is 1 or 0 (1 means the fault and 0 means the safe condition). So, if the output of the FIS is near 1, the nal output is rounded to 1, else it is rounded to 0. According to this strategy, the nal output of the FIS, with high accuracy, can determine fault and safe situations.
Results of the Proposed Algorithm Implementation
In order to assess the eciency of the proposed al-gorithm, dierent cases of fault current and inrush current have been simulated. These case studies have been accomplished by changing the main parameters that have an inuence on inrush current properties. These parameters are:
Magnitude of residual ux in the transformer core
of each phase (Br),
Voltage angle of phase A (when switching occurred on it),
Switching of transformer with secondary windings open or closed,
Knee point voltage of the saturation curve of the transformer core,
Amplitude of voltage connected to the transformer. Dierent cases of fault current have been simu-lated by considering the main parameters to aect the characteristics of the current.
The results of implementing the proposed algo-rithm for dierent cases have been shown in Table 3.
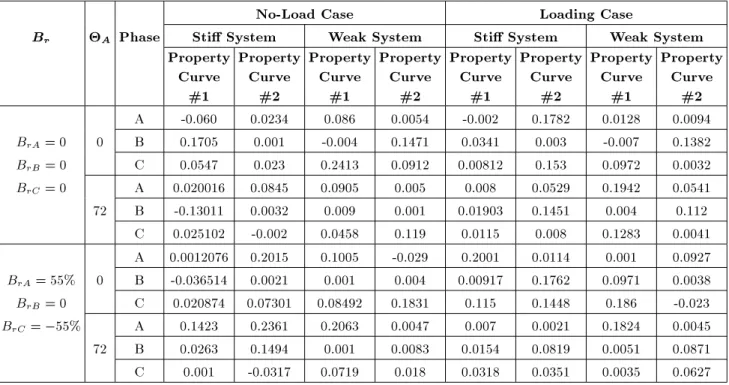
Table 3 shows the output of ANFIS for dierent phases in the half-cycle after current variations, due to inrush current. The rst column of this table shows the amplitudes of the residual ux in the transformer core for each phase in the switching condition with respect to nominal ux. The voltage angle of phase A has been mentioned in the second column of this table. The third column of the table determines the dierential current pertaining to whichever phase. The fourth and fth columns show that when the inrush current ows in the transformer windings, the secondary windings of the transformer is open or closed.
Table 3. Output of ANFIS in the half period of time after switching for dierent amounts of inrush current. No-Load Case Loading Case
Br A Phase Sti System Weak System Sti System Weak System
Property Curve
#1
Property Curve
#2
Property Curve
#1
Property Curve
#2
Property Curve
#1
Property Curve
#2
Property Curve
#1
Property Curve
#2 A -0.060 0.0234 0.086 0.0054 -0.002 0.1782 0.0128 0.0094 BrA= 0 0 B 0.1705 0.001 -0.004 0.1471 0.0341 0.003 -0.007 0.1382
BrB= 0 C 0.0547 0.023 0.2413 0.0912 0.00812 0.153 0.0972 0.0032
BrC= 0 A 0.020016 0.0845 0.0905 0.005 0.008 0.0529 0.1942 0.0541
72 B -0.13011 0.0032 0.009 0.001 0.01903 0.1451 0.004 0.112 C 0.025102 -0.002 0.0458 0.119 0.0115 0.008 0.1283 0.0041 A 0.0012076 0.2015 0.1005 -0.029 0.2001 0.0114 0.001 0.0927 BrA= 55% 0 B -0.036514 0.0021 0.001 0.004 0.00917 0.1762 0.0971 0.0038
BrB= 0 C 0.020874 0.07301 0.08492 0.1831 0.115 0.1448 0.186 -0.023
BrC = 55% A 0.1423 0.2361 0.2063 0.0047 0.007 0.0021 0.1824 0.0045
72 B 0.0263 0.1494 0.001 0.0083 0.0154 0.0819 0.0051 0.0871 C 0.001 -0.0317 0.0719 0.018 0.0318 0.0351 0.0035 0.0627
Table 4. Output of ANFIS in the half period of time for dierent cases of fault situation. A Phase No-Load Case Loading Case
a-g a-b a-b-c a-b-g a-g a-b a-b-g a-b-c A 0.99894 0.99878 0.95985 0. 98947 1.0512 0.9519 1.003 0.9865 0 B 0.98949 0.99169 0.98418 0.98950 1.0404 1.0398 0.9976 0.9759 C 1.0000 1.0005 0.98435 0. 98427 1 0.9998 0.9957 0.9932 A 0.98751 0.99653 0. 98426 1.002 0.7958 0.994 1.008 0.9984 72 B 1.0099 0. 99029 0. 99901 0.987 0.9959 0.9855 0.9963 1.006
C 1.0098 1.001 0. 97352 0.9978 0.9961 0.9913 0.9914 0.9925
The eect of the ux density at the knee point in the saturation curve of the transformer core, under no load and loading conditions of the transformer, has been studied. The ux density amplitude of the knee point in the second characteristic curve of the core is larger than that of the rst. The result of implementing the proposed algorithm for fault current conditions has been presented in Table 4.
In addition to the fault current and inrush current conditions, it is necessary to study the performance of the proposed algorithm when fault occurs under switching conditions. Table 5 shows the four dierent states of the transformer when internal fault and switching have occurred, simultaneously. The rst and second rows of this table present dierent states of switching conditions.
Indices ij in these two rows means that it belongs to the ith row of Table 3 and the jth column of Table 4. The results of Tables 3, 4 and 5 all show that the proposed algorithm operates correctly.
CONCLUSION
In this paper, a novel approach for the dierential protection of a power transformer has been presented. This approach is based on the dierences between the amplitudes of wavelet transform coecients in the special frequency band, caused by fault current and inrush current. In this method, the output of the ANFIS decision system shows the internal fault or the inrush current conditions of the transformer. If its output is equal to 1, it shows the fault condition; otherwise switching has occurred in the transformer.
Table 5. Output of ANFIS in the half period of time after simultaneous occurrence of fault and switching conditions.
Switching Situation 1,1 2,4 3,6 4,7 Fault Situation 1,1 2,4 1,6 2,7 A 1.004 0.9947 0.9918 0.9964 B 0.9891 1.007 0.9864 1.011 C 0.9714 1.003 0.9827 0.9912
The proposed algorithm besides being highly accurate is also extremely fast. The decision making process of this method is based on three samples and the proposed algorithm can detect a fault current from an inrush current in less than a half-cycle of time. Another advantage of this approach is in the fewer number of patterns required for training ANFIS. The eciency of this method has been simulated under dierent conditions of internal fault and switching. The results of the studies show that the proposed algorithm is suitable for the dierential protection of power transformers.
REFERENCES
1. Lio, P., Malik, O.P., Chen, C., Hope, G.S. and Guo, Y. \Improved operation of dierential protection of power transformer for internal faults", IEEE Trans. on Power Delivery, 7(4), pp 1912-1919 (1992).
2. Inagaki, K. and Higaki, M. \Digital protection method for power transformers based on an equivalent circuit composed of inverse inductance", IEEE Trans. on Power Delivery, 3(4), pp 1501-1510 (1998).
3. Yabe, K. \Power dierential method for discrimination between fault and magnetizing inrush current in trans-formers", IEEE Trans. on Power Delivery, 12(3), pp 1109-1117 (1997).
4. Sidhu, T.S. and Sachdev, M.S. \On line identication of magnetizing inrush and internal faults in three phase transformers", IEEE Trans. on Power Delivery, 7(4), pp 1885-1890 (1992).
5. Rockefeller, G.D. \Fault protection with a digital computer", IEEE Trans. on PAS., -PAS-98, pp 438-464 (1969).
6. Giuliante, A. and Clough, G. \Advances in the de-sign of dierential protection for power transformers", Georgia Technical Protective Relaying Conference, At-lanta, Georgia, pp 1-12 (May 1-3 1991).
7. Bastard, P., Meunier, M. and Regal, H. \Neural network-based algorithm for power transformer dier-ential relays", IEE Proceedings C, 142(4), pp 386-392 (1995).
8. Wiszniewski, A. and Kasztenny, B. \A multi-criteria dierential transformer relay based on fuzzy logic",
IEEE Trans. on Power Delivery, 10(4), pp 1786-1792 (1995).
9. Hamedani Golshan, M.E., Saghaian-nejad, M., Saha, A., Samet, H. \A new method for recognizing internal faults from inrush current conditions in digital dieren-tial protection of power transformer", Electric Power Systems Research, 71, pp 61-67 (2004).
10. Youssef, O.A.S. \A wavelet-based technique for dis-crimination between fault and magnetizing inrush currents in transformers", IEEE Trans. on Power Delivery, 18(1), pp 170-176 (Jan. 2003).
11. Santoso, S., Powers, E.J., Grady, W.M. and Hofmann, P. \Power quality assessment via wavelet transforms analysis", IEEE Trans. on Power Delivery, 11(2), pp 924-930 (Apr. 1996).
12. Chaari, O., Meunier, M. and Brouaye, F. \Wavelets: A new tool for the resonant grounded power distribution systems relaying", IEEE Trans. on Power Delivery, 11(3), pp 1301-1308 (July 1996).
13. Jiang, F., Bo, Z.Q. and Redfern, M.A. \A new gener-ator fault detection scheme using wavelet transform", Proc. 33rd Univ. Power Eng. Conf., Edinburgh, UK, pp 360-363 (Sept. 1998).
14. Daubechies, I., Ten Lectures on Wavelets, SIAM, Philadelphia, Pennsylvania (1992).
15. Rankovic, V. \Application of the Takagi-Sugeno fuzzy controller for solving the robots' inverse kinemat-ics problem", Mechankinemat-ics, Automatic Control and Robotics, 3(15), pp 1039-1054 (2003).
16. Jang, S.R. \ANFIS: Adaptive-network-based fuzzy inference system", IEEE Trans. on Systems, Man and Cybernetics, 23(3), pp 665-685 (1993).
17. Guzman, A. \Performance analysis of traditional and improved transformer dierential protective relays", SEL Technical Papers, pp 405-412 (2000).