Expect the
Unexpected:
Building business value
in a changing world
kpmg.com
forces do not act alone in predictable ways.
They are interconnected. They interact.
Disclaimer:
Throughout this document, "KPMG" ["we," "our," and "us"] refers to KPMG International, a Swiss entity that serves as a coordinating entity for a network of independent member firms operating under the KPMG name, KPMG's Climate Change and Sustainability practice, and/or to any one or more of such firms. KPMG International provides no client services.
B
stretch across continents and are vulnerable to disruption. Consumer demands and government policies are changing rapidly and will impact your bottom line if your business does not respond.Against this background of complexity we face a new set of challenges. For 20 years or more we have recognized that the way we do business has serious impacts on the world around us. Now it is increasingly clear that the state of the world around us affects the way we do business. This report shows that population growth, exploitation of natural resources, climate change and other factors are putting the world on a development trajectory that is not sustainable. In other words, if we fail to alter our patterns of production and consumption, things will begin to go badly wrong. How wrong and for whom, is also explored in the report.
Intergovernmental treaties are yet to solve the issues and, at a national level, the transition to sustainable growth remains a goal rather than an achievement. The concept of “green growth” has gained ground but we still lack a precise understanding of how we can achieve it along with higher standards of living within the limits of our planet.
Corporations are, of course, not passive bystanders in any of this. Our report shows that global megaforces are likely to bring significant threats and opportunities.
The resources on which businesses rely will become more difficult to access and more costly. There will be increasing strain on infrastructure and natural systems as patterns of economic growth and wealth change. Physical assets and supply chains will be affected by the unpredictable results of a warming world. And businesses will be confronted with an ever more complex web of legislation and fiscal instruments. But this is not the whole story. Consumer and investor values are changing. And as they change more corporations are recognizing that there is profit and opportunity in a broader sense of responsibility beyond the next quarter’s results. The bold, the visionary and the innovative recognize that what is good for people and the planet will also be good for the long term bottom line and shareholder value. Competitive advantage can be carved out of emerging risk.
We are working with organizations to help them understand the forces at work that will influence markets and impact profitability in the medium to long term.
This means moving on from old notions of corporate responsibility focused purely on protecting and enhancing reputation. It means being aware that your business stand to be affected as supplies of fresh water decrease and costs of energy rise and ecosystems decline. Knowing what those effects will be and how your business can manage them successfully means developing a sophisticated understanding of these factors and how they work. In this report we offer a starting point for discussion. We present a system of ten sustainability megaforces that will impact each and every business over the next 20 years. We want to build awareness that these forces do not act alone in predictable ways. They are interconnected. They interact. At KPMG, we encourage businesses to understand this system of forces; we help them assess the implications for their own organizations and to devise strategies for managing the risks and harnessing the opportunities. We can never know the future. But it is good business sense to be prepared for the possibilities: to expect the unexpected. This report cannot provide all the answers, and does not set out to, but it does suggest approaches that we believe will help to build business value in a changing world. We hope it provides a useful springboard for new thinking, debate and above all business action to deliver a future that is both sustainable and profitable.
Yvo de Boer
Special Global Advisor KPMG Climate Change & SustainabilityMichael Andrew
Chairman01 A business environment more complex
and fast-moving than ever 2
Globalization 2
Digital connectivity 3
Accelerated consumption 4
Disparate prosperity 5
Ecological decline 9
Resource scarcity 10
Lack of global governance continues 11 How has business adapted to these
global changes? 12
02 Global Sustainability Megaforces 14
Climate Change 14
Energy & Fuel 17
Material Resource Scarcity 21
Water Scarcity 23
Population Growth 25
Wealth 26 Urbanization 28
Food Security 30
Ecosystem Decline 32
Deforestation 34 Summary 36 03 Acknowledging complexity – how
sustainability megaforces interact 38
The world is becoming more complex
and uncertain 38
Businesses around the world are
acknowledging complexity 39
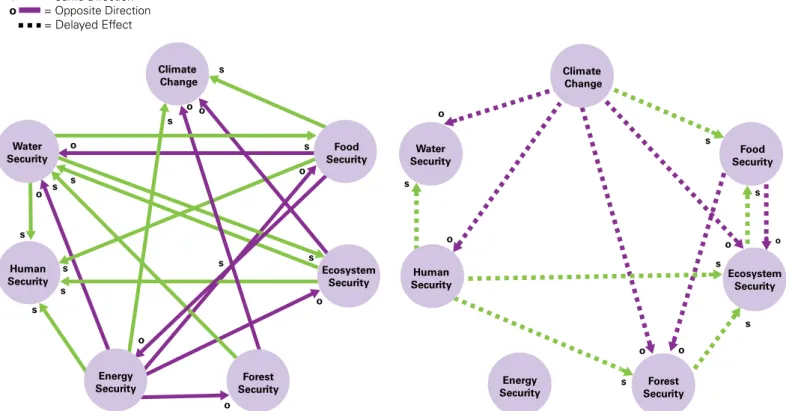
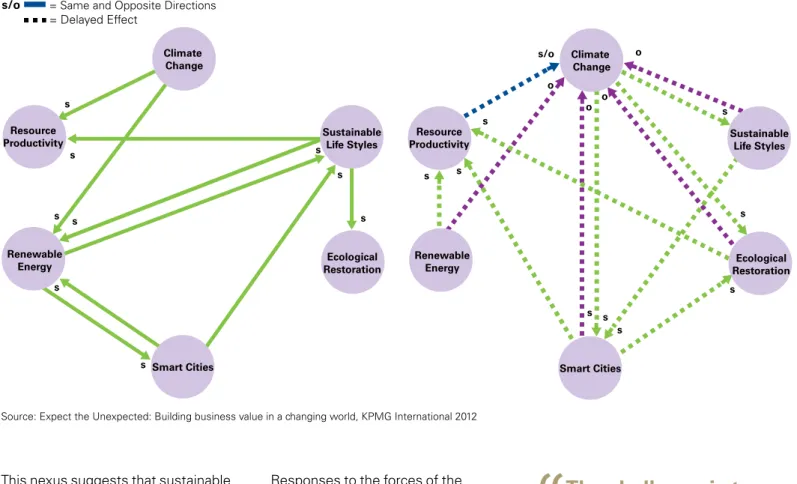
Interacting sustainability megaforces 39 The systems approach to sustainability 40
The Nexus Approach 41
The Footprint Nexus 42
The Erosion Nexus 43
The Innovation Nexus 44
Staying simple or using complexity as
a stimulus 46
Potential disruptors: The
climate-water-energy-food nexus 46
Quantitative review 55
Qualitative review 55
Value at stake: Sectors could see profits lost 56 Exposure reduced, but driven mostly by
rise in earnings 57
Environmental intensity: A clearer picture 59 Qualitative review: Risks and readiness 60 Summary 63 Airlines 65 Automobiles 72 Beverages 81 Chemicals 87 Electricity 93
Food Producers 99
Marine Transportation 106
Mining & Industrial Metals 112
Oil & Gas 118
Telecommunications & Internet 122
Actions by business 129
Actions by governments 135
Business and government working together: Public-private partnerships as a tool for
green growth 139
Imperatives for achieving sustainable growth 143
Appendix 1: Methodology 144
Appendix 2: Global sustainability
megaforces bibliography 148
Appendix 3: Scenarios bibliography 150 Appendix 4: Qualitative meta-review
bibliography 152 Glossary: Terms & abbreviations 156
General selected bibliography 160
Colophon 172 About KPMG’s Climate Change &
Sustainability Services 173
1
A business environment
more complex and
fast-moving than ever
Globalization, digital connectivity, accelerated consumption and
disparate prosperity have combined with ecological decline, a
lack of global sustainability governance and resource scarcity to
transform the playing field for businesses. As a result, today’s
global business environment is more complex, uncertain, volatile
and fast-moving than ever before. We begin this report by
exploring major changes to the business environment since the
Rio Earth Summit in 1992.
A global system has emerged from local economies, accompanied by a shift in the balance of power from the economic powerhouses of the industrialized world to emerging market giants. The world’s population has grown hugely and most people now live in cities. Hundreds of millions have moved out of extreme poverty and similar numbers have joined the global middle class, adopting in the process more resource-intensive diets and lifestyles.
There are significant opportunities for business as a result of these changes but climate change, resource constraints, water scarcity and many other factors also remind us that we are approaching – if we have not already exceeded – the planet’s ability to satisfy our appetite for growth.
That is why the central challenge of our age – decoupling human progress from resource use and environmental decline – will also be one of the biggest sources of future success for business. The corporate world was involved in creating these challenges and needs to know how to deal with them, not least because we now live in a hyper-connected and more transparent world where corporate behavior is increasingly held to account in the court of public opinion.
Globalization
Over the last 20 years, the amount of money flowing across borders grew at more than three times the rate of global GDP. International trade and foreign investment more than tripled; trade in
natural resources grew six-fold; and internationally-traded financial assets such as bank loans, bonds, and portfolio equity soared by a factor of 12.1
These dry figures translated into stronger economic growth across the world and enormous opportunities for business through the development of new markets and access to labor. Businesses benefited from exceptionally low interest rates, which allowed them to borrow cheaply and drove a major increase in trade, mergers and acquisitions. Cheap commodities and cheap labor led to a surge in economic growth in the industrialized world without the inflation that usually accompanies such growth.
At the same time, the emerging markets providing these resources also grew much more quickly, taking millions of people out of poverty and creating new markets for companies in both the developed world and emerging markets. Living standards rose rapidly, but they did so unequally and to the detriment of the environment in many areas.
However, globalization also made the financial sector more volatile as illustrated by the 2008 US subprime mortgage market shock, international
credit collapse and global recession the impacts of which continue to be felt. The financial crisis accelerated the shift of economic, financial and political power toward the developing world, in particular to dynamic emerging market nations such as China, India and Brazil. Being present in these low-cost and high-growth middle-income economies has come to be seen as increasingly central to corporate success.
Digital connectivity
The digital age began in earnest around 1995. Some 15 years later, it is an everyday fact of life for most of mankind. The combination of this digital revolution and globalization has shaped the world more profoundly and more rapidly than any other technological development.
It has created new markets and transformed old ones, enabling companies to cut costs and become more efficient. However, it has also made corporate reputations more fragile than ever. News of corporate fallings can reach an audience of millions within minutes and the damage done can last for years: witness the Gulf of Mexico oil spill.
1 The World Bank, World Development Indicators (Washington, DC: World Bank, 2011); The World Bank,
Global Economic Prospects (Washington, DC: World Bank, 2010); The World Bank, Multi-polarity: The New Global Economy (World Bank, 2011).
Digital connectivity
has created new
markets and
transformed old ones,
enabled companies to
cut costs and become
more efficient.
rose by
23,000 percent
Mobile phone subscriptions rose
by 23,000 percent from 1992, to
5 billion by 2010
Source: United Nations Environment Programme, Keeping Track of Our Changing Environment: From Rio to Rio +20 (1992-2012) (Nairobi: UNEP, 2011).
added
200 million
India and China together added
200 million mobile phone
subscribers during the year
2010 alone
Source: United Nations Environment Programme, Keeping Track of Our Changing Environment: From Rio to Rio +20 (1992-2012) (Nairobi: UNEP, 2011).
grew by
29,000 percent
The number of Internet users
grew by 29,000 percent from
1992 to 2 billion people in 2010.
Facebook, launched in 2004, had
more than 800 million active users
by 2011 who sent over 200 million
messages per day.
Source: United Nations Environment Programme, Keeping Track of Our Changing Environment: From Rio to Rio +20 (1992-2012) (Nairobi: UNEP, 2011).
expanded by
50 percent
Global data flows expanded by
50 percent during 2010 alone,
and Cisco forecasts a 26-fold
increase in global mobile data
traffic by 2015.
2Source: CISCO, Cisco Global Cloud Index: Forecast and Methodology, 2010–2015 (San Jose, CA: CISCO, 2011).
A new generation of “digital natives” have become far more active and discriminating consumers – companies need to be seen to do the right thing and are under growing pressure to be more transparent and accountable about what they do and why.
Many corporations are still wary of this development, but by making information available to others, they are often seeing it themselves for the first time and are discovering opportunities to improve business models.
Accelerated consumption
Consumption has gone into overdrive since Rio 1992 as Figure 1 illustrates. Resource use has grown faster than the population, which itself surged by 1.5 billion people to 7 billion by 2011.3
Over a billion people moved into cities during this time and a new middle class emerged, especially in Asia, with more resource intensive diets and life-styles.4
Even though the world economy became about 20 percent more efficient per unit of output over the past two decades, this could not counter the absolute growth of resource use and CO2 emissions.5
According to World Wildlife Fund (WWF) and Global Footprint Network, we used resources and produced CO2 during this 20 year period at a rate 50 percent faster than the Earth can sustain.6
If we are already “living beyond our means” but at the same time 3 billion people need to rise out of poverty, then the central challenge of our age must be to decouple human progress from resource use and environmental deterioration.
2 CISCO, Cisco Global Cloud Index: Forecast and Methodology, 2010–2015 (San Jose, CA: CISCO, 2011). 3 United Nations Population Fund, The State of World Population 2011 (New York: UNFPA, 2011).
4 United Nations Environment Programme, Keeping Track of Our Changing Environment: From Rio to Rio + 20
(1992–2012) (Nairobi: UNEP, 2011).
5 United Nations Environment Programme, Decoupling Natural Resource Use and Environmental Impacts
from Economic Growth: A Report of the Working Group on Decoupling to the International Resource Panel
(Nairobi: UNEP, 2011).
6 World Wide Fund for Nature, Institute of Zoology and Global Footprint Network, Living Planet Report 2010:
7 United Nations Department of Economic and Social Affairs, The World’s Women 2010: Trends and Statistics
(New York: UN, 2010).
8 The World Bank, World Development Report 2012: Gender Equality and Development (Washington, DC:
World Bank, 2011).
9 The World Bank, World Development Report 2011: Conflict, Security and Development (Washington, DC:
World Bank, 2011).
This challenge creates significant opportunities for business, partly within their own operations. But the real prize comes through helping others to “decouple”. Examples include renewable energy, which enables the production of low-carbon energy, drip irrigation technologies that help farmers to produce more crops using less water, electric vehicles that facilitate low-emissions motoring and software that helps everything from aircraft to buildings to work more efficiently.
Disparate prosperity
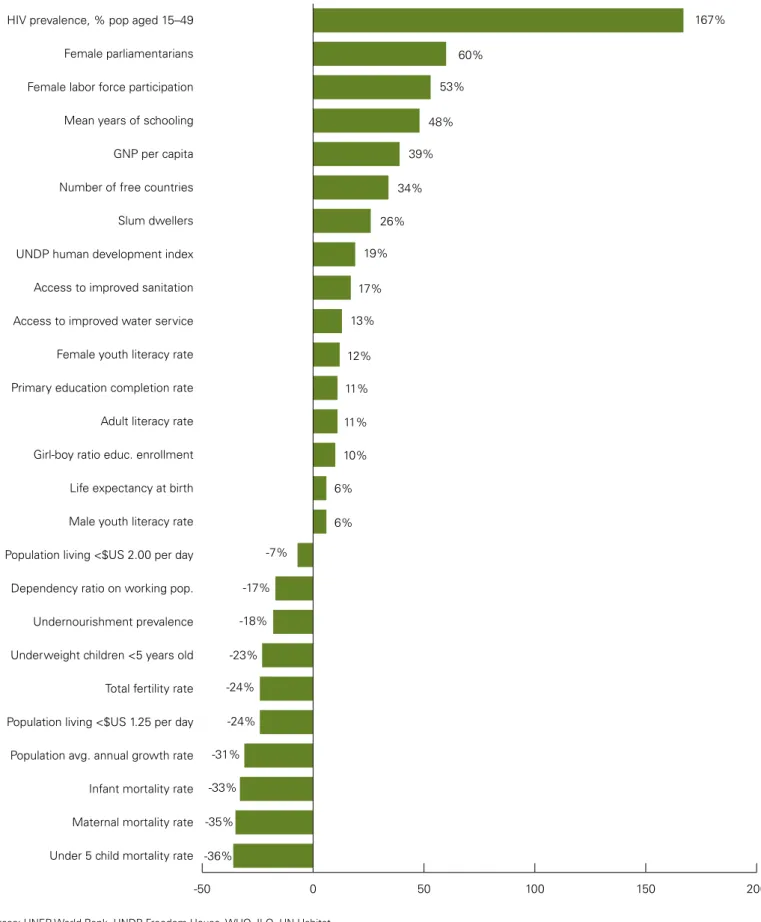
Since 1992 there has been unprecedented human social and economic progress, even among the worst-off. While some indicators worsened, such as rates of HIV
infection and numbers of slum-dwellers, people have mostly become healthier,
wealthier, better educated, better fed, more empowered and live longer (see Figure 2). The lives of women and girls changed dramatically during this period, with research indicating progress in the areas of literacy, health and economic participation.7
At the same time, gaps in gender equality persist, especially with regard to child mortality, school enrollment, access to economic opportunities, and voice and agency within society. The World Bank has emphasized that gender equality lies at the heart of smart development given its central role in enhancing productivity, making institutions more representative, and improving development outcomes for the next generation.8 Prosperity
has eluded 1.5 billion people living in countries affected by conflict.9
The central challenge
of our age must be
to decouple human
progress from resource
use and environmental
deterioration.
Figure 1: Accelerating human footprint on natural systems and resources
Sources: UNEP, World Bank, Worldwatch Vital Signs, WWF, SERI, UNDP, FAO, IEA.
-50 0 50 100 150 200 250
CO2 emissions per unit GDP
Resource intensity Meat consumption World population Per cap natural resource consumption Global ecological footprint Petroleum consumption Fish and seafood consumption Global CO2 emissions
Total materials extraction Food production Urban population Natural gas consumption Coal consumption Livestock production Total energy consumption Industrial metals use Electricity production International tourist departures Soybean land area Construction materials use Steel production Air passenger transport Palm oil land area Plastics production Nitrogen fertilizer use Merchandise exports Gross domestic product Cement production
Air freight transport 230%
170%
163% 142%
135% 130%
120%
100%
100%
80% 75%
73%
71% 60%
47% 47%
45% 45%
45%
45%
41%
39%
32% 30%
28%
27%
26% 26%
-21%
-23%
Figure 2: Human social and economic progress
Sources: UNEP, World Bank, UNDP, Freedom House, WHO, ILO, UN-Habitat
-50 0 50 100 150 200
Under 5 child mortality rate Maternal mortality rate Infant mortality rate Population avg. annual growth rate Population living <$US 1.25 per day Total fertility rate Underweight children <5 years old Undernourishment prevalence Dependency ratio on working pop. Population living <$US 2.00 per day Male youth literacy rate Life expectancy at birth Girl-boy ratio educ. enrollment Adult literacy rate Primary education completion rate Female youth literacy rate Access to improved water service Access to improved sanitation UNDP human development index Slum dwellers Number of free countries GNP per capita Mean years of schooling Female labor force participation Female parliamentarians
HIV prevalence, % pop aged 15–49 167%
60%
53%
48%
39%
34%
26%
19%
17%
13%
12%
11%
11%
10%
6%
6%
-7%
-17%
-18%
-23%
-24%
-24%
-31%
-33%
-35%
-36%
Between one quarter and one third of the world’s population remains in a state of persistent deprivation, especially in Sub-Saharan Africa (see Figure 3). It is not only the least developed countries that are suffering; an estimated 72 percent of the world’s poor now reside in populous middle-income countries such as Pakistan, India, China, Nigeria and Indonesia where they confront malnutrition, disease, illiteracy, and other challenges of extreme poverty.10
In the advanced economies, there has been a growing call for a more inclusive system of global capitalism as evidenced
by the “Occupy” movement that spread around the world in 2011. Persistent inequality is not only wrong, it is bad for business – it prevents huge swathes of the population from being workers and customers and it increases the risks to business from the type of instability and unrest that were seen in the Middle East and North Africa in 2011.
Today business is being asked to do more to fight global poverty and has responded with pioneering micro-credit and
“base-of-the pyramid” (BOP) corporate initiatives. Much of the movement involves “social entrepreneurs”
Figure 3: Persistent human deprivation
Data from years 2007–2010
Sources: FAO, World Bank, UNDP, UN-Habitat, ILO, Freedom House, WHO, UNESCO
0 500 1000 1500 2000 2500 3000
People without gainful employment People living in slums without secure shelter People without access to safe drinking water People suffering from malnutrition/undernourishment People lacking access to professional health care systems People living on less than US$1.25 per day People without literacy People without access to reliable electricity supplies People intermittently lacking food security People severely restricted in civil and political freedoms People living on less than US$2.00 per day People without access to adequate sanitation
(in Millions) Number of people
2600
2400
2400
2000
1400
1300
1200
1000
925
884
828
205
10Any Summer, The New Bottom Billion: What if Most of the World’s Poor Live in Middle-Income Countries?
experimenting at the local level.11 Larger
multinational companies exploring the growth and innovation opportunities of more inclusive business models include CEMEX, Danone, DuPont, Proctor & Gamble, SC Johnson, Unilever and Vodafone.12
Ecological decline
Mankind has caused more extensive and rapid changes to ecosystems in the last 20 years than at any other time in human history, thanks to ever-growing demand for resources. There is substantial evidence that ecosystems are struggling to provide the needed services that
populations have assumed will always be there. The UN’s Millennium Ecosystem Assessment warned that “human activity is putting such strain on the natural functions of Earth that the ability of the planet’s ecosystems to sustain future generations can no longer be taken for granted”.13
The damage includes loss of biodiversity, acidification of oceans, less productive cropland, desertification, tropical deforestation, and declines in wetlands, mangrove forests, sea-ice habitats, salt marshes, coral reefs and more.14 This
hits the world’s most disadvantaged and vulnerable people hardest.
Figure 4: Climate change since 1992
The 20 years since Rio 1992 according to UNEP15 have
witnessed:
• a 36 percent increase in global CO2 emissions
• a 9 percent increase in average CO2 concentration in Earth’s atmosphere • an increase of 0.4–0.6 degrees
Celsius in mean surface
temperature relative to historical means (1951–1990)
• 18 of the 20 hottest years on record
• melting of ice sheets and thawing of permafrost in northern latitudes • steady warming of ocean waters by
nearly 0.5 degrees Celsius
• global sea level rise of 2.5 mm per year from thermal expansion • growing acidity of the world’s
oceans threatening marine life • rapid diminishment of mountain
glaciers in terms of annual mass balance, and
• steady decline in the annual minimum extent of Arctic sea ice.
11 United Nations Development Programme, Creating Value for All: Strategies for Doing Business With the Poor
(New York: UNDP, 2008) and Muhammad Yunus, Building Social Business: The New Kind of Capitalism That Serves Humanity’s Most Pressing Needs (New York: Public Affairs Books, 2010).
12 Ted London and Stuart L. Hart, Next Generation Business Strategies for the Base of the Pyramid (London:
FT Press, 2010).
13 Millennium Ecosystem Assessment, Living Beyond Our Means: Natural Assets and Human Well-Being:
Statement from the Board (New York: MEA/United Nations, 2005).
14 Secretariat of the Convention on Biological Diversity, Global Biodiversity Outlook 3 (Montreal: CBD, 2010). 15 United Nations Environment Programme, Keeping Track of Our Changing Environment: From Rio to Rio + 20
(1992–2012) (Nairobi: UNEP, 2011).
Persistent inequality is
not only wrong, it is bad
for business.
Scientists are growing more concerned that the Earth is approaching thresholds or tipping points that could have abrupt, irreversible and catastrophic consequences. These include combined sea level rise, impacts of monsoon interference on India, Amazon drought and die-back, increased aridity in Southwest North America, loss of glacial freshwater supplies especially in Central Asia, and conversion of coral reefs to algal dominated systems.16
Business is both heavily involved in causing this damage and likely to be increasingly affected by the consequences. It is clear that responses to these challenges must include reducing greenhouse emissions and becoming more resource-efficient. As a result, carbon and ecosystem service-intensive industry sectors such as energy, heavy industry and agriculture are likely to face increasing regulatory and consumer pressures to reduce their impact. At the same time, “clean technologies” such as renewable energy are likely to be among the biggest industries of the future.
Resource scarcity
Shortages of a number of key resources are becoming apparent, from arable land, fresh water and metals to fossil fuels. Companies in all sectors need to prepare themselves for a world where raw materials may be in short supply and subject to price volatility, including large price rises and increased disruption to supplies.
For example, by 2008, 80 percent of marine fish stocks were considered over-exploited or fully exploited, prompting a massive surge in aquaculture, especially in Asia.17
Soil erosion has been taking place at several times the natural replacement rate, the amount of available arable land per person has dropped substantially and agricultural productivity has slowed. At the same time an area the size of Western Europe – has been sold or leased to international investors in order to produce crops or biofuels for export back to wealthy, food and fuel-insecure nations.18
These factors contribute to instability and volatility in food and biofuel supplies, but also create opportunities for companies that can, for example, improve crop yields, reduce land degradation or sustain fish stocks. More than 4 billion people are now living in water-stressed (defined as less than 1700 cubic meters of water available per capita/year) and water-scarce (defined as less than 1000 cubic meters per capita/ year) regions while water tables, soil moisture levels and water quality levels are declining rapidly in many dry-land areas.
There are also concerns about supplies of hydrocarbons, fertilizing minerals such as potassium and phosphorous and rare-earth minerals (such as neodymium, yttrium and cerium) as well as the capacity of the world’s forests and oceans to absorb carbon.19
After a century of persistent and steady falls in real commodity prices, analysts began to suggest that the world had entered into a prolonged “super-cycle” of rising and more volatile commodity prices. The knock-on effects included supply disruptions, lower growth, higher inflation, export restrictions, new regulations, conflicts over resources and currency instabilities.
16 Johan Rockstrom, et. al., “A Safe Operating Space for Humanity,” Nature, Vol. 461 (September 2009,
pp. 472-475) and Tim Lenton, et.al., for Allianz and the World Wide Fund for Nature, Major Tipping Points in the Earth’s Climate Systems and Consequences for the Insurance Sector (Gland, Switzerland: WWF, 2009).
17 United Nations Food and Agriculture Organization, World Review of Fisheries and Aquaculture (Rome: FAO,
2010) and United Nations Food and Agriculture Organization, The State of World Fisheries and Aquaculture
(Rome: FAO, 2011).
18 Bertram Zagema, Land and Power: The Growing Scandal Surrounding the New Wave of Investments in Land
(Oxford, UK: Oxfam International, September 2011).
19 Richard Heinberg, Peak Everything: Waking Up to the Century of Declines (Gabriola Island, BC, Canada: New
Society Publishers, 2007).
Companies in all
sectors need to prepare
themselves for a world
where raw materials may
be in short supply.
This age of resource constraint20 is set to
be a fact of life for all businesses in years to come. Companies need to prepare for this and have a strategy to deal with it, through measures such as reducing resource use, increasing recycling of resources, identifying alternative sources of supply or finding substitute materials. The argument is most commonly seen in the case for improving energy efficiency but in the future companies will have to improve resource productivity across a range of inputs. They will also need to improve efficiency in the use and disposal phases of products and services.
Lack of global
governance continues
The number of signatories to
multilateral environmental agreements has increased by 330 percent since 199221 and yet many of the agreements
achieved at the Rio Earth Summit 1992 and Johannesburg 2002 UN conference have still not been implemented or enforced. Attempts to establish global rules have been outpaced by the growth of global challenges such as climate disruption, declining fisheries, biodiversity loss and health pandemics, along with the increasing interconnectedness of global finance, agriculture and resource extraction.22
20 Peter Schwartz, et. al., Winners and Losers in the New Commodity Price Regime (San Francisco: Monitor,
2011).
21 United Nations Environment Programme, Keeping Track of Our Changing Environment: From Rio to Rio + 20
(1992–2012) (Nairobi: UNEP, 2011).
22 Brian Walker, et. al., “Looming Global-Scale Failures and Missing Institutions,” Science, Vol. 325 (September
11, 2009, pp. 1345-1346).
This creates
opportunities for
companies that can
improve crop yields,
reduce land degradation
or sustain fish stocks.
Policymakers have been able to tackle thorny but often domestic-rooted problems such as the state of the automotive market but not yet system-wide problems such as global imbalances of trade or the eurozone crisis. The difficulties in securing coordinated global governance on sustainability have been clearest in the 20 years of negotiations that have attempted to forge a global approach to tackling climate change.
Although progress on low carbon technologies has been made in individual countries and regions, most notably in Europe, the levels of investment required for worldwide change have been missing.
At the same time, government subsidies for carbon-intensive industries have continued despite a G20 commitment to phase them out by 2020.
The business community needs clear global rules, for example on carbon emissions, powerful regulatory incentives and a level-playing field to support it in moving to sustainable growth. These incentives should include financing solutions that allow the longer term benefits of sustainability
to compete with other programs with a higher short-term payback; a way to measure the impact of sustainability programs; and clearer and more rigorous international regulation that will allow companies to plan with confidence.23
How has business
adapted to these global
changes?
Twenty years after the Rio Earth Summit in 1992, sustainability has become a more important issue for companies and sustainability-related investments have grown substantially – Bloomberg New Energy Finance recently reported that the trillionth dollar of investment in clean energy had been made.
Furthermore, sustainability is increasingly being seen as a source of innovation and growth rather than simply cost reduction and risk management.24 The Carbon
Disclosure Project reported this year that companies with a strategic focus on climate change provided investors with approximately double the average total return of the Global 500 from January 2005 to May 2011.25
23 United Nations Environment Programme, Towards a Green Economy: Pathways to Sustainable Development
and Poverty Eradication: A Synthesis for Policy Makers (Nairobi: UNEP, 2011).
24 KPMG International in cooperation with the Economist Intelligence Unit, Corporate Sustainability: A Progress
Report (April 2011) www.kpmg.com
25 Carbon Disclosure Project. (2011) Global 500 Report.
The business
community needs clear
global rules, powerful
regulatory incentives and
a level-playing field to
support it in moving to
sustainable growth.
Recent polls of senior executives reveal that many of the world’s largest 250 corporations are increasingly embracing sustainability as a core foundation of successful business and publicly report about their performance.26
However, there remains a long way to go. In 2008, the world’s 3,000 largest public companies by market capitalization were estimated to be causing US$2.15 trillion of environmental damage, equivalent to 7 percent of their combined revenues and 50 percent of their combined earnings
(measured as EBITDA: earnings before interest, taxation, depreciation and amoritization). Some 60 percent of these negative impacts were concentrated in the electricity, oil and gas, industrial metals and mining, food production and construction and materials sectors.27
The next section of this report presents the ten sustainability megaforces that over the next 20 years will exert increasing pressure on businesses in all sectors and economies around the world.
26 KPMG International in cooperation with The Economist Intelligence Unit, Corporate Sustainability: A
Progress Report (April 2011) and KPMG International, KPMG International Survey of Corporate Responsibility Reporting 2011 (2011), at www.kpmg.com.
27 United Nations Environment Programme Finance Initiative and Principles for Responsible Investment
Association, Universal Ownership: Why Environmental Externalities Matter to Institutional Investors (New York: UNEP Finance Initiative, October 2010) at www.unepfi.org.
In 2008, the world’s
3,000 largest public
companies were
estimated to be causing
US$2.15 trillion of
environmental
damage.
Global Sustainability
Megaforces
Over the next 20 years, businesses will be exposed to hundreds
of environmental and social changes that could bring both risks
and opportunities in the search for sustainable growth. For this
report more than two dozen forecasts have been analyzed from
international agencies, global think-tanks, national agencies and
noted futurists in an attempt to identify those changes likely to
have the greatest impacts on business. (See Appendix 2 for a list
of sources).
Emphasis was placed on the availability of quality numerical projections, key pressures causing global environmental and social problems and the most significant consequences of those pressures for natural and human security. The result is a set of ten global sustainability megaforces that will impact every business over the next two decades. They are:
1. Climate Change 2. Energy & Fuel
3. Material Resource Scarcity 4. Water Scarcity
5. Population Growth 6. Urbanization 7. Wealth 8. Food Security 9. Ecosystem Decline 10. Deforestation
A summary of these global sustainability megaforces follows. Each has important implications for business which must be understood, assessed and built in to long term strategic planning. Awareness and comprehension of each is vital but, as the next section of this report demonstrates, it is only the first step.
These megaforces do not function in isolation from each other in predictable ways. They act as a complex and unpredictable system, feeding, amplifying or ameliorating the effects of others. Business leaders seeking to manage the risks and harness the opportunities of the future must understand how these megaforces function and how they might affect their own organizations.
Climate Change
Climate change is the one global
megaforce that directly impacts all others discussed in this report.
These megaforces
act as a complex and
unpredictable system,
feeding, amplifying or
ameliorating the effects
of others.
change such as energy efficiency requirements and standards, carbon taxes, emissions cap and trade systems and fuel tariffs. Businesses may also be at risk of damaging their brands if they are seen to do the wrong thing, with the added threat of litigation if they fail to comply with legislation, or to disclose their carbon impacts.
Predictions of annual output losses from climate change range between one percent per year, if strong and early action is taken, to at least five percent a year if governments fail to act.
However, it is developing countries and the businesses that operate in them that are most vulnerable to climate change impacts even as their rapid industrialization increases their contribution to global CO2 emissions (Figure 5, Figure 6).
Source: U.S. Energy Information Administration (EIA). (2011). International Energy Outlook 2011. EIA, Washington D.C.
Non-OECD OECD
1990 2000 2008 2015 2025 2035 0
10 20
Figure 6: Climate change vulnerability index 2012
Source: Maplecroft. (2012). The Climate Change and Environmental Risk Atlas. Available at http://maplecroft.com
The physical risks are considerable. The International Energy Agency (IEA) says that we are on course for a long-term global temperature rise of 3.5°C. This could cause ‘irreversible’ impacts including near-total deglaciation in the long term, contamination of groundwater supplies, water shortages for hundreds of millions of people, lower agricultural yields in many places and more malnutrition, infectious diseases and deaths from heat waves, as well as increasingly severe floods, droughts and storms.1
Extreme weather events are set to become more frequent and up to one sixth of the world’s population could face disruption to water supplies and an increased risk of flooding from melting glaciers, mainly in the Indian subcontinent
and areas of China and South America – regions that are seen as the new driving force for the global economy. While agricultural yields could increase in higher latitude areas such as Northern Europe, elsewhere, particularly in Africa, falling yields could leave hundreds of millions of people without enough food.2
Sea level rises could cause flooding in low-lying coastal areas, displacing “tens to hundreds of millions of people” in places such as Southeast Asia, particularly Bangladesh and Vietnam, and small Caribbean and Pacific islands. Some of the world’s largest and richest cities, such as Tokyo, New York, London and Shanghai could also be affected. Human health could be affected as more people become vulnerable to mosquito-borne diseases, air quality worsens, and
Country
Haiti Bangladesh Zimbabwe Sierra Leone Madagascar Cambodia Mozambique DR Congo Malawi Philippines
Rank
1 2 3 4 5 6 7 8 9 10
Category
extreme extreme extreme extreme extreme extreme extreme extreme extreme extreme
Extreme risk High risk Medium risk Low risk No Data
Haiti
D.R. Congo
Bangladesh Cambodia Philippines
Mozambique Malawi Madagascar Zimbabwe Sierra Leone
1 IPCC, Contribution of Working Group II, 2007 2 IPCC, Contribution of Working Groups I, II, and III, 2007
3 IPCC, Contribution of Working Groups I, II, and III, 2007
4 International Energy Agency. 2011, World Energy Outlook 2011 Factsheet
more extreme weather events occur.3
Climate change is expected to also affect ecosystem health and biodiversity, in turn reducing land productivity and adding to food security stress and water scarcity.
Urgent action is needed to avoid such a global temperature rise, but because energy-related facilities such as power stations, buildings and factories last for many decades, “80 percent of the cumulative CO2 emitted worldwide between 2009 and 2035 is already “locked-in” by capital stock that either exists now or is under construction and will still be operational by 2035,”4
according to the IEA.
Individual countries have started acting to cut emissions – China, Australia and South Korea plan to create carbon markets by 2015, for example, while many more have carbon reduction targets – but fragmented national responses require business to
understand and comply with a complex and unpredictable patchwork of carbon legislation around the world. Meanwhile, international action on climate change has been slow and disjointed. A price on carbon has been established through trading systems such as the EU Emissions Trading System and the UN’s Clean Development Mechanism, but the carbon markets have been dogged by
political interference and the economic crisis. Progress was made at the 2011 UN climate conference in Durban, with all the world’s major emitters agreeing that they must cut emissions, but a new global deal – if it eventuates – will not be agreed until 2015 and will not come into force until 2020.
Nonetheless, the need to tackle climate change brings opportunity to innovators. The US$100 billion-a-year Green Climate Fund (GCF) should make it easier to cut emissions and help developing countries to adapt to the effects of climate change. The GCF could lead to the creation of public-private partnerships in developing nations that can build green industries, create jobs, reduce poverty and improve infrastructure as well as tackle climate change.
Energy & Fuel
Fossil fuel markets are set to become more volatile and unpredictable because of higher global energy demand; changes in where fossil fuels are consumed; supply and production uncertainties; and increasing regulatory interventions related to climate change. All companies – regardless of sector, size, or location – will find it difficult to plan for and manage energy costs, especially those related to fossil fuel use.
A new global deal – if
it eventuates – will not
be agreed until 2015 and
will not come into force
until 2020.
Companies that become more energy efficient and/or use more alternative and renewable sources of energy, however, would be able to lower their exposure to fossil fuel-related risks and improve their financial performance. The Carbon Disclosure Project last year highlighted the link between cutting emissions and financial outperformance.
While some businesses are moving slowly towards alternative and renewable sources of energy, most corporations continue to depend heavily on oil, coal and gas for power, fuel and raw materials. Just three percent of electricity generation came from non-hydro renewable sources in 2010 – including hydro, the total is 13 percent while 81 percent of power is fossil-fuelled. “There are few signs that the urgently needed change in direction in global energy trends is under way,” the IEA says in its World Energy Outlook 2011.5
Energy businesses must prepare for shifts in fuel mix due to policy, supply, and fuel prices. These businesses, particularly those involved in renewable energy, must also remain actively involved in policy debates that will impact both total global energy demand and the fuel mix through carbon or renewable energy policies. But other industries need to pay attention to the issue as well. Fossil fuel-dependent transportation industries such as aviation, shipping and manufacturers that use petroleum as a process input,
such as plastic or chemical producers, will need robust strategies and plans to address fuel price volatility and potential shortages. Vehicle and electrical
appliance suppliers, manufacturers and retailers must prepare for significant energy consumption increases in the developing world, and adjust product design and development strategies accordingly.
All of these drivers create a market for companies that can help customers to become more energy efficient. Equally, companies that can bring low-carbon power to the world’s poorest people by “leapfrogging” large-scale utility infrastructure are well-placed.
The energy mix is likely to slowly change in coming years, but fossil fuels will continue to dominate world energy supply to 2035 (Figure 7 ), making up 75 percent of the energy mix – and in absolute terms, more fossil fuel will be consumed than today.
“World primary demand for energy increases by one-third between 2010 and 2035 and energy-related CO2 emissions increase by 20 percent,” the IEA adds. It also projects that over the next 25 years, 90 percent of the projected growth in global energy demand will come from non-OECD economies.
Businesses in the OECD therefore face a situation where the dynamics of the global energy market are increasingly decided elsewhere.
5 International Energy Agency. 2011, World Energy Outlook 2011 Executive Summary
Vehicle and electrical
appliance suppliers,
manufacturers, and
retailers must prepare
for increased demand
for their products at
a time when policy is
likely to raise energy
prices.
6 International Monetary Fund (April 2011) World Economic Outlook 7 International Energy Agency. 2011, World Energy Outlook 2011 Factsheet 8 International Energy Agency. 2011, World Energy Outlook 2011 Factsheet
The IMF’s World Economic Outlook in April 2011 stated: “The increases in the trend component of oil prices suggest that the global oil market has entered a period of increased scarcity. The analysis of demand and supply prospects for crude oil suggests that the increased scarcity arises from continued tension between rapid growth in oil demand in emerging market economies and the downshift in oil supply trend growth.6
Proportionally, oil remains the leading source of fuel, but demand for natural gas is expected to rise most strongly. Nuclear energy is likely to grow by about 70 percent to 2035, led by China, Korea and India.7 The relative share
of renewable energy sources, led by hydropower and wind, should grow faster than other energy forms but in absolute terms, total supply of renewables – at 18 percent – remains well below the level of any single fossil fuel by 2035.8
Figure 7: Proportion of various energy sources in world primary energy demand
Oil Gas Nuclear Hydro
Coal Biomass and waste Other renewables
Source: International Energy Agency (IEA). (2011). World Energy Outlook 2011 © OECD/IEA, Figure 2.7, page 79. IEA, London 1980 1990 2000 2010 2020 2030 2035 50%
40%
30%
20%
10%
0%
Increased scarcity
[of crude oil] arises
from continued tension
between rapid growth in
oil demand in emerging
market economies and
the downshift in oil
supply trend growth.
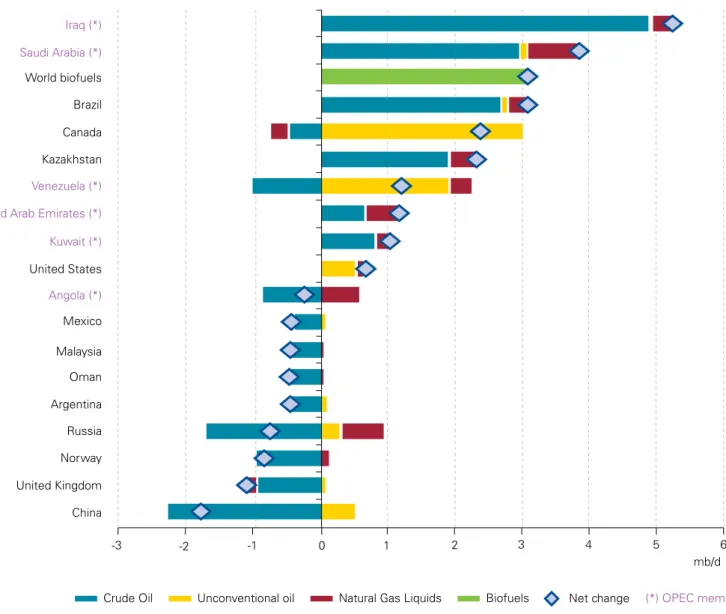
The IEA predicts that the demands of transportation in emerging economies will lift oil consumption by 15 percent between 2010 and 2035. World oil production is predicted to reach 96 million barrels per day (m b/d) in 2035, 13m b/d up on 2010 levels, with a growing share coming from natural gas liquids and other unconventional
sources.9 The Middle East and North
Africa are set to provide most of the growth in oil output during this period, while other locations will turn to more costly and difficult sources (Figure 8). The IEA also predicts that the price of crude oil will rise to US$120/barrel (in year-2010 dollars) by 2035.10
9 International Energy Agency. 2011, World Energy Outlook 2011 Factsheet. 10 International Energy Agency. 2011, World Energy Outlook 2011 Factsheet.
Figure 8: Major changes in global liquids supply, 2010–2035
-3 -2 -1 0 1 2 3 4 5 6
Crude Oil Unconventional oil Natural Gas Liquids Biofuels Net change (*) OPEC member
mb/d
Iraq (*) Saudi Arabia (*)
World biofuels Brazil Canada Kazakhstan
Venezuela (*) United Arab Emirates (*) Kuwait (*)
United States
Angola (*)
Mexico
Malaysia Oman Argentina Russia Norway
China United Kingdom
Source: International Energy Agency (IEA). (2011). World Energy Outlook 2011 © OECD/IEA, Figure 3.17, page 124. IEA, London
The IEA predicts that
the price of crude oil will
rise to US$120/barrel
by 2035.
of global GDP.” Yet all users of fossil fuels need to be aware of the increasing pressure to eliminate fossil fuel
subsidies, which totaled US$409 billion in 2010 about US$110 billion more than in 2009 as a result of the increase in oil prices. Subsidies for renewable energy are predicted to continue growing, reaching almost US$250 billion in 2035.12
Material Resource Scarcity
As developing countries industrialize rapidly, global demand for material resources looks likely to continue to increase dramatically. Over the next
resources from waste products. Other opportunities include entering new markets, collaborating with other sectors, universities or government and discovering of new techniques or processes.
In 2030 it is predicted that some 83 billion tons of minerals, metals and biomass will be extracted from the earth: 55 percent more than in 2010. The message is clear: over the next 20 years, demand for material resources will soar while supplies will become increasingly difficult to obtain.
11 International Energy Agency, 2011, World Energy Outlook 2011 Factsheet 12 International Energy Agency. 2011, World Energy Outlook 2011 Factsheet
Figure 9: Business-as-usual scenario on worldwide resource extraction, 2005 to 2030
Source: Sustainability Europe Research Institute (SERI), GLOBAL 2000, and Friends of the Earth Europe. (2009). Overconsumption? Our use of the world’s natural resources. Vienna & Brussels.
The uneven global distribution of material resources, from oil to land to fresh water, makes planning for the future even more complex. Countries without large domestic supplies must rely on imported materials; as a result investors could increasingly seek to acquire large scale land rights elsewhere in the world – particularly in Africa and South America – to secure supplies of minerals, biomass, agricultural production and even water.
As supplies decrease, governments are likely to protect domestic interests by restricting exports. This is already happening in China, which has tightened control on exports of rare earth elements. China supplies 97 percent of current rare earth demand.13 By restricting global
supply and using more of these materials domestically, it has increased uncertainty around the security of future supplies but increased opportunities for other countries with rare earth resources such as the US.
13 British Geological Society (BGS). (2011). Risk List 2011.
Biomass Minerals Metals Fossil Fuels billion metric tons
2005 2010 2015 2020 2025 2030
0 20 40 60 80 100 120
As supplies decrease,
governments are likely
to protect domestic
interests by restricting
exports.
Water Scarcity
Water scarcity for many businesses can be a major risk to growth and development (Figure 10).
Businesses operating where freshwater is scarce may be vulnerable to water shortages, declines in water quality, water price volatility and reputational issues. They will have to share access to limited or dwindling water resources with municipalities through detailed water management plans and efficiency requirements, and are likely to be subject to regulations that aim to ensure adequate supply for local populations. Potential water shortages pose a threat to business growth and expansion, and conflicts over water supplies may create a security risk to both business operations and markets.
Indeed, according to the World Economic Forum, the projection for freshwater availability in 2030 bears potential for crisis and conflict, since water lies at the heart of everything that is important for human life: food, sanitation, energy, production of goods, transport and the biosphere. “The impact of a changing climate on water availability and quality is, in many regions, an immediate, tangible and local risk,” the WEF says.
Increasing stress on the world’s water supplies threatens to affect food and energy systems around the world due to the interlinked nature of the global economy. The 2030 Water Resources Group (2010) estimates that the global demand for freshwater will exceed supply by 40 percent by 2030 assuming average economic
Potential water
shortages pose a threat
to business growth and
expansion, and conflicts
over water supplies may
create a security risk.
Probability of water scarcity in % gwri_aug11
WATRISKOL4
Less than 2% 2–25% 25–50% 50–75% Above 75%
Figure 10: Water risk in 2030: probability of water scarcity in 2030
growth and no efficiency gains.14 The
increasing demand for water is driven by population growth, increased industrialization in emerging economies such as China, and urbanization. Figure 11 shows where water demand is predicted to rise most, both
geographically and in terms of type of usage: municipal and domestic, agricultural or industrial. Agriculture in India, sub-Saharan Africa, and Asia (excluding China) is forecast to create the most additional water demand to 2030. In China, industrial demand for water will dominate to 2030; the country could account for 40 percent of extra industrial water demand globally.
Climate change puts further pressure on water availability and quality. More frequent extreme weather events caused by climate change, such as droughts and floods, are predicted to accelerate the deterioration of local freshwater supplies. Lack of clean water in rural areas could reduce the amount of viable agricultural land, which would add to the pressure for people
to migrate to cities.
Companies that use water more
efficiently or eliminate water use entirely through closed-loop processes and water recycling can save money and resources and reduce business risks.
Lack of clean water
in rural areas could
reduce the amount of
viable agricultural land,
which would add to the
pressure for people to
migrate to cities.
Figure 11: Increase in annual water demand 2005–2030
Source: The 2030 Water Resources Group. (2009). Charting Our Water Future.
Agriculture Municipal and Domestic Industry
95 50 43 54 283 58 61
109 47 South America
Europe North America Rest of Asia Sub-Saharan Africa India
China
Oceania MENA
Billion m3 Change from 2005
Percent
532
468
440
440
326
184
180
99
178 300 54
338 89 40
320 28 92
243 117 80
181 124 21
72 100 12
89 68 23
85 6 9
21 7 28
14 United Nations Environment Programme. (2011). Towards a Green Economy: Pathways to Sustainable
Water-intensive sectors at the greatest risk from water scarcity include clothing, automobile, food and beverage, biotech/ pharmaceutical, chemical, forest products, electronics, mining, refining and electric utilities.15
Population Growth
The number of people on our planet is predicted to increase to 8.4 billion by 2032 in a moderate growth scenario: a rise of some 20 percent from 2011.16
The populations of developing countries are expected to grow the most while
those of more developed regions, including North America and Europe, are expected to hold roughly steady. In 2032, almost two thirds (58 percent) of people will live in Asia and around one fifth (19 percent) in Africa (Figure 12). Businesses can expect significant supply challenges and price volatility as a result of such a rapid growth in the number of people coupled with an increased use of resources.17
Population Growth will place intense pressures on ecosystems and the supply of natural resources such as food, water, energy and materials.
Businesses can
expect significant supply
challenges and price
volatility as a result of
such a rapid growth in
the number of people.
Asia Africa Europe Latin America and the Caribbean North America Oceania
World population prospects, the 2010 revision
Figure 12: Projected world population growth 1950–210018 (billions)
1950 1960 1970 1980 1990 2000 2.5
3.0 3.5 4.0 4.5 5.0 5.5
0.0 0.5 1.0 1.5 2.0
2010 2020 2030 2040 2050 2060 2070 2080 2090 2100
Source: United Nations, Department of Economic and Social Affairs, Population Division. (2011): World Population Prospects: The 2010 Revision. UN, New York. Available at http://esa.un.org/wpp/Analytical-Figures/htm/fig_2.htm
15 Pacific Institute. (2007). Pacific Institute’s Corporate Reporting on Water: A Review of Eleven Global
Industries.
16 United Nations, Department of Economic and Social Affairs, Population Division. (2011). World Population
Prospects:The 2010 Revision.
17 Behrens, A., Giljum, S., Kovanda, J., Niza, S. (2007). The material basis of the global economy. World-wide
patterns in natural resource extraction and their implications for sustainable resource use policies. Ecological Economics 64, pp. 444-453.
18 United Nations, Department of Economic and Social Affairs, Population Division. (2011). World Population
A lack of employment opportunities for growing young populations in developing nations could result in social unrest and instability. While this is a threat for business, there are also opportunities to create commerce and jobs, and to innovate to address the needs of growing populations for agriculture, sanitation, education, technology, finance and healthcare. Meanwhile, in developed countries with stable populations but a growing proportion of elderly and retired
citizens, businesses will face a shrinking workforce and fiercer competition for skilled workers. Financial challenges related to employee retirement benefits and pension funding will become more common as smaller workforces struggle to support the rising costs of ageing populations. As people live longer, conventions around working life, retirement and personal finance will be
challenged. Businesses are likely to find opportunity in the increasing demand for affordable, accessible pharmaceuticals and healthcare, along with housing and mobility services for older people.
Wealth
The OECD defines the global “middle class” as those with purchasing power of between US$10 and US$100 per capita per day.19 This section of the
global population is predicted to grow 172 percent between 2010 and 2030 (Figure 13)20resulting in a rise in overall
global wealth over the next 20 years. The challenge for businesses is to serve these new markets at a time when resources will become scarcer and more price-volatile. The greatest opportunity awaits those businesses that can provide products and services for a more resource-constrained world.
Businesses will find
opportunity in the
increasing demand for
affordable, accessible
pharmaceuticals and
healthcare.
Figure 13: Growth of the global middle class
9
2010 2020 2030
7
5
3
1
Billion P
eople
1.8
3.2
4.9
Year
Source: KPMG International. (2012). Based on the data published in: OECD Development Centre. (2010). Working Paper No. 285: The Emerging Middle Class in Developing Countries © OECD, page 27
19 ibid 20 Ibid
As workers in the developing world develop higher expectations and become more closely connected with the rest of the world, disparities between working conditions and wages in different countries are likely to become increasingly apparent. There have already been several industrial disputes in developing countries with workers demanding improved conditions and pay, and these are likely to become more common.
As a result, the advantages that many companies have experienced from “cheap labor” in developing nations are likely to be eroded by the growth and new power of the global middle class. The emerging economies – especially China, Brazil, India, Mexico and Russia – could become increasingly influential21 as their middle classes
grow and their share of global output is
predicted to grow from 36 percent to 45 percent between 2010 and 2025.22
In China, for example, consumption is expected to rise from 41 percent of the country’s GDP in 2011 to 55 percent in 2025.23 This shift in spending
power and lifestyle ambition presents huge opportunities for businesses, whose emerging market strategies are moving from a focus on foreign direct investment and offshoring to serving the demands of these newly empowered consumers.
Such growth projections are impressive, However, as incomes rise, resource use per capita also grows. Billions more middle-class consumers will emerge over the next 20 years driving demand for water, energy, food and material resources. Resource supplies, infrastructure and ecosystems will come under increasing stress.
As incomes rise,
resource use per capita
also grows. Billions more
middle-class consumers
will emerge over the
next 20 years.
Figure 14: World economy (GDP) from 2010–2030
Scale and perspective – size of the world economy today and in 2030
0 50 100 150 200 250 350
300
US$ 143trn
US$ 129trn US$ 308trn
US$ 62trn
2010 2030
Source: Standard Chartered Bank (SCB). (2010). The Super-Cycle Report
Real GDP (2009 prices and dollars) Real GDP (2009 prices and market exchange rates) Nominal GDP USD trn
21 Ibid 22 Ibid 23 Ibid
Urbanization
In 2009, for the first time ever, more people lived in cities than in the countryside.24 By 2030 all developing
regions including Asia and Africa are expected to have the majority of their citizens living in urban areas25 and
virtually all population growth over the next 30 years is predicted to be in cities.26 The world’s urban population
is predicted to reach almost 4.9 billion people by 2030(Figure 15).
For these growing cities to be habitable, they will require vast improvements in infrastructure including construction, water and sanitation, electricity, waste, transport, health, public safety and internet and cell phone connectivity. Moving people and goods safely and efficiently through larger, densely populated urban areas will become more challenging and expensive and as cities grow there will be greater demands on scarce resources such as clean water and open green space.
24 UN Habitat. (2010). State of the World’s Cities 2010/2011 – Cities for All: Bridging the Urban Divide. 25 UN Habitat. (2010). State of the World’s Cities 2010/2011 – Cities for All: Bridging the Urban Divide. 26 UN Habitat. (2010). State of the World’s Cities 2010/2011 – Cities for All: Bridging the Urban Divide.
Where improvements
in urban infrastructure
lag behind population
and economic growth,
slums expand and the
gap between rich and
poor widens.
More developed regions Least developed countries
Figure 15: World urbanization prospects, the 2009 revision (% of total population)
Source: United Nation, Department of Economic and Social Affairs, Population Division. (2009). World Urbanization Prospects: The 2009 Revision. UN, New York. Available at http://esa.un.org/unpd/wup/Fig_2.htm
Less developed regions 1950 1955 1960 1965 1970 1975
65% 70% 75% 80% 85% 90% 95%
40% 45% 50% 55% 60%
25% 30% 35%
0% 5% 10% 15% 20%
These requirements create
opportunities for companies that can provide innovative ways to boost eco-efficiency, mitigate climate change, improve transit, alleviate poverty and reduce ecological footprints in areas of high residential and employment density. Cities also provide potential for business in terms of the number and diversity of available human resources. Yet the integrated nature of the modern city requires companies to collaborate with each other, their suppliers, their customers, local and national governments and maybe even their competitors to provide the optimum solutions. IT could allow resources to be used more efficiently. Smart health systems that allow patients to consult their doctors over the Internet, for example, not only free up resources in the health service, they also reduce the amount of traffic on the roads.
City-wide building management
systems and smart grids would be able to reduce power demand at peak times, reducing the need for expensive and polluting peak power plants.
Higher population densities in urban centers are likely to change economic and political dynamics, however, creating new challenges for businesses. Where improvements in urban
infrastructure lag behind population and economic growth, slums expand and the gap between rich and poor widens. While the proportion of urban
populations living in slums is slowly declining, the absolute number is predicted to rise to an estimated 889 million by 2020, an increase of 7 percent from 2010 levels.27 Slums breed social
instability and human conflict, yet even here, business can help by providing access to improved water, sanitation, housing, healthcare, education and employment opportunities.