Development/Plasticity/Repair
Trim9
Deletion Alters the Morphogenesis of Developing and
Adult-Born Hippocampal Neurons and Impairs Spatial
Learning and Memory
Cortney C. Winkle,
1* Reid H. J. Olsen,
2* Hyojin Kim,
1Sheryl S. Moy,
3,4Juan Song,
2,5and Stephanie L. Gupton
5,6,71Curriculum in Neurobiology,2Department of Pharmacology,3Department of Psychiatry,4Carolina Institute for Developmental Disabilities,5University of
North Carolina Neuroscience Center,6Department of Cell Biology and Physiology, and7Lineberger Comprehensive Cancer Center, University of North Carolina, Chapel Hill, North Carolina 27599
During hippocampal development, newly born neurons migrate to appropriate destinations, extend axons, and ramify dendritic arbors
to establish functional circuitry. These developmental stages are recapitulated in the dentate gyrus of the adult hippocampus, where
neurons are continuously generated and subsequently incorporate into existing, local circuitry. Here we demonstrate that the E3
ubiq-uitin ligase TRIM9 regulates these developmental stages in embryonic and adult-born mouse hippocampal neurons
in vitro
and
in vivo
.
Embryonic hippocampal and adult-born dentate granule neurons lacking
Trim9
exhibit several morphological defects, including
exces-sive dendritic arborization. Although gross anatomy of the hippocampus was not detectably altered by
Trim9
deletion, a significant
number of
Trim9
⫺/⫺adult-born dentate neurons localized inappropriately. These morphological and localization defects of
hippocam-pal neurons in
Trim9
⫺/⫺mice were associated with extreme deficits in spatial learning and memory, suggesting that TRIM9-directed
neuronal morphogenesis may be involved in hippocampal-dependent behaviors.
Key words:
arborization; learning; memory; neurogenesis; TRIM9
Introduction
The hippocampus is a subcortical structure associated with
learn-ing and memory. Developlearn-ing hippocampal neurons progress
through stereotypical stages of morphogenesis (
Dotti et al., 1988
;
Bradke and Dotti, 2000
). Neuronal processes ramify to innervate
multiple synaptic partners, and synapses change size and shape in
response to extracellular signals and neural activity (
Song et al.,
2015
). Appropriate morphogenesis requires regulated
cytoskel-etal dynamics to provide protrusive force to alter cell shape and
delivery of materials for plasma membrane expansion (
Pfen-ninger, 2009
;
Gupton and Gertler, 2010
;
Dent et al., 2011
;
Menon
and Gupton, 2016
;
Winkle and Gupton, 2016
).
Hippocampal adult-born neurons recapitulate stages of
em-bryonic neuronal development in a mature nervous system and
participate in specific functions, including learning, memory,
stress responses, and mood regulation (
Deng et al., 2010
;
Ming
and Song, 2011
). These neurons are generated in the subgranular
Received Oct. 26, 2015; revised Feb. 17, 2016; accepted March 7, 2016.
Author contributions: C.C.W., R.H.J.O., S.S.M., J.S., and S.L.G. designed research; C.C.W., R.H.J.O., H.K., S.S.M., and S.L.G. performed research; C.C.W., R.H.J.O., H.K., and S.S.M. analyzed data; C.C.W., R.H.J.O., H.K., S.S.M., J.S., and S.L.G. wrote the paper.
This work was supported by the National Institutes of Health Grants R01-GM108970 to S.L.G., F31-NS087837 to C.C.W., F31-NS093917 to R.H.J.O., U54-HD079124 to S.S.M., and MH106939 to J.S., Brain and Behavioral Foundation to J.S., American Heart Association to J.S., Whitehall Foundation to J.S., the University of North Carolina Department of Pharmacology startup Fund to J.S., and Lineberger Comprehensive Cancer Center startup Funds to S.L.G. We thank Viktoriya Nikolova and Natallia Riddick (Mouse Behavioral Phenotyping Core of the Carolina Institute for Develop-mental Disabilities); Juli Valtschanoff for help with DAB staining; and Carey Hanlin for assistance with the mouse colony.
The authors declare no competing financial interests. *C.C.W. and R.H.J.O. contributed equally to this study.
Correspondence should be addressed to either Dr. Stephanie L. Gupton or Dr. Juan Song, University of North Carolina Neuroscience Center, Chapel Hill, NC 27599. E-mail:[email protected]@email.unc.edu.
DOI:10.1523/JNEUROSCI.3876-15.2016
Copyright © 2016 the authors 0270-6474/16/364940-19$15.00/0
Significance Statement
zone (SGZ) of the dentate gyrus (DG), migrate locally within the
granule cell layer (GCL), mature into granule neurons, and
inte-grate into existing circuitry. Aberrant adult neurogenesis is linked
to neurological disorders (
Deng et al., 2010
;
Christian et al.,
2014
). For instance, deletion of
Pten
or DISC1 knockdown is
associated with aberrant adult-born granule cell morphology
linked to epilepsy or behavioral deficits (
Deng et al., 2009
;
Pun et
al., 2012
;
Zhou et al., 2013
). Although aberrant development of
adult-born neurons may disrupt behavior and elicit pathology,
the molecular factors that regulate development, morphogenesis,
and integration of adult-born hippocampal neurons are largely
unknown.
TRIM9 is an evolutionarily conserved member of the
TRIpar-tite Motif (TRIM) family of ubiquitin ligases (
Berti et al., 2002
;
Tanji et al., 2010
). We recently identified TRIM9 as a regulator of
neuronal morphogenesis in cortical neurons (
Winkle et al., 2014
;
Menon et al., 2015
). TRIM9 directly interacts with exocytic
t-SNARE SNAP25 (
Li et al., 2001
), the actin polymerase VASP
(
Menon et al., 2015
), and DCC, a receptor for the axon guidance
cue netrin (
Winkle et al., 2014
). Deletion of
Trim9
in cortical
neurons is associated with elevated exocytosis, increased stability
of growth cone filopodia, and loss of netrin responsiveness
in
vitro
. These phenotypes are associated with aberrant branching
and projection of cortical axons both
in vitro
and
in vivo
(
Winkle
et al., 2014
;
Menon et al., 2015
), suggesting that TRIM9 regulates
membrane delivery and cytoskeletal dynamics powering cortical
neuron morphogenesis.
The role for TRIM9 in neuronal morphogenesis is
evolution-arily conserved and may extend toward the organization of
synapses. In invertebrates,
Trim9
orthologs are implicated in
netrin-dependent cell migration, axon guidance, and branching
(
Hao et al., 2010
;
Morikawa et al., 2011
;
Morf et al., 2013
). In
Drosophila,
neural activity regulates TRIM9 expression to
estab-lish sensory afferent topographic maps (
Yang et al., 2014
).
TRIM9 localizes to the somal compartment and proximal
den-drites of hippocampal neurons (
Tanji et al., 2010
) and is a
com-ponent of the postsynaptic density (
Jordan et al., 2004
), yet little
is known regarding the role of TRIM9 in dendrites. Netrin-1 and
DCC are present in the developing and adult hippocampus, and
mice deficient in either genes exhibit neuroanatomical defects
(
Serafini et al., 1996
;
Fazeli et al., 1997
;
Bin et al., 2015
;
Yung et al.,
2015
) and altered spontaneous neural activity (
Barallobre et al.,
2000
). TRIM9 mRNA is also enriched in maturing adult-born
neurons (
Chatzi et al., 2016
). Thus, TRIM9 is poised to function
in netrin-dependent hippocampal development and adult
neurogenesis.
Here we identify a role for TRIM9 in the control of hippocampal
neuron morphogenesis in the developing and adult hippocampus.
Deletion of murine
Trim9
caused exuberant arborization and/or
protrusion of dendrites and axons in embryonic and adult-born
hippocampal neurons, mislocalization of adult-born neurons
in
vivo
, and decreased dendritic spine density. These defects were
asso-ciated with severely impaired hippocampal-dependent memory.
Our study supports a role for TRIM9-mediated morphogenesis in
higher neural processes, which is bolstered by the evolutionarily
con-served function of TRIM9 in neuronal morphogenesis, and a recent
genome-wide association study that identified top-ranked SNPs
within the human
TRIM9
gene in patients with schizoaffective
dis-order (
Kanazawa et al., 2013
).
Materials and Methods
Animals. All mouse lines were on a C57BL/6J background and bred at the University of North Carolina with approval from the Institutional
Ani-mal Care and Use Committee. Timed pregnant feAni-males were obtained by placing male and female mice together overnight; the following day was
designated as E0.5 if the female had a vaginal plug.Trim9⫺/⫺,Trim9fl/fl,
and Thy1-GFP mice were described (Feng et al., 2000;Winkle et al.,
2014). A Nex-Cre line (from Dr. Klaus Nave) (Goebbels et al., 2006) and
a TauloxP-stop-loxPGFP line (from Dr. Eva Anton) (Higginbotham et al.,
2012) were crossed withTrim9fl/flmice.
Antibodies, reagents, and plasmids. Antibodies include the following: NH2-terminal TRIM9 rabbit polyclonal (generated using murine TRIM9 recombinant protein amino acids 158 –271), COOH-terminal
TRIM9 rabbit polyclonal raised against COOH of human TRIM9 (Tanji
et al., 2010), mouse monoclonal against humanIII-tubulin (TujI SCBT, 1:2000), mouse anti-Myc (SCBT, 1:1000), anti-GFP chicken (Aves, ab1020, 1:2000), rabbit anti GFAP (Invitrogen, 1:3000), goat anti-GFP (Rockland, 1:250), goat anti-doublecortin (DCX) (SCBT, 1:500), mouse anti-nestin (EMD Millipore, 1:250), rat anti-mCherry (ab167453), and rabbit anti-prox1 (Abcam, 1:500). Fluorescent secondary antibodies and fluorescent phalloidin labeled with AlexaFluor-488, AlexaFluor-568, or AlexaFluor-647 were from Invitrogen. DAPI was from Thermo-Fisher (Molecular Probes). Netrin-1 was concentrated from conditioned media
from netrin-1-expressing HEK293 cells (Serafini et al., 1994;Lebrand et
al., 2004). AAV viruses for expressing mCherry or GFP under control of the CaMKIIpromoter (eGFP and
AAV2-CaMKII-mCherry) were obtained through the UNC vector core at a titer of 1012.
GFP-expressing retroviruses were a generous gift from the laboratory of
Dr. Hongjun Song and have been previously described (Song et al.,
2013). Fluorescent and epitope-tagged TRIM9 mammalian expression
plasmids were previously described (Winkle et al., 2014). The
pHluorin-DCC plasmid is similar to the mCherry-pHluorin-DCC plasmid described by
Win-kle et al. (2014), except that the fluorophore has been switched.
Immunoblotting, coimmunoprecipitation. SDS-PAGE and
immuno-blot analysis were performed using standard procedures with far-red-conjugated 2°antibodies (LiCor). Signal was detected with Odyssey
Imager (LiCor). The coimmunoprecipitation inFigure 1was performed
using IgG-conjugated A/G beads (SCBT) to preclear lysates for 1.5 h at 4°C with agitation. NH2-terminal TRIM9 antibody was incubated with precleared lysates for 2 h before the addition of agarose protein A/G beads (SCBT) overnight at 4°C to precipitate target proteins. For TRIM9 and DCC coimmunoprecipitations, lysates were precleared with a fluo-rescent chicken anti-goat 594 or protein A/G beads (SCBT). NH2-TRIM9 antibody was incubated with precleared lysates for 2 h before the addition of agarose protein A/G beads (SCBT) overnight at 4°C to pre-cipitate target proteins. In a separate reaction, goat polyclonal DCC an-tibody conjugated to A/G (SCBT, A-20) beads were incubated in lysates overnight at 4°C to precipitate target proteins. Beads were washed three times with lysis buffer, and bound proteins were prepared in sample buffer, resolved by SDS-PAGE, and analyzed by immunoblotting.
Im-munoblots were probed with COOH-terminal TRIM9 (seeFig. 1) (Tanji
et al., 2010), or NH2 TRIM9 (seeFig. 2), goat polyclonal DCC (SCBT) and mouse monoclonal GAPDH (SCBT) as a loading control.
Embryonic hippocampal neuron culture, transfection, and imaging. E15.5 dissociated hippocampal neuron cultures were prepared as
de-scribed previously (Viesselmann et al., 2011). Briefly, hippocampi were
microdissected, and neurons were dissociated with trypsin and plated on
poly-D-lysine (Sigma)-coated coverglass, glass-bottom movie dishes
(Matek) or tissue culture plastic in Neurobasal media (Invitrogen) supplemented with B27 (Invitrogen). For transfection of Myc-tagged TRIM9 variants, or cotransfection of mCherry-TRIM9 and DCC-pHluorin, neurons were resuspended after dissociation in Lonza Nucleo-fector solution (VPG-1001) and electroporated according to the manufacturer’s protocol. To assay the effects of netrin-1 stimulation, 250 ng/ml netrin-1 was bath-applied for 24 h followed by fixation and im-munofluorescence. Control and netrin-1-treated cells were fixed in 4% PFA at the indicated time points, permeabilized for 10 min in 0.1% Triton X-100, blocked for 30 min in 10% BSA, and stained with indicated primary antibodies for 1 h at room temperature. Following three washes, species-appropriate, spectrally distinct fluorescent secondary antibodies were added and allowed to incubate for 1 h at room temperature.
-propyl-gallate-based mounting media for imaging. Wide-field epifluorescence images of neurons were analyzed.
Live cell imaging.Time-lapse total internal reflection fluorescence
im-ages ofTrim9⫹/⫹hippocampal neurons expressing mCherry-TRIM9
and DCC-pHluorin at 2 DIV were acquired with an Olympus IX81-ZDC2 inverted microscope with MetaMorph acquisition software, an Andor iXon EM-CCD, and a Tokai Hit environmental chamber, which
maintained 37°C and 5% CO2. Pearson’s correlation of colocalization
between mcherry-TRIM9 and DCC-pHlurin was performed using whole-cell ROIs and an Intensity Correlation Analysis (Coloc2) plugin
for ImageJ (Schindelin et al., 2012). Scrambled images were used as
cor-relative controls.
In vivo.All Thy1-GFP and Tau NEX-Cre mice used for neuroanatomical
studies were anesthetized with an intraperitoneal injection of 1.2% avertin and intracardially perfused with 4% PFA. Brains were removed and fixed in
4% PFA for a subsequent 48 h, rinsed with 1⫻PBS, and rested in 70% EtOH
for at least 24 h before vibratome sectioning. For projection analysis in
Nex-Cre/TauloxP-stop-loxPGFP littermates, 100m coronal sections were cut, and
every other section was permeabilized in detergent solution (1⫻PBS⫹0.1%
Triton X-100⫹0.2% Tween 20) for 1 h on a shaker at room temperatures.
Sections were blocked in 10% BSA in 1⫻PBS for 5 h, then placed in primary
antibody solution (anti-GFP chicken [Aves, ab1020] 1:2000, anti-GFAP rab-bit [Abcam, ab7260] 1:2500 in 1% BSA in PBS) for 24 h on a shaker at 4°C.
Primary antibodies were removed and sections were rinsed in 1⫻PBS for 1 h
before the addition of secondary antibody solution (AlexaFluor-488
chicken, AlexaFluor-561 or AlexaFluor-647 rabbit⫹1% BSA in 1⫻PBS) for
24 h on a covered shaker at 4°C. After postsecondary rinsing with 1⫻PBS,
sections were mounted in DPX mountant (VWR) and were imaged with the
10⫻objective on the LSCM described below. Brains from Thy1-GFP
litter-mates were similarly prepared and imaged with the 20⫻objective on the
LSCM described below. Maximal projections of multiareaZstacks of serial
coronal sections containing the hippocampus of 5-week-old NEX-Cre/
TauloxP-stop-loxPGFP/Trim9fl/fl and NEX-Cre/TauloxP-stop-loxPGFP/
Trim9⫹/⫹littermates were collected.
Forin vivoviral injections, 6-week-oldTrim9⫹/⫹andTrim9⫺/⫺were
stereotaxically injected with a GFP-expressing retrovirus driven by the
ubiquitin promoter (300 nl at 100 nl/min, using a pump-driven 5l
Hamilton syringe and a 33 gauge needle). Stereotaxic coordinates
tar-geted the DG (anteroposterior⫺2.0, mediolateral⫾ ⫺1.5, dorsoventral
⫺2.3). At 14 and 28 d post injection (DPI), mice were deeply anesthetized
with a ketamine/xylazine mixture and transcardially perfused with 10 ml PBS, pH 7.4, followed by 10 ml 4% PFA pH 7.4. Brains were removed and fixed overnight at 4°C in 4% PFA, followed by cryoprotection with 30% sucrose for 48 h. Brains were sectioned coronally using a Leica sliding
microtome at 40m and stored in ethylene-glycol/sucrose/PBS
contain-ing antifreeze solution until immunohistochemical processcontain-ing. Forin
vivolabeling of mature neurons in CA1 and the DG of the adult
hip-pocampus, a similar injection paradigm was followed, substituting
AAV2-CaMKII-mCherry (CA1: anteroposterior⫺2.0, mediolateral⫾
⫺1.5, dorsoventral⫺1.25) and AAV2-CaMKII-eGFP (DG granule-cell
layer: anteroposterior⫺2.0, mediolateral⫾ ⫺1.5, DV⫺2.0). After 2
weeks, mice were transcardially perfused and brains processed as de-scribed above.
Immunohistochemistry. For DAB staining, floating sections were
sub-jected to heat-induced antigen retrieval in 10 mMsodium citrate, pH 6.0,
for 10 min followed by blocking for an hour in 1% BSA and overnight
incubation in 5g/ml antibody solution in 1% BSA with 0.3% Triton
X-100 in PBS. After 3⫻10 min rinses in PBS, sections were treated with
DAB chromogen solution for 20 min and rinsed with deionized water
3⫻before mounting. For immunofluorescence, for all experiments
ex-cept for detection of TRIM9 by immunohistochemistry in GFP-labeled adult-born neurons, floating sections were permeabilized in PBS con-taining 0.5% Triton X-100 (PBST) for 1 h. For TRIM9 fluorescence immunohistochemistry, slide-mounted tissues were permeabilized by
incubation in 100% methanol at⫺20°C for 30 min, followed by three 10
min washes in PBS. With the exception of the removal of Triton X-100 for TRIM9 immunofluorescence staining, tissues were then blocked in 5% donkey serum in PBST (PBST-DS) for an additional hour. Subse-quently, tissue sections were incubated with primary antibody overnight
at room temperature before 3⫻10 min washes in PBST and incubation
in Alexa-conjugated secondary antibody for 2 h at room temperature in
PBST-DS. Sections were again washed 3⫻in PBST followed by 3 washes
in PBS. Nuclei were counterstained with DAPI at a concentration of 1.2
Min the penultimate wash. Tissues were subsequently mounted on
charged slides before confocal imaging.
Microscope descriptions. Immunocytochemistry images were collected on an Olympus IX81-ZDC2 inverted microscope with the following
ob-jective lenses: a UPLFLN 40⫻/1.39 NA objective (Olympus, 1, 2, and 3
DIV), UPlanSapo 20⫻oil/0.85 NA objective (Olympus, 5 DIV), an
au-tomated XYZ stage (Prior), and an Andor iXon EM-CCD. Images were acquired by MetaMorph software. Confocal imaging of brain sections was performed using a Fluoview FV1000 microscope (Olympus) equipped with 405, 488, 568, and 633 nm lasers. Acquisition of
neuro-anatomical images at 3 and 5 weeks postnatal were captured with a 20⫻/
0.75 NA PlanApochromat objective lens and 10⫻/0.4 NA Plan
Apochromat objective lens, respectively. Acquisition of retrovirally
la-beled neurons 14 DPI was performed using a tiling method via 10⫻
objective (NA 04) to capture the entire DG for both somatic location and
axonal targeting. Dendrites of neurons 14 DPI were captured using a 40⫻
oil 1.3 NA with a 1m step size. Synapses of retrovirally labeled neurons
28 DPI were captured with a 60⫻oil objective at 2⫻zoom and 0.33m
step size. Images of DCX and nestin-stained retrovirally naive tissue were
acquired with a 40⫻1.3 NA 1.42 objective. Axons from GFP⫹
adult-born granule cells 28 DPI were imaged in CA3 using an Olympus
confo-cal microscope with a 60⫻oil objective.
Image analysis.In vitrocell images at 1 and 2 DIV were analyzed as
follows: Stage 1 was defined by a lack ofIII-tubulin and F-actin-positive
neurites extending from the soma. Stage 2 is defined by the presence of
III-tubulin and F-actin-positive neurites extending from the soma.
Stage 3 neurons are defined similarly but also have a single neurite that is at least 2 times the length of other neurites, presumed to be the axon (Dotti et al., 1988). Forin vitroimages at 3 and 5 DIV, all neurites were measured for length and identified as primary (extending from the soma), secondary (extending from the primary neurites), or tertiary (ex-tending from secondary). The longest neurite ex(ex-tending from the soma
was defined as the axon (n⫽3 separate experiments, at least 50 cells per
condition).
Position-matched sections between littermates were analyzed for axon projection comparisons and dendritic complexity. For Thy1-GFP
litter-mates, the number of GFP⫹soma were counted and divided by the
number of total nuclei in a given ROI. To compare GFP⫹dendritic
arbors, theZ-stacks of littermates were processed into maximum
projec-tion images, a threshold was applied to the area of GFP⫹fibers. The
resulting area was then divided by the number of GFP⫹soma within the
ROI. To measure axonal material, ROIs were drawn in ImageJ around
the area containing GFP⫹fibers in maximum projection images of
position-matched coronal sections of NEX-Cre/TauloxP-stop-loxPGFP
littermates.
To quantify somal localizationin vivo, the GCL of a whole DG (average
of 6/animal,n⫽3 per group) was horizontally divided into three
equal-sized compartments (seeFig. 5B), and the number of soma residing in
these three layers (inner layer, middle layer, outer layer) as well as the
hilar region were quantified. Data were analyzed using ANOVA withpost
hoc ttests using a Bonferroni correction.
Dendrites of GFP⫹neurons 14 DPI were analyzed using the
simple-neurite tracer plugin for ImageJ (Schindelin et al., 2012). Neurons (10
per animal,n⫽3 per group) were traced in three dimensions to allow for
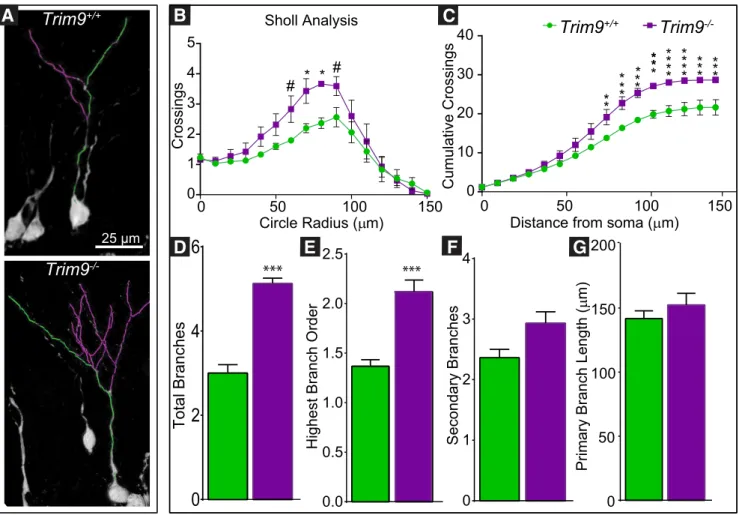
accurate reconstruction of complexity and path length. The length of the primary (longest) dendrite was measured, as well as the total number of branches, and the order of these branches (secondary, tertiary, etc.). Sholl analysis was performed by counting the number of crossings by dendrites of concentric circles originating at the soma with increasing radii of 10 m. Sholl analysis data were analyzed using a two-way ANOVA with distance from soma and genotype as the independent variables. Addi-tionally, cumulative branching was analyzed using Kolmagorov–
Smirnoff test of best fit.Post hocmultiple comparisons were conducted
total length were analyzed using a two-tailedttest. In all tests, data were analyzed for equality of variances. Initial dendrite cross-sectional areas and lengths were analyzed using the surface renderer and object analyzer advanced tools in Huygens software (version 14.10, Scientific Volume Imaging). The dendrite arising from the soma and extending to the first branch point was selected, and its volume and length were quantified using Huygens software. The average cross-sectional area was calculated by volume divided by length of the initial dendrite segments.
Analysis of spine density and classification of the subtype spines was
performed on 3D image stacks using NeuronStudio (n⫽3 animals per
group,⬎1800 spines per animal). NeuronStudio supports automated
labeling and classifying of spines (mushroom, stubby, and thin) using
the threshold-based segmentation (Rodriguez et al., 2008).
Three-dimensional image stacks were loaded, auto-aligned, and smoothed us-ing a Gaussian filter. Spine density was quantified by dividus-ing the number of spines by dendrite length. Spines from secondary and tertiary branches were scored, and analyses were performed by an experimenter blind to genotype and the experimental manipulation.
GFP⫹axonal segments adult-born granule cells at 28 DPI were
semi-manually traced in 3D using the simple-neurite tracer plugin for FIJI (Schindelin et al., 2012). The density of protrusions per 100m for any individual animal was not normally distributed, negating comparing the average per animal. Instead, the pooled data are shown per animal in
Figure 9D, and were compared by Mann–Whitney test. Gross hippocam-pal morphology following viral labeling of mature CaMKII-expressing pyramidal cells in CA1 and granule cells in the CA1 and the DG was assessed qualitatively by microscopy, examined for displacement of CA1 pyramidal cells or DG granule cells, as well as the targeting location of axons from the mature DG granule cells. Thickness of CA1 pyramidal cell
layer was assessed by imaging coronal sections (n⫽3 per group, 3 or 4
sections per animal) at 40⫻on a laser-scanning confocal microscope.
The length of a line drawn from the top (dorsal) to the bottom (ventral) of the dense band of nuclei was measured in FIJI and averaged within
each animal. Group means were compared via two-tailedttest.
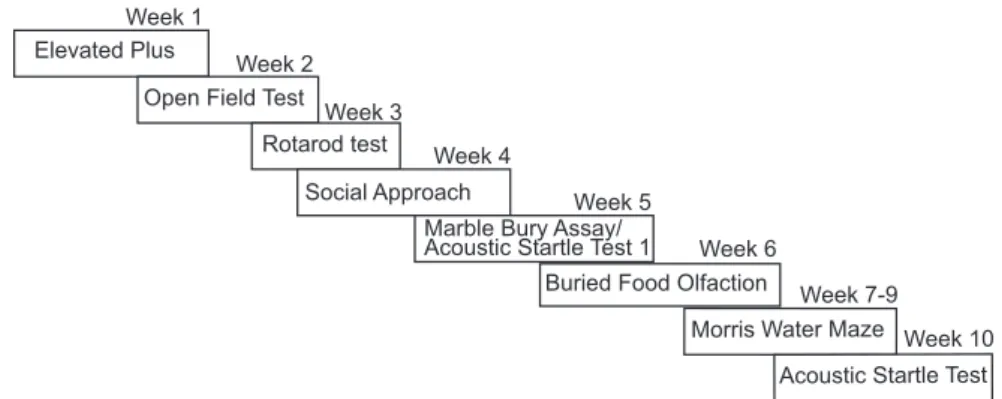
Behavioral phenotyping. Subjects were 13Trim9⫹/⫹mice (8 males and
5 females) and 20Trim9⫺/⫺mice (6 males and 14 females), taken from 8
litters. Testing began when animals were⬃5–7 weeks of age. The testing
regimen was conducted across 10 weeks, so that mice were only exam-ined in one or two procedures each week, to allow recovery between each test. The regimen was also designed to have the least aversive assays, such as elevated plus maze and open field, at the beginning of the study, and the more stressful procedures, such as the Morris Water Maze, near the end, to help minimize any carryover effects. This also allows for gradual acclimation of the mice to handling, the laboratory environment, and novel testing chambers, so that mice were familiar with being moved and handled by the time testing began for more complex learning task in the water maze. This phenotyping battery has been standardized and refined
across multiple inbred mouse strains and mutant lines (Pfankuch et al.,
2005;Moy et al., 2008,2009a,b;Haley et al., 2013;Olsen et al., 2013a,
2013b;Raber et al., 2014;Vorhees and Williams, 2014;Urban et al.,
2015). For each procedure, measures were taken by an observer blind to
mouse genotype (Trim9⫹/⫹orTrim9⫺/⫺). Behavioral data were
ana-lyzed using one-way or repeated measures ANOVA, with factor geno-type. Fisher’s protected least-significant difference tests were used for comparing group means only when a significant F value was determined. Within-group comparisons were conducted to determine side prefer-ence in the three-chamber test for social approach, and for quadrant preference in the Morris Water Maze. For all comparisons, significance
was set atp⬍0.05.
Elevated plus maze. Mice were given one 5 min trial on the plus maze, which had two walled arms (the closed arms, 20 cm in height) and two open arms. The maze was elevated 50 cm from the floor, and the arms
were 30 cm long. Animals were placed on the center section (8 cm⫻8
cm) and allowed to freely explore the maze. Measures were taken of time on, and number of entries into, the open and closed arms.
Marble-burying assay. Mice were tested in a Plexiglas cage located in a sound-attenuating chamber with ceiling light and fan. The cage con-tained 5 cm of corncob bedding, with 20 black glass marbles (14 mm
diameter) arranged in an equidistant 5⫻4 grid on top of the bedding.
Subjects were given access to the marbles for 30 min. Measures were taken of the number of buried marbles (two-thirds of the marble covered by the bedding).
Buried food test for olfactory function. Several days before the olfactory test, an unfamiliar food (Froot Loops, Kellogg) was placed overnight in the home cages of the mice. Observations of consumption were taken to ensure that the novel food was palatable. At 16 –20 h before the test, all food was removed from the home cage. On the day of the test, each
mouse was placed in a large, clean tub cage (46 cm length⫻23.5 cm
width⫻20 cm height), containing paper chip bedding (3 cm deep), and
allowed to explore for 5 min. The animal was removed from the cage, and one Froot Loop was buried in the cage bedding. The animal was then returned to the cage and given 15 min to locate the buried food. Measures were taken of latency to find the food reward.
Hotplate test for thermal sensitivity. Individual mice were placed in a tall plastic cylinder located on a hotplate, with a surface heated to 55°C (IITC Life Science). Reactions to the heated surface, including hindpaw lick, vocalization, or jumping, led to immediate removal from the hotplate. Measures were taken of latency to respond, with a maximum test length of 30 s.
Open field test. Exploratory activity in a novel environment was
as-sessed by a 1 h trial in an open field chamber (41 cm⫻41 cm⫻30 cm)
crossed by a grid of photobeams (VersaMax system, AccuScan Instru-ments). Counts were taken of the number of photobeams broken during the trial in 5 min intervals, with separate measures for locomotion (total distance traveled) and rearing movements. Time spent in the center re-gion of the open field was measured as an index of anxiety-like behavior.
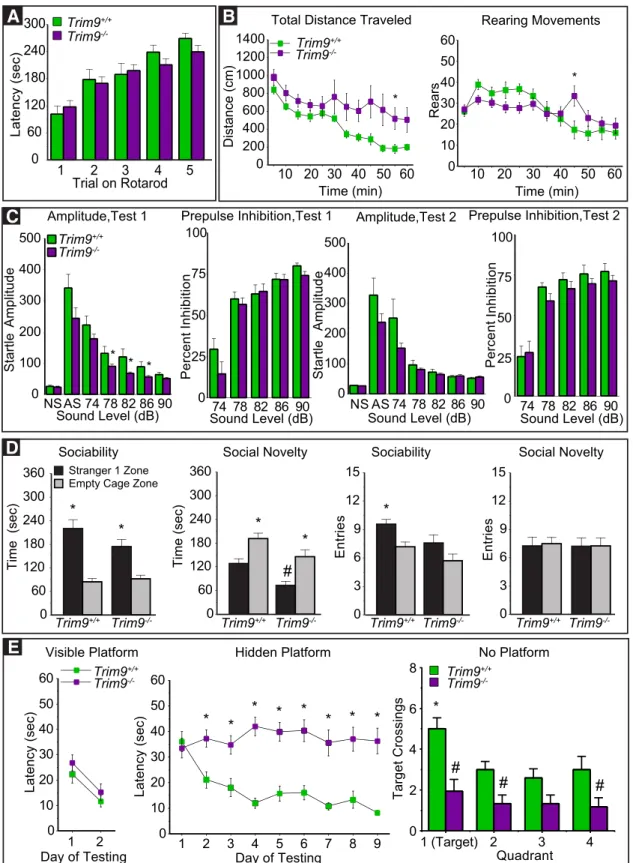
Rotarod. Subjects were tested for motor coordination and learning on an accelerating rotarod (Ugo Basile, Stoelting). For the first test session, animals were given three trials, with 45 s between each trial. Two addi-tional trials were given 48 h later. Revolutions per minute (rpm) was set at an initial value of 3, with a progressive increase to a maximum of 30 rpm across 5 min (the maximum trial length). Measures were taken for latency to fall from the top of the rotating barrel.
Sociability in a 3-chamber choice test. Mice were evaluated for the
ef-fects ofTrim9deficiency on social preference. The procedure consisted of
three 10 min phases: a habituation period, a test for sociability, and a test for social novelty preference. For the sociability assay, mice were given a choice between proximity to an unfamiliar conspecific (“stranger 1”) versus being alone. In the social novelty phase, mice were given a choice between the already-investigated stranger 1, versus a new unfamiliar mouse (“stranger 2”). The social testing apparatus was a rectangular, 3-chambered box fabricated from clear Plexiglas. Dividing walls had doorways allowing access into each chamber. An automated image track-ing system (Noldus Ethovision) provided measures of time in spent within 5 cm of the Plexiglas cages (the cage proximity zone) and entries into each side of the social test box.
At the start of the test, the test mouse was placed in the middle chamber and allowed to explore for 10 min, with the doorways into the 2 side chambers open. After the habituation period, the test mouse was en-closed in the center compartment of the social test box, and an unfamil-iar, sex-matched C57BL/6J adult (stranger 1) was placed in one of the side chambers. The stranger mouse was enclosed in a small Plexiglas cage drilled with holes, which allowed nose contact but prevented fighting. An identical empty Plexiglas cage was placed in the opposite side of the chamber. Following placement of the stranger and the empty cage, the doors were reopened, and the subject was allowed to explore the entire social test box for a 10 min session. Measures were taken of the amount of time spent in each cage proximity zone, and the number of entries into each chamber, by the automated tracking system. At the end of the so-ciability phase, stranger 2 was placed in the empty Plexiglas container, and the test mouse was given an additional 10 min to explore the social test box. Time spent in cage proximity zones is reported.
weak prestimulus leads to a reduced startle in response to a subse-quent louder noise.
Subjects were given two acoustic startle tests (San Diego Instruments, SR-Lab system): one in week 5 of the behavioral study and one in week 10. Briefly, mice were placed in a small Plexiglas cylinder within a larger, sound-attenuating chamber. The cylinder was seated upon a piezoelec-tric transducer, which allowed vibrations to be quantified and displayed on a computer. The chamber included a ceiling light, fan, and a loud-speaker for the acoustic stimuli. Background sound levels (70 dB) and calibration of the acoustic stimuli were confirmed with a digital sound level meter (San Diego Instruments).
Each session consisted of 42 trials that began with a 5 min habituation period. There were 7 different types of trials: the no-stimulus trials, trials with the acoustic startle stimulus (40 ms; 120 dB) alone, and trials in which a prepulse stimulus (20 ms; 74, 78, 82, 86, or 90 dB) occurred 100 ms before the onset of the startle stimulus. Measures were taken of the startle amplitude for each trial across a 65 ms sampling window, and an overall analysis was performed for each subject’s data for levels of
pre-pulse inhibition at each prepre-pulse sound level (calculated as 100⫺
[(re-sponse amplitude for prepulse stimulus and startle stimulus together/
response amplitude for startle stimulus alone)⫻100].
Morris Water Maze. The water maze consisted of a large circular pool
(diameter⫽122 cm) partially filled with water (45 cm deep, 24°C-26°C),
located in a room with numerous visual cues. The procedure involved two different phases: a visible platform test and acquisition in the hidden
platform task. Two male mice (oneTrim9⫹/⫹and oneTrim9⫺/⫺) were
not tested in the water maze, due to injuries from home-cage fighting.
One femaleTrim9⫺/⫺mouse failed to swim to the visible platform on 3
of the 4 trials conducted on the second day, and was not tested in the spatial learning procedure.
Visible platform test. Each mouse was given 4 trials per day, across 2 d, to swim to an escape platform cued by a patterned cylinder extending above the surface of the water. For each trial, the mouse was placed in the pool at 1 of 4 possible locations (randomly ordered), and then given 60 s to find the visible platform. If the mouse found the platform, the trial ended, and the animal was allowed to remain 10 s on the platform before the next trial began. If the platform was not found, the mouse was placed on the platform for 10 s and then given the next trial. Measures were taken of latency to find the platform and swimming speed via an auto-mated tracking system (Noldus Ethovision).
Acquisition in a hidden platform task. Following the visible platform task, mice were tested for their ability to find a submerged, hidden
escape platform (diameter⫽12 cm). Each animal was given 4 trials
per day, with 1 min per trial, to swim to the hidden platform.
Crite-rion for learning was an average group latency ofⱕ15 s to locate the
platform. Mice were tested until the group reached criterion, with a maximum of 9 d of testing. When criterion was reached, mice were given a 1 min probe trial in the pool with the platform removed. Quadrant selectivity, an index of spatial learning, was evaluated by measuring number of crossings over the location where the platform (the target) had been placed during training, versus the correspond-ing area in the other three quadrants.
Statistics. At least three independent experiments were performed for each assay. Data distribution normality was determined using the
Shapi-ro–Wilkes test. Normally distributed data were compared by unpairedt
test, for two independent samples, or ANOVA with Holm–Sidek (⬎5
comparisons) or Bonferroni (⬎2,⬍5 comparisons)post hoccorrection,
For non-normal data, the Mann–Whitney test was used or Kruskal–
Wallis nonparametric ANOVA with Bonferonnipost hoccorrection for
⬎2 comparisons. All data are presented as mean⫾SEM.
Results
TRIM9 is expressed in the embryonic and adult
murine hippocampus
Based on evolutionary conservation, presence and function in
developing neurons, and a possible role in human
neuropathol-ogy, we hypothesized that TRIM9 functioned in establishing or
maintaining hippocampal neuron morphology and connectivity.
Previous studies suggested that TRIM9 was expressed in the
hip-pocampus, although RNA probe and antibody specificity were
not confirmed in
Trim9
⫺/⫺samples (
Li et al., 2001
;
Berti et al.,
2002
;
Tanji et al., 2010
). We reported the generation of a
condi-tional
Trim9
allele (
Trim9
fl) and germline deletion of murine
Trim9
using CMV-Cre
Trim9
⫺/⫺(
Winkle et al., 2014
). In lysate
prepared from embryonic day 15.5 (E15.5)
Trim9
⫹/⫹hippocam-pus, three expected TRIM9 isoforms were observed, which were
absent from E15.5
Trim9
⫺/⫺hippocampus (
Fig. 1A
). Similarly,
TRIM9-immunoreactive bands were present in adult
Trim9
⫹/⫹hippocampus, but not
Trim9
⫺/⫺hippocampus (
Fig. 1A
). To
fur-ther confirm the specificity of TRIM9 antibodies, lysate was
im-munoprecipitated with antibodies raised against NH2-terminal
BBox domains of TRIM9 (
Winkle et al., 2014
) and probed with
antibodies raised against the COOH terminus of human TRIM9
(
Tanji et al., 2010
). Immunoprecipitation enriched
TRIM9-immunoreactive bands in
Trim9
⫹/⫹hippocampus, but not in
Trim9
⫺/⫺hippocampus (
Fig. 1A
). Immunohistochemistry of
coronal sections through the hippocampus of adult littermates
revealed TRIM9 immunoreactivity throughout the intact
hip-pocampus of
TRIM9
⫹/⫹mice, including the CA1 and DG,
whereas
Trim9
⫺/⫺animals exhibit only nonspecific background
immunoreactivity (
Fig. 1B
,
C
). Thus, TRIM9 is present in both
the developing and adult murine hippocampus and absent from
the hippocampus of
Trim9
⫺/⫺animals.
TRIM9 interacts and colocalizes with the netrin-1 receptor
DCC in hippocampal neurons
TRIM9 directly interacts with the netrin receptor DCC, and these
proteins colocalize in embryonic mouse cortical neurons (
Win-kle et al., 2014
). To characterize the localization of TRIM9 and
DCC in hippocampal neurons, we introduced fluorescently
tagged TRIM9 and DCC into dissociated hippocampal neurons
and performed live cell total internal reflection fluorescence
im-aging (
Fig. 2A
). mCherry-TRIM9 and DCC-pHluorin exhibited
moderate colocalization (Pearsons coefficient 0.34
⫾
0.052),
which was greater than that observed upon scrambling of
DCC-pHluorin images (0.0008,
p
⬍
0.01). Such colocalization is
de-tected in the shafts of neurites and the tips of branches (
Fig. 2A
,
zoomed insets). To determine whether endogenous TRIM9 and
DCC interact, we performed coimmunoprecipitation.
Immuno-precipitation with DCC or TRIM9-specific antibodies
coprecipi-tated TRIM9 or DCC, respectively, from
Trim9
⫹/⫹but not
Trim9
⫺/⫺E15.5 hippocampal lysate (
Figure 2B
). Similarly,
im-munoprecipitation with DCC antibodies coprecipitated TRIM9
from
Trim9
⫹/⫹, but not
Trim9
⫺/⫺adult hippocampus (
Fig. 2C
).
Although relatively low amounts of coimmunoprecipitated
pro-tein were observed in either embryonic or adult hippocampal
lysate, this is typical of interactions with E3 ubiquitin ligases (
Kim
et al., 2015
).
Deletion of
Trim9
increases hippocampal dendritic and
axonal complexity
in vitro
TRIM9 regulates the branching and guidance of axons of
devel-oping murine cortical neurons (
Winkle et al., 2014
;
Menon et al.,
2015
) and in invertebrates (
Hao et al., 2010
;
Morikawa et al.,
2011
;
Morf et al., 2013
). TRIM9 is present in cultured
hippocam-pal neurons, where its expression increases over time
in vitro
(
Fig.
3A
). Thus, we examined whether loss of
Trim9
affected the
ste-reotypical morphological progression of hippocampal neurons
(
Dotti et al., 1988
) (
Figure 3A
). At 1 and 2 DIV, more
Trim9
⫺/⫺Trim9
⫹/⫹neurons (
p
⬍
0.005 for 1 DIV,
p
⬍
0.01 for 2 DIV).
This suggests that the loss of
Trim9
accelerates neuronal
morpho-genesis (
Fig. 3B–E
). Because TRIM9 and DCC interact and
colo-calize in hippocampal neurons, we tested netrin responses. Bath
application of netrin-1 accelerated neuronal morphogenesis in
Trim9
⫹/⫹neurons (
p
⬍
0.05) but did not further accelerate
mor-phological progression of
Trim9
⫺/⫺neurons (
Fig. 3B–E
).
After establishing a polarized neuronal morphology, the
pre-sumed axon (longest neurite) and dendrites extend and ramify,
which increases the synaptic capacity of the neuron (Stage 4 –5;
Fig. 3A
). We compared the length and branching of axons and
dendrites at 3 and 5 DIV (
Fig. 3C–E
). The overall number and
length of neurites were unchanged by loss of
Trim9
. However,
Trim9
⫺/⫺hippocampal neurons exhibited increased density of
branching of both the axon and the remaining neurites at 3 DIV
(
p
⬍
0.0001 for both axons and dendrites). This continued at 5
DIV, when
Trim9
⫺/⫺neurons exhibited a higher density of
sec-ondary and tertiary dendritic branching (
p
⬍
0.0001 for both
axons and dendrites). The 24 h bath application of netr1
in-creased the density of axonal and dendritic branches at 3 DIV in
Trim9
⫹/⫹(
p
⬍
0.01 for both axons and dendrites), whereas only
axon branching density increased following netrin-1 treatment in
Trim9
⫺/⫺neurons (
p
⬍
0.005). Bath application of netrin-1 for
24 h before fixation at 5 DIV only increased the density of tertiary
dendrites and secondary axon branches in
Trim9
⫺/⫺hippocam-pal neurons (
p
⬍
0.001 for both;
Fig. 3E
). These differences
sug-gest that TRIM9 normally restrains the acquisition of neuronal
complexity, which allows for a netrin-dependent promotion of
morphogenesis.
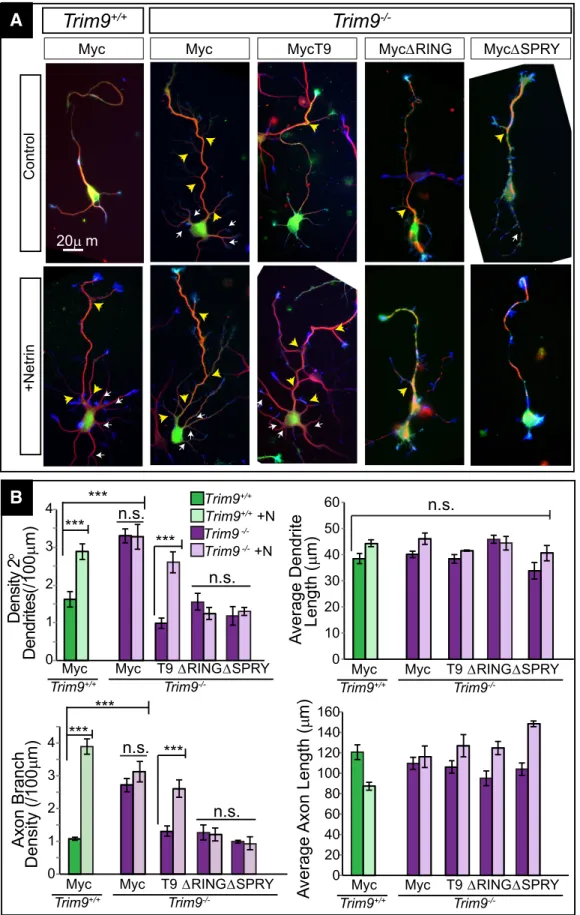
Expression of full-length TRIM9 rescues aberrant
arborization in
Trim9
ⴚ/ⴚneurons
To confirm the aberrant dendritic and axonal arborization were
due to loss of TRIM9, we introduced Myc-TRIM9 expression
plasmids into
Trim9
⫺/⫺hippocampal neurons and assessed
ar-borization at 3 DIV (
Fig. 4
). Myc-TRIM9 expression decreased
constitutive dendritic and axonal arborization to wild-type levels
and restored netrin-1 sensitivity (
p
⬍
0.0001), thereby rescuing
aberrant arborization in
Trim9
⫺/⫺neurons. To assess the role of
TRIM9 ligase activity, we introduced MycTRIM9
⌬
RING, which
lacks the ubiquitin ligase RING domain (
Winkle et al., 2014
).
MycTRIM9
⌬
RING reduced the aberrant constitutive axonal and
dendritic arborization of
Trim9
⫺/⫺neurons (
Fig. 4
;
p
⬍
0.0005
for both) but failed to restore sensitivity to netrin-1. Expression
of a TRIM9 variant that lacks the DCC binding domain,
MycTRIM9
⌬
SPRY, reduced elevated arborization (
Fig. 4
;
p
⬍
0.0005), but similarly failed to restore netrin-1 sensitivity. These
data suggest that TRIM9 restrains morphogenesis of
hippocam-pal neurons and that TRIM9 ligase activity and binding to DCC
are necessary for netrin-1-dependent morphogenesis.
Deletion of
Trim9
is associated with dendritic and axonal
defects
in vivo
To determine whether arborization defects also occurred
in vivo
in the absence of
Trim9
, we crossed
Trim9
⫺/⫺mice with
Thy1-GFP mice (line M), which express Thy1-GFP in a subset of
hippocam-pal neurons (
Feng et al., 2000
). Extensive overlapping dendritic
arbors of GFP-expressing (GFP
⫹) neurons at P21 prohibited
tracing of individual dendrites; we therefore compared the area of
GFP
⫹dendritic material in a ROI in the molecular layer
encom-100μm
Trim9
+/+Trim9
-/-50
μ
m
Trim9
+/+Trim9
-/-Trim9
+/+Trim9
-/-500
μ
m
B
Adult
IB:TRIM9 (COOH)
IB:GAPDH IP:TRIM9
(NH2)
E15.5
A
80kDa
37kDa
Trim9
+/+
Trim9
-/-Trim9
+/+
Trim9
-/-Trim9
+/+
Trim9
-/-C
E
100 μm
Trim9
+/+Trim9
-/-C
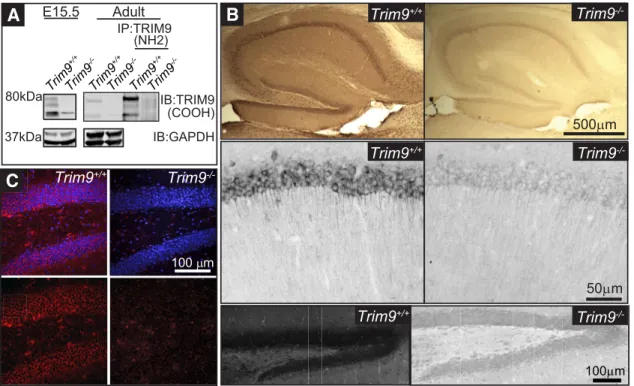
Figure 1. TRIM9 is expressed in the embryonic and adult hippocampus.A, Western blot of hippocampal lysate fromTrim9⫹/⫹andTrim9⫺/⫺embryonic day 15.5 (E15.5) mice (left), showing the immunoreactivity of the three splice variants of TRIM9 present inTrim9⫹/⫹samples but absent fromTrim9⫺/⫺samples. GAPDH shown as loading control. Western blot of inputs and TRIM9 immunoprecipitated from adult hippocampal lysate fromTrim9⫹/⫹andTrim9⫺/⫺mice (right). TRIM9 was precipitated with antibodies that recognized the NH2 terminal BBox domains of TRIM9, and probed with antibodies raised against the COOH terminus of TRIM9. GAPDH shown as loading control for inputs (first 2 lanes).B, DAB immunohistochemistry showing immunopositivity for TRIM9 in the hippocampus of adultTrim9⫹/⫹but notTrim9⫺/⫺mice. Zoomed images demonstrate TRIM9 expression in the CA1 (middle) and DG (bottom) of adultTrim9⫹/⫹mice, but not
passing dendritic termination points,
rel-ative to the number of GFP
⫹soma in the
CA3 GCL. This revealed that Thy1-GFP/
Trim9
⫺/⫺hippocampal neurons had
in-creased dendritic material compared with
Thy1-GFP/
Trim9
⫹/⫹littermates (
Fig. 5A
;
p
⬍
0.05), with no changes in the
percent-age of GFP
⫹neurons (14.1
⫾
2.1% vs
15.4
⫾
0.8%).
A subset of CA3 pyramidal cells project
to the septal nuclei (
Gaykema et al., 1991
;
Witter, 2007
), and this projection is
dis-rupted by netrin-1 deficiency (
Barallobre
et al., 2000
). To determine whether deletion
of
Trim9
also disrupted this projection, we
used
NEX-Cre/Tau-LoxP-STOP-LoxP-mGFP mice (
Goebbels et al., 2006
)
crossed with
Trim9
fl/flmice. The NEX
promoter drives Cre expression in
post-mitotic, excitatory neocortical and
hip-pocampal neurons, and is not detectably
expressed in neurons originating in the
septum (
Gong et al., 2003
;
Goebbels et al.,
2006
), thus allowing expression of mGFP
and deletion of
Trim9
when the relevant
alleles are present. Although no gross
an-atomical defects were apparent in the
hippocampus (
Figs. 1
B
,
C
,
5B
), we
ob-served a 20
⫾
6.5% increase in the area
containing GFP
⫹fibers in the septal
nuclei of
NEX-Cre/Tau-LoxP-STOP-LoxP-mGFP/
Trim9
fl/flmice compared
with
NEX-Cre/Tau-LoxP-STOP-LoxP-mGFP/
Trim9
⫹/⫹littermates (
Fig. 5C
;
p
⫽
0.035). Increased axonal material within
the septal nuclei may originate from
mis-guided axons and/or elevated axonal
branching, as we have previously observed in the corpus callosum
of
Trim9
⫺/⫺mice (
Winkle et al., 2014
). Although increased
ax-onal material is likely due to changes in the hippocampal
projec-tions that normally innervate the septal nuclei, a possible
contribution of neocortical GFP
⫹fibers misprojecting into this
area is not ruled out. However, these data are consistent with the
hypothesis that morphology defects observed in
Trim9
⫺/⫺hip-pocampal neurons
in vitro
impact circuit assembly
in vivo
.
Deletion of
Trim9
causes somal mislocalization of adult-born
hippocampal neurons
As the analysis of neuronal morphology in the adult brain was
complicated by the complex, overlapping processes of
hip-pocampal neurons and the high level of neuronal labeling in
reporter mice, we sought another method to investigate the
mor-phology of hippocampal neurons
in vivo
. Because TRIM9 is
present in the adult hippocampus where neurogenesis and
mor-phogenesis occur, we investigated whether deletion of
Trim9
af-fected the development of adult-born DG neurons and their
incorporation into local circuitry. Stereotaxic introduction of
GFP-containing retrovirus into the DG was used to sparsely label
and birth date newly born neurons, allowing for comparison of
their placement and morphology
in vivo
. Consistent with
find-ings that TRIM9 mRNA is enriched in maturing adult-born
neu-rons relative to mature counterparts (
Chatzi et al., 2016
), these
GFP
⫹adult-born neurons were immunopositive for TRIM9
(
Fig. 6A
), suggesting that TRIM9 is expressed in these cells during
their maturation. Comparison of
Trim9
⫹/⫹and
Trim9
⫺/⫺litter-mates revealed unusual localization of adult-born neurons in
Trim9
⫺/⫺mice. Whereas newborn neurons generally reside in
the inner GCL at 14 days post injection (DPI) (
Fig. 6B–D
),
retroviral-labeled GFP
⫹adult neurons in the DG were
mislocal-ized in
Trim9
⫺/⫺animals (
p
⬍
0.0001;
Fig. 6C
,
D
). An increased
percentage of
Trim9
⫺/⫺neurons localized within the middle
third of the GCL (
p
⬍
0.0001) and the hilar region (
p
⫽
0.0076),
with a reduced proportion of
TRIM9
⫺/⫺neurons in the
appro-priate inner third region of the GCL (
p
⬍
0.0001;
Fig. 6D
). To
decipher whether this improper localization could be due to
mis-placed neural stem cells or aberrant migration of progenitors and
immature neurons, we stained retrovirus naive tissue in
Trim9
⫺/⫺mice for nestin, a stem cell marker, and DCX, an
im-mature neuronal marker. Nestin
⫹stem cells resided within the
SGZ as expected (
Fig. 6E
). Although most DCX
⫹cells resided
normally in the SGZ and inner GCL, a subset of DCX
⫹immature
neurons or neuroblasts were present in the middle region of the
GCL and in the hilus (
Fig. 6E
). These data are consistent with
aberrant migration of neuroblasts and/or immature neurons,
rather than misplaced stem cell populations. Further, costaining
with Prox1, a granule cell marker, confirmed the identity of
mis-localized GFP
⫹cells as maturing granule cells (
Fig. 6F
),
suggest-ing mislocalized
Trim9
⫺/⫺adult-born cells continue maturation
along the granule-cell lineage.
0.0m 1:40 3:33 5:00
1 2 3 4
A
0 0.1 0.2 0.3 0.4 0.5 0.6
DCC:TRIM9 scrambled Outlier Boxplot
95% CI Mean Diamond
10 μm
20 μm
DCC
TRIM9
Input IP:DCC IP:TRIM9
+/+ -/- +/+ +/+ -/-190kDa
75kDa
E15.5 Hippocampus
B
Trim9
Trim9
C
DCC
TRIM9
Input
+/+ -/-
IP:DCC
+/+-/-190kDa 75kDa
37kDa
GAPDH
IP:Goat IgG
+/+
-/-Adult Hippocampus
pHluorin DCC
mCherry TRIM9
0
40
80
120
Axon Length
(
μ
m)
3 DIV
20
μ
m
T9
+/+T9
-/-C
0
1
2
3
4
Axon Branch
Density (/100
μ
m)
***
T9
+/+T9
-/-10
20
30
40
50
Dendrite Length
(
μ
m)
0
T9
+/+T9
-/-1
2
3
Density 2
oDendrites
(/
1
0
0
μ
m)
0
T9
+/+T9
-/-***
***
N.S.C
Trim9
+/+Control
+Netrin
Control
Trim9
-/-+Netrin
Trim9
+/+Control
+Netrin
Control
Trim9
-/-+Netrin
Trim9
+/+Trim9
-/-Control
+Netrin
Control
+Netrin
1 DIV
STAGE 3
STAGE 2
STAGE 1
% neurons in developmental stage
T9
+N +/+T9
+N -/-B
2 DIV
20
μ
m
0
20
40
60
80
100
0
20
40
60
80
100
T9
+/+
+N +N
T9
-/-1DIV
2DIV
*
******
* *
20μmD
Primary dendrite (1o)
Secondary dendrite (2o)
Tertiary dendrite (3o)
Axon
Primary axon branch (1o)
Secondary axon branch (2o) Color Key 0 0.5 1 1.5 2 2.5 2
o Axon
Branch Density
E
0 1 2 3 4 5 6 7# of 1
o Dendrites
T9+/+ T9-/- 0
20 40 60 80 100
Dendrite Length (
μ
m)
T9+/+ T9-/-
0 50 100 150 200 250 300
Axon Length (
μ
m)
T9+/+ T9-/-
0 0.5 1 1.5 2 2.5 3 3.5 2
o Dendrite Density
T9+/+ T9-/-
0 0.4 0.8 1.2 1.6 3
o Dendrite Density T9+/+ T9-/-
0 0.5 1 1.5 2 2.5 3 3.5 1
o Axon Branch
Density
T9+/+ T9-/-
T9+/+ T9-/-
Trim9+/+ Trim9+/+ +N Trim9 -/-Trim9 -/- +N
*** *** *** *** N.S. *** *** N.S. Stage 1 Stage 2 Stage 3 Stage 4 Stage 5
1DIV 1-2DIV 2-3DIV 3DIV 5DIV
A
in vitro
Trim9
+/+1 2 3 5 14
DIV
80kDa
37kDa
IB: TRIM9
IB:GAPDH
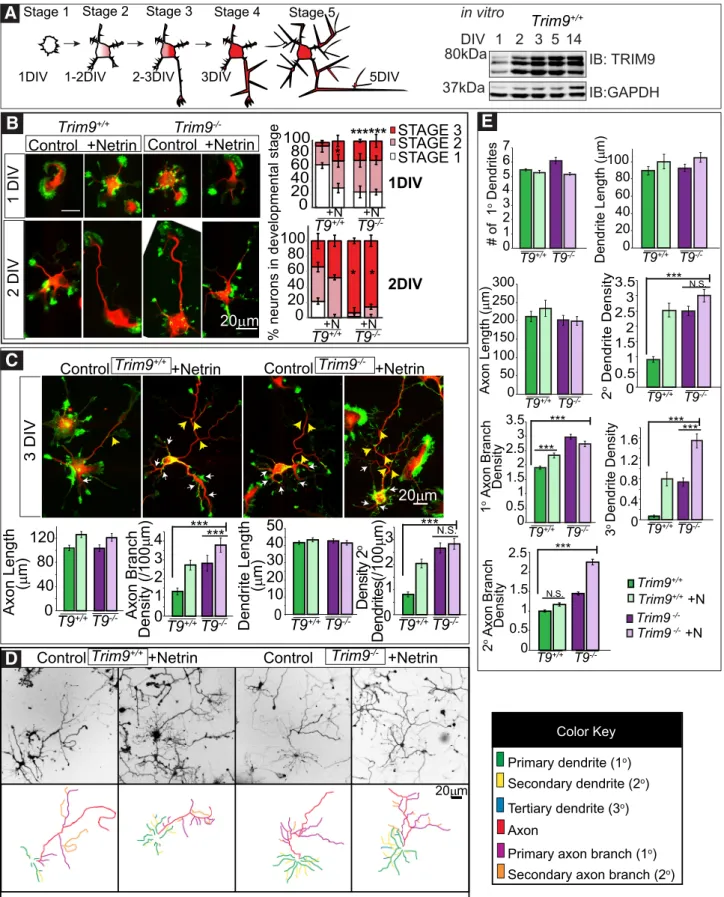
Figure 3. Deletion ofTrim9results in increased dendritic arborization and axon branchingin vitro.A, Graphical representation of neuronal stages of morphology. Stage 1 neurons lack neurites. Stage 2 neurons have 1 or more neurites. Stage 3 neurons have a presumed axon at least 2 times the length of other neurites. Axonal and dendritic branches emerge in Stage 4 and Stage 5 neurons, respectively. Western blot of TRIM9 in E15.5 hippocampal neuronsin vitroover time.B, Immunofluorescence ofTrim9⫹/⫹(T9⫹/⫹) andTrim9⫺/⫺(T9⫺/⫺) dissociated hippocampal neurons at 1 and 2 DIV and quantifications of percentage of total cells per developmental stage,⫾SEM from three independent experiments.C, Immunofluorescence ofTrim9⫹/⫹andTrim9⫺/⫺dissociated hippocampal neurons at 3 DIV and quantifications of average length (m), average number of neurites, and average branches/100m primary neurite length at 3 DIV. Red representsIII-tubulin. Green represents F-actin (phalloidin). White arrows indicate secondary dendrite branches. Yellow arrows indicate axon branches.D, Immunofluorescence and color-coded tracings ofTrim9⫹/⫹and
Trim9
+/+Trim9
-/-Myc
Myc
MycT9
Myc
Δ
RING
Myc
Δ
SPRY
Control
+Netrin
A
B
0 1 2 3 4
Trim9
-/-Trim9+/+
Myc Myc T9ΔRINGΔSPRY
Axon Branch
Density (/100
μ
m)
Density 2
o
Dendrites(
/1
0
0
μ
m)
0 1 2 3 4
***
***
***
n.s.
n.s.
n.s.
n.s.
***
***
***
0 10 20 30 40 50 60
A
v
erage Dendrite Length (
μ
m)
0 20 40 60 80 100 120 140 160
A
v
erage Axon
Length
(
μ
m)
n.s.
20
μ
m
Trim9
+/+Trim9
+/++N
Trim9
-/-Trim9
-/-+N
Trim9
-/-Trim9+/+
Myc Myc T9ΔRINGΔSPRY
Trim9
-/-Trim9+/+
Myc Myc T9ΔRINGΔSPRY
Trim9
-/-Trim9+/+
Myc Myc T9ΔRINGΔSPRY
Deletion of
Trim9
results in increased dendritic complexity in
adult-born neurons.
To determine whether the hyperarborization of dendrites seen
in
vitro
and at early postnatal time points
in vivo
occurred in
adult-born neurons, we analyzed dendritic arborization patterns of
GFP
⫹adult-born neurons at 14 DPI (
Fig. 7
). Both
Trim9
⫹/⫹and
Trim9
⫺/⫺neurons exhibited typical increases in dendritic
branching with distance from the soma (
F
(15,60)⫽
25.69,
p
⬍
0.0001, insignificant interaction with genotype); however, the
complexity was elevated in the
Trim9
⫺/⫺neurons (
F
(1,4)
⫽
12.50,
p
⫽
0.0241), with greater branch crossings in the
Trim9
⫺/⫺mice
(
Fig. 7B
). Despite increased cumulative dendritic crossings at 80
m and onward in the
Trim9
⫺/⫺group (
Fig. 7C
, asterisks), the
difference in the pattern of branching (cumulative crossings)
only approached significance (Kolmogorov–Smirnov, D
⫽
0.4375,
p
⫽
0.0935;
Fig. 7C
), indicating that
Trim9
⫹/⫹and
Trim9
⫺/⫺dendrites branched at similar points along the
den-drite. Complexity of branching was increased in the
Trim9
⫺/⫺dendrites (total number of branches,
p
⫽
0.0008; highest branch
order,
p
⫽
0.005; a trend toward an increase in secondary
branches,
p
⫽
0.0699;
Fig. 7D–F
). Similar to embryonic neurons
in vitro
, the length of the longest (primary) dendrite was not
different between genotypes (
Fig. 7G
). These results largely
reca-pitulate our
in vitro
data and indicate that TRIM9 regulates the
density and complexity of dendritic arbors in adult-born neurons
in vivo
.
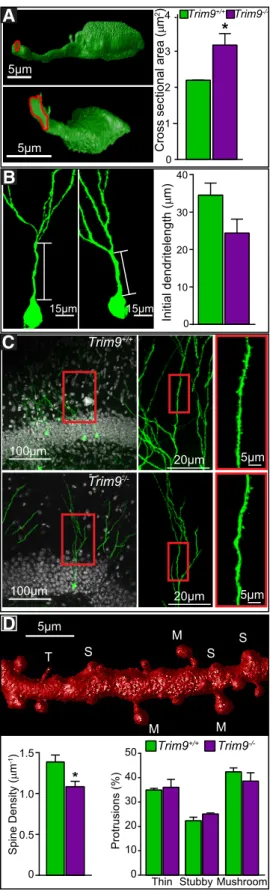
Deletion of
Trim9
results in increased thickness of the initial
dendrite and reduced dendritic spine density.
In addition to more complex dendritic trees at 14 DPI, the
diam-eter of the initial dendritic segment arising from the soma and
extending to the first branch point at 28 DPI was thicker in
Trim9
⫺/⫺mice compared with littermates (
Trim9
⫹/⫹vs
Trim9
⫺/⫺; 2.19
⫾
0.01
m
2vs 3.17
⫾
0.32
m
2;
p
⫽
0.037;
Fig.
8A
). These changes were not associated with a significantly
de-creased distance between the soma and the initial dendritic
branch point (
Fig. 8B
;
Trim9
⫹/⫹vs
Trim9
⫺/⫺; 34.55
⫾
3.19
m
vs 24.40
⫾
3.73
m,
p
⫽
0.107). To determine whether
Trim9
deletion affected dendritic spine morphogenesis, we investigated
spine architecture at 28 DPI, when synaptogenesis is occurring
(
Fig. 8C
). Analysis of 3D renderings of dendritic volumes (
Fig.
8D
) demonstrated that
Trim9
⫺/⫺neurons exhibited reduced
density of dendritic spines (
Fig. 8C
,
D
;
t
(4)⫽
2.864,
p
⫽
0.0458),
without alteration in the proportion of spine subtypes. Dendritic
spine development contributes to the initiation of the local
den-dritic spikes (
Spruston, 2008
), suggesting that the morphological
defects associated with deletion of
Trim9
may disturb synaptic
inputs to the local circuit.
Disruptions in axonal targeting of DG neurons or placement
of CA1 neurons were not detected in the absence of
Trim9
Inspection of retrovirally labeled GFP
⫹adult-born DG neurons
at 28 DPI demonstrated that their axons projected appropriately
to CA3 (
Fig. 9A
, arrowheads). Because embryonic hippocampal
neurons demonstrated excessive axon branching in the absence
of
Trim9 in vitro
(
Fig. 3
), we scored GFP
⫹axons for axonal
protrusions, which often represent axon branch precursors
(
Spillane et al., 2011
;
Winkle et al., 2014
). The densities of
pro-trusions on both
Trim9
⫹/⫹and
Trim9
⫺/⫺axons were not
nor-mally distributed, as a subset of axonal segments did not contain
such protrusions, and a subset did. As such, comparison of per
animal averages was misrepresentative. Therefore, observations
were pooled (
Fig. 9B
); compilation of data by genotype suggested
an increased density of axonal protrusions occurred in the
ab-sence of
Trim9
(
Fig. 9B
;
Trim9
⫹/⫹vs
Trim9
⫺/⫺; 0.79
⫾
0.1
pro-trusion per 100
m vs 1.19
⫾
0.1 per 100
m, Mann–Whitney
nonparametric comparison,
p
⫽
0.014).
Because both
Trim9
⫺/⫺embryonic and adult-born neurons
exhibited similar arborization defects, we hypothesized that the
somal mislocalization observed in a subset of adult-born DG
neurons may also occur in developmentally generated
Trim9
⫺/⫺hippocampal neurons. To assess whether
Trim9
deletion
pro-duced somal mislocalization outside the DG, we virally labeled
neurons in the pyramidal layer of CA1 with CaMKII-mCherry
(
Fig. 9C
) (
Wenzel et al., 2001
). The pyramidal cell layer in CA1
contains a densely packed band of principle cells generated
dur-ing development and importantly does not exhibit adult
neuro-genesis. Mislocalized mCherry
⫹CA1 pyramidal-shaped neurons
A
Dendritic Area/# Soma
50
μ
m
0
1
Trim9
+/+Trim9
-/-p<.05
1.5
2
0.5
Trim9
+/+Trim9
-/-B
Trim9
+/+Trim9
fl/fl200
μ
m
200
μ
m
Trim9
fl/flTrim9
+/+C
100
μ
m
100
μ
m
0
0.2
0.4
0.6
0.8
1
1.2
1.4
Relative Area Septal Fibers
p<.05
Trim9
+/+Trim9
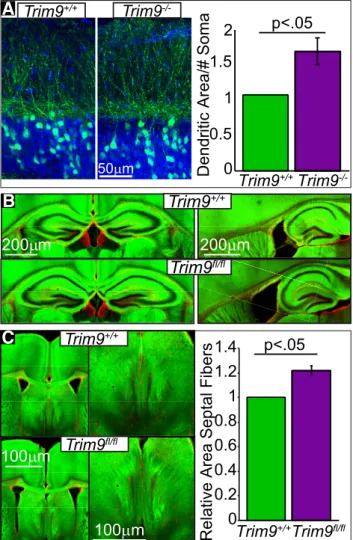
fl/flFigure 5. Deletion ofTrim9 in vivoincreases dendritic arborization and increases axonal material in the septal nuclei.A, CA3 ROIs containing the cell bodies and molecular layer extend-ing to dendritic termini from 3-week-old Thy1-GFP littermate in the hippocampus. Blue repre-sents DAPI-stained nuclei. Green reprerepre-sents Thy1-GFP-positive neurons. Quantification of GFP⫹dendritic area relative to the number of GFP⫹soma in the ROI (n⫽3 littermate pairs).