POTENTIAL IMPLICATIONS OF THE MEDICARE ADVANTAGE STARS METHODOLOGY FOR PLANS SERVING LOW SOCIOECONOMIC STATUS COMMUNITIES
Elizabeth Cahn Goodman
Adissertation submitted to the faculty at the University of North Carolina at Chapel Hill in partial fulfillment of the requirements for the degree of Doctor of Public Health in the Department of Health
Policy and Management in the Gillings School of Global Public Health.
Chapel Hill 2017
©2017
ABSTRACT
Elizabeth Cahn Goodman: The Potential Implications of the Medicare Advantage Stars Methodology for Plans Serving Low Socioeconomic Status Communities
(Under the direction of Pam Silberman)
Medicare Advantage (MA) now serves nearly one-third of all Medicare beneficiaries. Many MA participants have low socioeconomic status (SES). The Affordable Care Act (ACA) modified the five-star quality measurement program applied to MA plans (“Medicare stars”) imposing substantial financial incentives and penalties based on plan performance.
This study uses a mixed methods approach to examine (1) whether and how serving low-SES participants impact an MA plans’ ability to achieve high Medicare stars scores, (2) whether plans are
using enhanced and supplemental benefits to offset SES-related barriers to high performance under the Medicare stars program, and (3) changes policy makers should consider to offset SES-related barriers to high-quality performance under the Medicare stars program.
Thirty key informants were interviewed in phase one. Each expressed support, often qualified, for the Medicare Stars program. Each concurred that beneficiary SES factors impact the level of effort required of MA plans to achieve a high Medicare stars scores. They identified a number of specific SES factors that form barriers to high-quality performance and an array of recommended policy changes designed to acknowledge and to offset those barriers.
meals. Designation as a Special Needs Plan (SNP) was significantly associated with the inclusion of nearly all of the studied benefits.
To Adam, Alex, and Jimmy Goodman for their support, encouragement, and endless tolerance and to Alec Cunningham, who not only believed in me,
TABLE OF CONTENTS
LIST OF TABLES ... xiii
LIST OF FIGURES ... xiv
LIST OF ABBREVIATIONS ... xv
CHAPTER 1: INTRODUCTION ... 1
Section 1.1 Statement of the Issue ... 1
Section 1.2 Study Questions ... 3
Section 1.3 Study Design ... 4
CHAPTER 2: SIGNIFICANCE OF THE ISSUE ... 5
CHAPTER 3: BACKGROUND ... 7
Section 3.1 History of Managed Care in Medicare from Inception to the ACA ... 8
Section 3.2 Medicare Advantage, the ACA and Quality Measurement ... 14
Section 3.3 MA Plan Designs ... 18
Section 3.4 Demographics of Medicare Advantage ... 19
Section 3.5 Social Determinants of Health and MA ... 21
Section 3.6 Quality Measurement in Medicare Managed Care ... 22
Section 3.7 The Impact of the ACA and Subsequent Policy Making on the MA Stars Program ... 23
Section 3.8 Medicare Advantage Stars Methodology ... 26
Section 3.9 Socioeconomic Status and Other Demographic Factors and MA Stars ... 29
CHAPTER 4: PURPOSE AND AIMS ... 39
CHAPTER 5: REVIEW OF THE LITERATURE ... 40
Section 5.1 Research Question and Rationale ... 40
Section 5.2.1 Inclusion Criteria ... 42
Section 5.2.2 Exclusion Criteria ... 42
Section 5.2.3 Results ... 43
Section 5.3 Study Design ... 43
Section 5.4 Study Quality ... 45
Section 5.5 Dependent Variables ... 45
Section 5.6 Independent Variables and/or Covariates... 48
Section 5.7 Themes ... 50
Section 5.7.1 The Measure Matters ... 50
Section 5.7.2 Effect of Race, Gender, and Age on Both Process and Outcome Measures ... 53
Section 5.7.3 Educational Attainment Appears Associated with Positive Outcomes ... 54
Section 5.7.4 Lower Socioeconomic Status and Quality Performance ... 55
Section 5.8 Study Quality ... 56
Section 5.9 Issue Significance ... 56
Section 5.10 Gaps in the Current Literature ... 57
Section 5.11 Implications for Future Research ... 58
Section 5.12 Limitations of the Review Process ... 59
Section 5.13 Conclusion... 60
CHAPTER 6: RESEARCH DESIGN AND METHODOLOGY ... 61
Section 6.1 Conceptual Model ... 61
CHAPTER 7: THE RESEARCHER’S ROLE ... 64
CHAPTER 8: KEY INFORMANT INTERVIEWS IN PHASE ONE ... 67
Section 8.1 Methods ... 67
Section 8.2 Data Analysis Process ... 69
Section 8.3.1 Overview ... 70
Section 8.3.2 Use of Quality Measurement in Medicare ... 70
Section 8.3.3 Is Equivalent Care Possible? ... 71
Section 8.3.4 SES Factors that Form Barriers to Plan and Provider Performance on Quality Measures ... 71
Section 8.3.5 Impact of SES Characteristics by Type of Quality Measures ... 73
Section 8.3.6 Opinions Regarding the Current MA Stars Methodology ... 74
Section 8.3.7 Impact of MA Stars on Plan and Provider Willingness to Serve Low SES Beneficiaries/Patients ... 75
Section 8.3.8 MA Stars Methodology and Improvement of Care Quality for Individuals in All SES Strata ... 76
Section 8.3.9 Addressing SES-Factors that Create Barriers to Quality Measure Performance ... 77
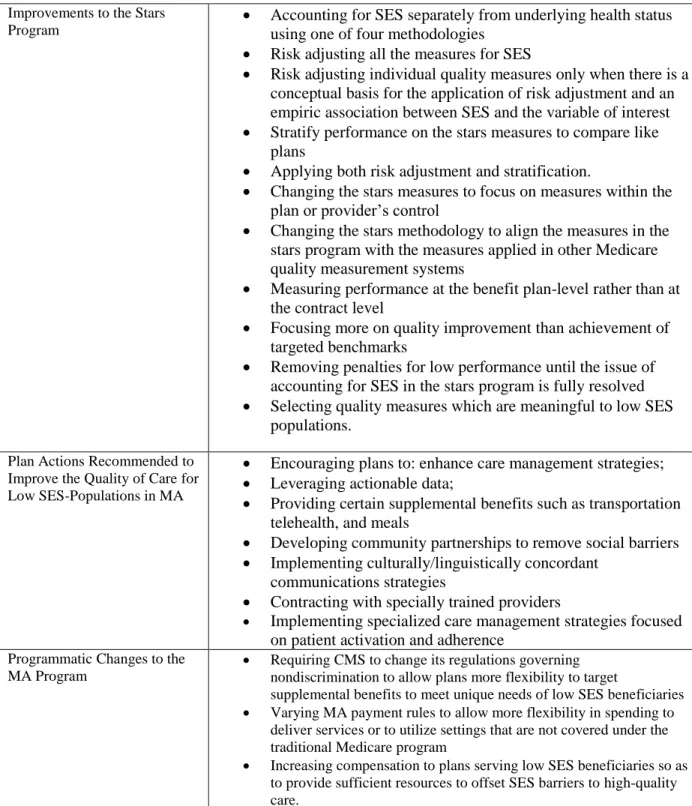
Section 8.4 Strategies Plans and Providers Could Leverage to Offset SES Barriers to Quality Care ... 78
Section 8.4.1 Refining Care Management Strategies ... 78
Section 8.4.2 Leveraging Actionable Data ... 79
Section 8.4.3 Addressing Access Barriers ... 79
Section 8.4.4 Removing Social Barriers to Care ... 80
Section 8.4.5 Provider Strategies ... 81
Section 8.5 Changes CMS Could Make to MA to Address SES-Related Barriers to Quality Care ... 81
Section 8.5.1 Accounting for SES in Quality Measurement Separately from Accounting for Underlying Health Status ... 81
Section 8.5.2 Recommended Changes to the Stars Methodology ... 84
Section 8.5.3 Changes to the MA Program Outside of the Stars Methodology ... 86
Section 8.6 Are Plans Tailoring Their Practices to Meet Beneficiary SES Needs? ... 86
Section 8.7 Summary of Findings: Recurrent Themes ... 89
Section 8.7.1 Fairness/Equity ... 91
Section 8.8 Breaking Down Silos ... 93
Section 8.9 Summary of Results by Key Informant Type ... 94
Section 8.10 Common Policy Suggestions ... 95
Section 8.11 Notable Items Not Mentioned by Key Informants ... 98
Section 8.12 Limitations ... 98
CHAPTER 9: MULTIVARIATE ANALYSIS OF PLAN BENEFIT PACKAGES ... 100
Section 9.1 Introduction ... 100
Section 9.2 Methods ... 103
Section 9.2.1 Data Analysis Process ... 103
Section 9.2.2 Dependent Variables ... 104
Section 9.2.3 Independent and Control Variables ... 105
Section 9.2.4 Special Needs Plans (SNP) ... 105
Section 9.2.5 Plan Size... 105
Section 9.2.6 Part D Low-Income Subsidy Eligible Enrollment ... 106
Section 9.2.7 Star Rating ... 106
Section 9.2.8 ADI and County Star Bonus Caps ... 107
Section 9.2.9 County Plan Enrollment Weights ... 108
Section 9.3 Analysis ... 109
Section 9.4 Results ... 111
Section 9.4.1 Multivariate Analyses ... 116
Section 9.4.2 Risk Differences ... 117
Section 9.4.3 Risk Differences of Benefit Inclusion Among All MA-PD Plans ... 119
Section 9.4.4 Risk Differences of Benefit Inclusion between SNP versus Non-SNP Plans ... 121
Section 9.4.5 Marginal Effects ... 122
Section 9.5 Discussion ... 125
Section 9.5.2 Marginal Effects of Other Policy-Relevant Independent and
Control Variables ... 126
Section 9.5.3 Overall Impact of SNP Designation ... 127
Section 9.6 Summary ... 128
Section 9.7 Limitations ... 130
CHAPTER 10: ANALYSIS OF POLICY PROPOSALS IN PHASE 3 ... 132
Section 10.1 Methods ... 132
Section 10.2 Data Analysis Strategy ... 134
Section 10.3 Proposed Changes to the Stars Measure Set ... 134
Section 10.3.1 Stratification and Risk Adjustment ... 134
Section 10.3.2 Focusing the Measure Set on Measures More Meaningful to Low SES Populations ... 136
Section 10.3.3 Plan and Provider Control ... 137
Section 10.3.4 Measuring Quality at the Level of the Plan Benefit Package (PBP) Rather than the Contract ... 137
Section 10.3.5 Improvement Rather than Achievement ... 139
Section 10.4 Changes to the Uniformity of Benefit Requirements ... 139
Section 10.5 Incentives to Improve the Quality of Care ... 141
Section 10.5.1 Incentives to Refine or Enhance Care Coordination or Care Management Techniques ... 141
Section 10.5.2 Incentives to Improve Access to Care ... 142
Section 10.5.3 Incentives to Encourage Access to Social Supports ... 143
Section 10.5.4 Incentives to Partner with Community Organizations ... 144
Section 10.5.5 Overall Evaluations of the Incentive Proposals ... 145
Section 10.6 Weighing the Options ... 145
Section 10.6.1 Limitations ... 150
CHAPTER 11: PLAN FOR CHANGE ... 151
Section 11.2 Establishing a Sense of Urgency ... 153
Section 11.3 Establishing a Guiding Coalition ... 153
Section 11.4 Developing a Vision and Strategy ... 154
Section 11.5 Communicating the Change Vision ... 156
Section 11.6 Empowering Employees to Take Broad-Based Action ... 157
Section 11.7 Generating Short Term Wins ... 158
Section 11.8 Consolidating Gains and Producing More Change ... 158
Section 11.9 Anchoring New Approaches in Culture ... 159
CHAPTER 12: IRB AND CONFIDENTIALITY ISSUES ... 160
CHAPTER 13: LIMITATIONS OF THE RESEARCH ... 161
APPENDIX A: KEY INFORMANT QUESTIONNAIRE ... 163
APPENDIX B: MAJOR CONCEPTS ... 168
APPENDIX C: MEASURES BY STUDY BY TYPE ... 172
APPENDIX D: SUMMARY OF INCLUDED ARTICLES ... 194
APPENDIX E: SES CHARACTERISTICS ACCOUNTED FOR BY HOSPITAL STUDY ... 242
APPENDIX F: SES CHARACTERISTICS ACCOUNTED FOR BY HEALTH PLAN STUDY ... 247
APPENDIX G: MEDICARE ADVANTAGE PART C AND D MEASURES 2008-2016 ... 251
APPENDIX H: AREA DEPRIVATION INDEX (HEALTH INNOVATION, 2014) ... 258
APPENDIX I: LINKS TO SOURCE DATA ... 260
APPENDIX J: COEFFICIENTS ... 261
APPENDIX K: DESCRIPTIVE STATISTICS ... 263
APPENDIX L: PHASE 2 DATA TABLES ... 267
LIST OF TABLES
Table 1. Time line: Evolution of Medicare-managed care and quality measurement in MA ... 10
Table 2. PubMed and Google Scholar literature searches ... 41
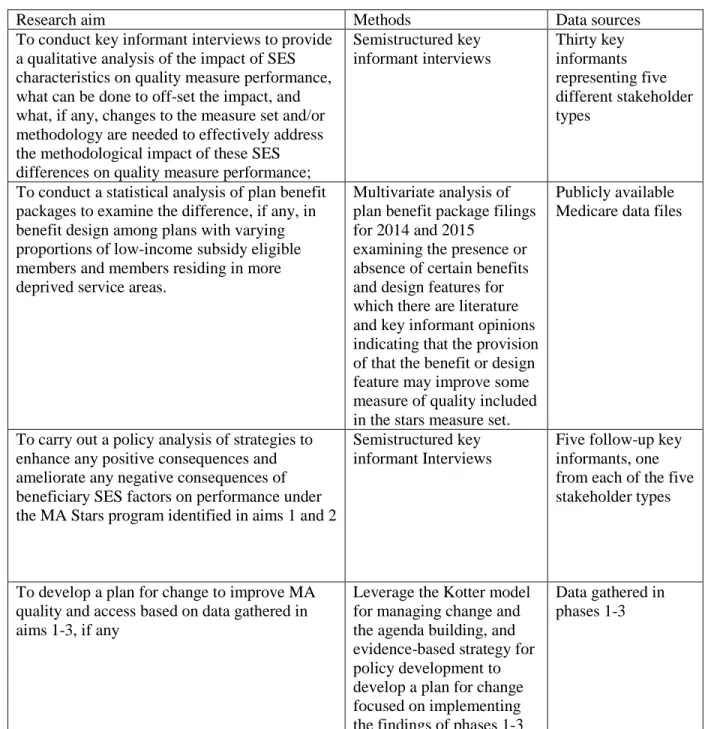
Table 3. Research aims, methods, and data sources ... 66
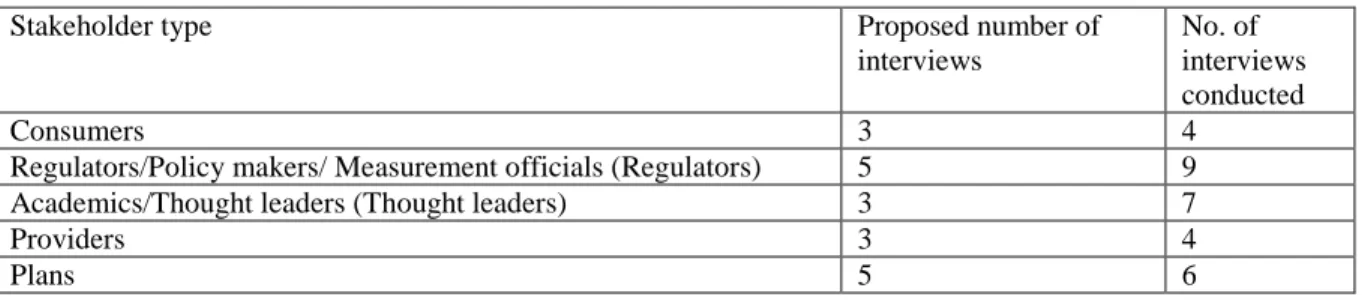
Table 4. Stakeholder types and potential sources of key informants ... 68
Table 5. Best practices in population-tailored strategies ... 88
Table 6. Common policy suggestions ... 97
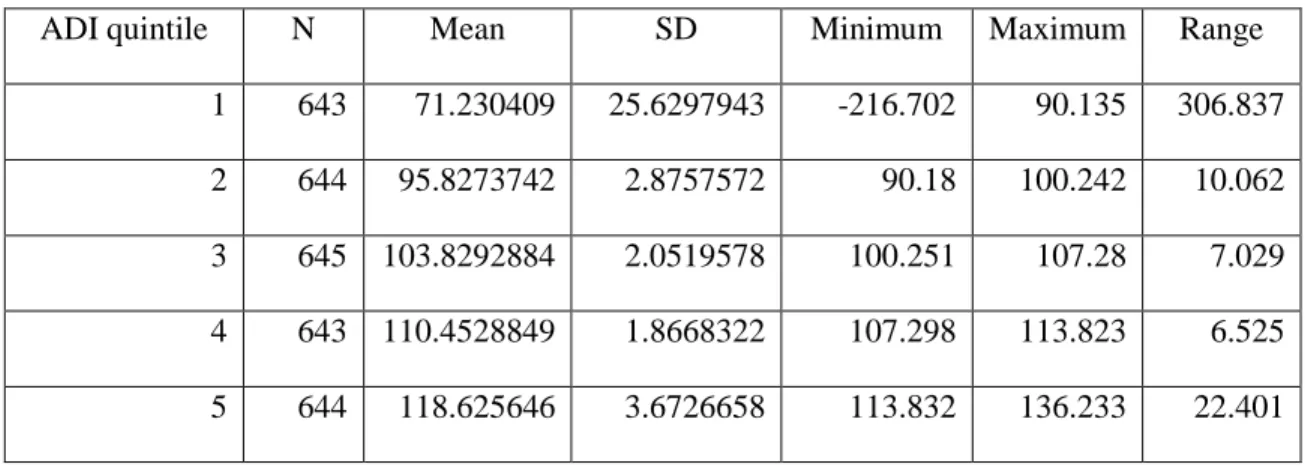
Table 7. ADI by quintile ... 108
Table 8. Plan enrollment by quintile ... 109
Table 9. Observations by plan type and monthly average enrollment ... 112
Table 10. Proportion of plan offerings including a transportation benefit ... 113
Table 11. Proportion of plan offerings requiring the payment of a premium ... 113
Table 12. Proportion of plan offerings including a telemonitoring benefit ... 114
Table 13. Proportion of plan offerings that include a meals benefit ... 114
Table 14. Proportion of plan offerings that include a nutritional benefit ... 115
Table 15. Proportion of plan offerings including an EDM benefit ... 115
Table 16. Goodness of fit scores ... 116
Table 17. Marginal effect of SNP by year ... 117
Table 18. Risk differences by ADI quintile and year ... 118
Table 19. Estimates of marginal effects ... 124
Table 20. Overall average scores ... 146
LIST OF FIGURES
Figure 1. Total MA enrollment, 1992-2026 ... 7
Figure 2. Article selection process ... 43
Figure 3. Conceptual model ... 63
Figure 4. Proposals as scored by phase 3 key informants ... 148
Figure 5. Proposals as scored by phase 3 key informants ... 149
LIST OF ABBREVIATIONS
ACA The Patient Protection and Affordable Care Act and Health-Related Portions of the Health Care and Education Reconciliation Act of 2010, otherwise referred to as the Affordable Care Act
ACO Accountable Care Organization ADI Area Deprivation Index
AHIP America’s Health Insurance Plans BCBSA Blue Cross Blue Shield Association
BIPA Benefits Improvement and Protection Act of 2000 BBA Balanced Budget Act of 1997
CAHPS Consumer Assessment of Health Care Providers and Systems CDC Centers for Disease Control
CMS Centers for Medicare and Medicaid Services COPD Chronic Obstructive Pulmonary Disease DSNP Dual Special Needs Plan
HCFA Health Care Financing Administration (predecessor agency to CMS) HEDIS Healthcare Effectiveness Data and Information Set
HHS U.S. Department of Health and Human Services HMO Health Maintenance Organization
HOS Health Outcomes Survey
HRRP Hospital Readmissions Reduction Program MA Medicare Advantage
MA-PD Medicare Advantage and Medicare Part D Health Plan MedPAC Medicare Payment Advisory Commission
MIPPA Medicare Improvements for Patients and Providers Act of 2008
MMA Medicare Prescription Drug Improvement and Modernization Act of 2003
MSA Medical Savings Account Plan
NCQA National Committee on Quality Assurance NQF National Quality Forum
PDP Part D Plans
PFFS Private Fee for Service Health Plan PPO Preferred Provider Organization PQA Pharmacy Quality Alliance RFB Religious Fraternal Benefit Plans SES Socioeconomic Status
CHAPTER 1: INTRODUCTION
Section 1.1 Statement of the Issue
As of December 2016, nearly 18.7 million Medicare beneficiaries received their health insurance benefits through the Medicare Advantage (MA) program (Medicare Advantage, Cost, PACE, Demo, and Prescription Drug Plan Contract Report - Monthly Summary Report,2016). Many of these MA enrollees possess socioeconomic characteristics (educational achievement, income, poverty, and wealth) often associated with poorer health outcomes. A higher proportion of MA participants are low income and/or members of racial and ethnic minority communities compared with participants in traditional Medicare. In 2012, 58.5% of MA participants had incomes below $29,999, as compared with 37.8% of beneficiaries in traditional Medicare, and 30% of MA participants were Hispanic or African American versus 23% of traditional Medicare participants (Americas Health Insurance Plans Center for Policy and Research, 2015).
MA serves a slightly smaller proportion of individuals who are dually eligible for Medicare and Medicaid (“dual eligibles”) than the traditional Medicare program. According to the Medicare Payment Advisory Commission (MedPAC), individuals who are dually eligible represent 16% of MA participants while they represent 19% of participants in the traditional Medicare program (Harrison & Zarabozo, 2014). However, the number of dual eligibles participating in MA is rapidly growing. Between 2009 and 2012, the number of individuals dually eligible for Medicare and Medicaid who participated in MA increased from 11% to 23% (Harrison & Zarabozo, 2014).
doing so, the ACA transformed the Medicare stars program from solely a quality measurement program to an important component of how MA plans are paid (PPACA, 2010).
The MA stars methodology grades each contract on a broad set of clinical and operational quality measures. Each measure includes specific inclusion and exclusion criteria designed to ensure that only patients who are clinically eligible for and would benefit from the measured service or procedure are included in the determination of whether a health plan delivered the appropriate care or achieved the appropriate outcome. Plan sponsors enter into contracts with the CMS. These contracts may include one or more health plans. CMS grades the performance of each MA contract on each measure by applying one of two statistical methods, clustering or relative distribution and significance testing. In this way each contract’s performance on a given measure is judged relative to all other measured contracts (Medicare 2017 Part C & D Star Rating Technical Notes, 2016). For the 2017 plan year, CMS evaluated part C plans on 32 quality measures quality and part D plans on 15 (Medicare Part C & D Star Ratings: Update for 2017: August 3, 2016 Part C & D User Group Call,2016). Plans that offer both Medicare parts C and D are evaluated based on the full set of measures.
CMS groups individual quality measures at a second level into a series of domains. Domain level scores reflect a combined measurement of similar services (Medicare 2017 Part C & D Star Rating Technical Notes, 2016) The part C domains are: staying healthy, managing chronic conditions, member experience with health plan, member complaints, and changes in the health plan’s performance and health plan customer service. The part D domains are: drug plan customer service, member complaints and changes in the drug plan’s performance, member experience with drug plan, and drug safety and accuracy
of drug pricing. Plans receive scores based on each individual measure, the domain, and the plan type (Medicare part C or part D), as well as an overall score (Medicare 2017 Part C & D Star Rating Technical Notes, 2016).
Program, 2016). Several studies have shown that health plans with high proportions of members with low socioeconomic status (SES), including members who are dually eligible for Medicare and Medicaid, tend to score lower under the MA stars methodology (Cahow, Creighton, & Richards-Burke, 2010; Inovalon, 2013, 2015, 2014b; Report to Congress: Social Risk Factors and Performance Under Medicare's Value-Based Purchasing Program, 2016; Young, Rickles, Chou, & Raver, 2014). This performance variation has caused plans and provider organizations to raise concerns about whether the stars rating and payment system, as currently implemented, fairly judges the performance of health plans serving higher
proportions of members with low SES status and led CMS in 2017 to apply an interim adjustment to plans’ star score results in order to account for performance variation on certain stars measures based on
the proportion of low income subsidy, dual eligible and disabled members served under the contract (Announcement of Calendar Year (CY) 2017 Medicare Advantage Capitation Rates and
Medicare Advantage and Part D Payment Policies and Final Call Letter, 2016). Further, this performance differential raises questions about whether the current Medicare stars rating system has inadvertently created incentives for MA plans to avoid serving low SES communities.
Section 1.2 Study Questions
A significant body of literature examines the negative impact that the social risk factors, including low SES, have on individuals’ experiences with the health care system, access to care, and
overall health outcomes (Adler & Newman, 2002; Adler & Stewart, 2006; Braveman, Egerter, & Williams, 2011; Heiman, 2015; National Academies of Sciences, 2016b; Pampel, 2010; Young, 2005). Failure to fully account for SES characteristics in measuring health plan quality could place plans that serve substantial numbers of individuals with low SES and the providers that participate in these plans’
networks at a significant financial and, to the extent that consumers rely on the Medicare stars in choosing a health plan, a significant reputational disadvantage as a consequence of the program. The purpose of this study is to more fully understand the implications of the post-ACA Medicare stars quality
post-ACA MA stars methodology had on Medicare Advantage beneficiaries in the form of changes to the products and services offered by Medicare Advantage plans serving socially and economically vulnerable Medicare beneficiaries? And, what steps can and should policy makers and organizational leaders take to offset SES-related barriers, if any, to high stars performance among plans serving high proportions of low SES members?
Section 1.3 Study Design
The study consists of three phases. Phase one is a qualitative analysis of the interviews of thirty key informants who represent six different Medicare stakeholder groups: Provider representatives; Consumer representatives; Plan representatives; Regulators, policy makers, and quality measurement officials (“Regulators”); and academics and thought leaders (“Thought leaders”). Phase two is a
quantitative analysis of MA plan benefit packages. This phase of the study evaluates the impact of the proportion of low-income plan members (those eligible for a low-income subsidy under Medicare part D) and the level of deprivation of the county in which a plan operates (as measured using the Area
CHAPTER 2: SIGNIFICANCE OF THE ISSUE
Millions of Americans rely on MA for the delivery of their health care services. Plan participation, plan financing, and, ultimately, consumer choice of plans and benefit packages are substantially impacted by performance under the post-ACA MA stars methodology. If the program improves the quality of care delivered by MA plans and reduces disparities between high and low resource communities, program enrollees could greatly benefit from these policy changes However, if, by failing to consistently account for the SES characteristics of MA plan members, the Medicare stars program creates disincentives sufficient to cause plans to avoid serving communities with SES-related risk characteristics, program enrollees could lose access to the plans and supplemental benefits on which they have come to rely.
The Medicare stars quality measurement system is one among a large and growing number of quality measurement systems currently in use in the Medicare program and elsewhere in the United States and globally to judge the quality of health care. Many of these programs use measures similar to those used in the Medicare stars program. As a result, the findings of this study can inform discussions not only about the appropriateness of including SES characteristics in the MA stars methodology but also in similar programs applied to the performance of physicians, hospitals, and other providers in the traditional Medicare program and elsewhere.
Finally, the results of this study complement ongoing work in this area by CMS and the U.S. Department of Health and Human Services Office of the Assistant Secretary for Planning and Evaluation (ASPE) (Announcement of Calendar Year (CY) 2017 Medicare Advantage Capitation Rates and
CHAPTER 3: BACKGROUND
Medicare provides preventive, acute, and post-acute health care to older and disabled Americans. Established in 1965, Medicare is among the country’s two largest social safety net programs. The use of
private health plans in Medicare has long been a matter of some controversy. Initially authorized in 1972, the program, now referred to as MA, serves more than 18.7 million beneficiaries today (Medicare Advantage, Cost, PACE, Demo, and Prescription Drug Plan Contract Report - Monthly Summary Report, 2016) and is projected to grow to 30 million by 2026 (Total Medicare Private Health Plan Enrollment, Current and Projected, 2016).
Figure 1. Total MA enrollment, 1992-2026
the traditional Medicare program because 70% of MA participants will be in plans that are eligible for quality bonuses, MA plans will be paid, on average, 102% of what it costs to serve a beneficiary in the same county under the traditional Medicare program (Commission, 2016).
The remainder of this chapter will review of the legislative history of the use of private health plans in Medicare, a history of the use of quality measurement in Medicare participating health plans, and a description of post-ACA policy activity related to the issue of including SES factors to help determine Medicare health plan performance on quality measures. Because the focus of this dissertation is solely on the impact of the post-ACA stars methodology on the delivery of quality care to low SES populations, this section is not intended to provide a full social and political history of the use of private health plans in the Medicare program.
Section 3.1 History of Managed Care in Medicare from Inception to the ACA
The Medicare program was established in 1965 (The Social Security Amendments of 1965, 1965) to provide health insurance coverage to elderly (ages 65 and up) beneficiaries of Social Security. Later, in 1972, the Social Security Act was amended to expand Medicare coverage to individuals with disabilities and end-stage renal disease. The Social Security Act also was amended that year to enable Medicare to contract with managed care plans. (McDowell, 2009) In 1982, Congress passed the Tax Equity and Fiscal Responsibility Act (TEFRA), which authorized Medicare to contract with health maintenance
organizations (HMOs) at 95% of the average cost of serving a Medicare beneficiary in the traditional Medicare program in the county in which the plan was offered (McDowell, 2009; Medicare Advantage Fact Sheet, 2014). In 1995, Republican majorities in Congress attempted to wring substantial savings from the Medicare program, including efforts to impose spending caps on Medicare and to broadly expand private Medicare plans. This effort was ultimately vetoed by President Bill Clinton (Oberlander, 2003).
passed the Balanced Budget Act (BBA) (Oberlander, 2003; McDowell, 2009; Scanlon, 1999). The BBA created the Medicare+Choice program. Beginning in 1999, as a result of the BBA, Medicare began contracting with preferred provider organizations (PPOs), private fee-for-service plans (PFFSs), and Medical Savings Account Plans (MSAs) (Christensen, 1997; Payments to Medicare+Choice
Organizations, 2010). In addition, the BBA reduced plan cost growth; established a per county payment floor to attract plans to underserved, especially rural counties; and enhanced the risk adjustment program used to reflect the health of the beneficiaries participating in each Medicare health plan. (Scanlon, 1999). The Benefits Improvement and Protection Act (BIPA) of 2000 expanded these payment floors to
additional areas (Medicare Advantage Fact Sheet, 2014).
The Medicare Prescription Drug, Improvement, and Modernization Act of 2003 (MMA) renamed Medicare+Choice Medicare Advantage and established the Medicare drug benefit (Medicare part D). MMA authorized three types of Medicare health plans: those that offered only drug benefits (part D plans), those that offered only the services covered in Medicare parts A and B (MA plans), and those that offered both the services covered in Medicare parts A and B and drug benefits (MA-PD plans) (CMS, 2011; The Medicare Prescription Drug, Improvement and Modernization Act of 2003, 2003).
In response to concerns that MA plans were gaming the risk adjustment system. the Deficit Reduction Act of 2005 required CMS to make an across-the-board adjustment to the MA plan risk scores to make them more consistent with FFS coding (The Medicare Advantage Program: Status Report, 2016).
(CMS, 2011). This model adjusts plan payments to reflect beneficiary health conditions, eligibility for Medicaid, residence in an institution and disability as a reason to Medicare entitlement but does not account for other SES-related characteristics, for example educational attainment or residency in a high poverty or high crime area.
The Medicare Improvements for Patients and Providers Act of 2008 (MIPPA) changed the benchmark setting process to remove the cost of medical education from the calculation of MA benchmarks and made other changes to the program, including changes designed to increase the coordination of Medicare and Medicaid benefits and slow the growth of certain types of MA plans (McDowell, 2009; Medicare Advantage Fact Sheet, 2014; Medicare Improvements for Patients and Providers Act of 2008, 2008).
Table 1. Time line: Evolution of Medicare-managed care and quality measurement in MA Month Year Action
July 1965 The Medicare program is established to provide health insurance coverage to elderly (ages 65 or up) beneficiaries of Social Security ( Social Security Act: Title XVIII-Health insurance for the aged and disabled, 1965).
October 1972 The Social Security Act is amended to enable Medicare to contract with health maintenance organizations (Social Security Act: Title XVIII-Health insurance for the aged and disabled, 1965).
October 1972 The Social Security Act is amended to cover individuals with disabilities and end-stage renal disease in Medicare (Social Security Act: Title XVIII-Health insurance for the aged and disabled, 1965).
1982 Medicare initiates quality improvement activities in Medicare health plans (McIntyre, Rogers, & Heier, 2001).
September 1982 Tax Equity and Fiscal Responsibility Act (TEFRA) authorizes Medicare to contract with health maintenance organizations (HMOs) at 95% of the average cost of serving a Medicare beneficiary in the relevant county (Medicare Advantage Fact Sheet, 2014).
December 1995 Republicans in Congress attempt to wring substantial savings from the Medicare program, including efforts to impose spending caps on Medicare and to broadly expand private Medicare plans. The effort is vetoed by President Bill Clinton (Oberlander, 2003).
1996 CAHPS is implemented in Medicare+Choice (McIntyre et al., 2001).
1996 Medicare+Choice plans begin submitting HEDIS data ( Emergency Clearance: Public Information Collection Requirements, 1996).
August 1997 The Balanced Budget Act (BBA) passes, thereby creating the Medicare+Choice program (The Balanced Budget Act, 1997).
Month Year Action
1999 Authorized under the BBA, Medicare begins contracting with preferred provider organizations (PPOs), private fee-for-service plans (PFFSs), and Medical Savings Account Plans (MSAs) (Christensen, 1997; Payments to
Medicare+Choice Organizations, 2010).
December 2000 The Benefits Improvement and Protection Act (BIPA) is expanded to floors on payments to Medicare+Choice plans (Medicare Advantage Fact Sheet, 2014). December 2003 The Medicare Prescription Drug, Improvement, and Modernization Act (MMA)
is renamed Medicare+Choice Medicare Advantage; the Medicare drug benefit (Medicare part D) is established (CMS, 2011; The Medicare Prescription Drug, Improvement and Modernization Act of 2003, 2003).
2006 Medicare institutes a bidding process based on the average cost of delivering the services covered under Medicare parts A and B and, in the case of MA-PD plans, Medicare part D (Medicare Advantage Fact Sheet, 2014).
2007 CMS begins grading Medicare part D plans using a star rating system (Medicare Part D Performance Metrics Technical Notes November 9, 2006, 2006;
Pharmacy, 2014; Statement by Kerry Weems Acting Administrator CMS Centers for Medicare & Medicaid Services on Medicare Advantage Increased Spending Relative to Medicare Fee-for-Service, 2008).
March 2007 Sen. Max Baucus (D-MT) announces a broad outline for health care reform (Health Care Reform from Conception to Final Passage, 2010).
2008 CMS commences grading MA and MA-PD plans by using a 1- to 5-star rating system (Medicare Health Plan Quality and Performance Ratings Technical Notes 11/01/2007, 2007).
June 2008 Medicare Improvements for Patients and Providers Act (MIPPA) changes the benchmark setting process, increases the coordination of Medicare and
Medicaid benefits, and slows the growth of certain types of MA plans (Medicare Improvements for Patients and Providers Act of 2008, 2008).
October 2009 Senate considers House Resolution 3590 (HR 3590), the Service Members Home Ownership Tax Act by Representative Charles Rangel (D-NY), which had passed the House (Service Members Home Ownership Tax Act of 2009, 2009).
October 2009 Senate Bill 1796 (“S 1796”), America’s Healthy Future Act, is approved by the Senate Finance Committee (America's Healthy Future Act, 2009).
October 2009 The Preservation of Access to Care for Medicare Beneficiaries and Pension Relief Act of 2010, House Resolution 3962 (HR 3962), is introduced to the House of Representatives (Preservation of Access to Care for Medicare Beneficiaries and Pension Relief Act of 2010, 2010).
March 2010 The House of Representatives concurs in the Senate amendments to HR 3590 and, along with it, passes the Health Care and Education Reconciliation Act, House Resolution 4872 (HR 4872) (Health Care and Education Reconciliation Act of 2010, 2010).
March 2010 The Patient Protection and Affordable Care Act is presented to and signed by President Obama on March 23, 2010 (The Affordable Care Act, 2010). 2011 CMS requires MA and part D contracts with more than 600 members to
administer a plan-specific CAHPS survey (Quality).
Month Year Action
2013 Health Outcomes Survey (HOS) (v.2.5) is implemented (Health Services Advisory Group, 2014).
March 2014 An expert panel appointed by the National Quality Forum (NQF) issues a draft report in which they recommend that certain quality measures be risk adjusted to account for sociodemographic differences, in addition to differences based on health status (National Quality Forum, 2014b).
August 2014 NQF Board of Directors ratify a trial to assess the impact of risk adjusting certain measures for sociodemographic factors (National Quality Forum, 2014c).
September 2014 CMS uses their regulatory discretion not to terminate plans that score fewer than three Medicare stars for three consecutive years and issues a request for
information regarding differences in star rating performance among plans serving individuals who are dually eligible for Medicare and Medicaid and those who are only eligible for Medicare (Centers for Medicare and Medicaid
Services, 2014f).
September 2014 NQF Consensus Standard Approval Committee adopts parameters for the SES adjustment trial (National Quality, 2014d).
October 2014 The Improving Medicare Post-Acute Care Transformation Act of 2014 (“the IMPACT Act”) becomes law, thereby requiring the Secretary to conduct a study that examines the effect of individuals’ SES on quality measures, resource use, and other measures for individuals under Medicare (Improving Medicare Post-Acute Care Transformation Act of 2014, 2014).
November 2014 CMS closes the opportunity to reply to a request for information regarding differences in star rating performance among plans serving individuals who are dually eligible for Medicare and Medicaid and those who are only eligible for Medicare (Sanders, 2014).
December 2014 The Quality Bonus Demonstration program ends (Cosgrove, 2012).
February 2015 CMS issues the Advance Notice of Methodological Changes for Calendar Year (CY) 2016 for Medicare Advantage (MA) Capitation Rates, part C and part D Payment Policies and 2016 Call Letter (“The Advance Notice”) and proposes a change (reduce the weight of seven targeted measures by 50%) to the stars methodology for all plans regardless of the proportion of LIS/dual membership (Advance Notice of Methodological Changes for Calendar Year (CY) 2016 for Medicare Advantage (MA) Capitation Rates, Part C and Part D Payment Policies and 2016 Call Letter, 2015).
March 2015 HHS issues a notice of intent to award a single source contract to the National Academy of Science Institute of Medicine (now the National Academy of Medicine (NAM)/National Research Council to conduct the IMPACT Act study (Accounting for Socioeconomic Status in Medicare Payment Program, 2015). April 2015 NAM convenes an ad hoc committee to provide a definition of SES for the
Month Year Action
April 2015 CMS issues the Announcement of Calendar Year (CY) 2016 Medicare Advantage Capitation Rates and Medicare Advantage and part D Payment Policies and Final Call Letter. They reverse course and confirm their intent to terminate any remaining contracts that score fewer than three stars for three years in either Medicare part C or part D (Announcement of Calendar Year (CY) 2016 for Medicare Advantage (MA) Capitation Rates and Medicare Advantage and Part D Payment Policies and Final Call Letter, 2015). April 2015 A memorandum is issued by the NQF staff outlining the process for the SES
adjustment trial period, a time line for further activity, and evaluation criteria ( Burstin, Amin, & Isijola, 2015).
September 2015 CMS releases technical notes of RAND Corporation study of the effect of low-income and disability status on MA plan performance on 16 clinical quality measures finding that socioeconomic status does not show significant
independent effect on quality scoring when LIS/disability is taken into account (Centers for Medicare and Medicaid Services, 2015a, 2015b).
September 2015 MedPAC presents findings of an analysis of variation in quality measures across plans by plan population mix discussing alternative methodologies and
justifications for calculating star rating bonus payments (Zarabozo, 2015). November 2015 CMS releases a request for comments on the proposed 2017 stars methodology,
including two proposed interim adjustment methodologies: application of a categorical adjustment index (CAI) and the use of indirect standardization (IS) (Larrick, 2015).
February 2016 CMS proposes moving forward with the application of a categorical adjustment index (CAI) approach, beginning with the 2017 Star Ratings (Advance Notice of Methodological Changes for Calendar Year (CY) 2017 for Medicare Advantage (MA) Capitation Rates, Part C and Part D Payment Policies and 2017 Call Letter, 2016).
April 2016 CMS finalizes the application of the CAI for 2017 in the final call letter (Announcement of Calendar Year (CY) 2017 Medicare Advantage Capitation Rates and Medicare Advantage and Part D Payment Policies and Final Call Letter, 2016).
October 2016 CMS releases the 2017 star results and are the first to include the CAI calculation. Based on those results, approximately 49% of all MA-PD plans, nearly 68% of enrollment weighted plan membership received four or more stars, and over 90% of MA-PD enrollees are in contracts with ratings of 3.5 or more stars. 23 contracts: 14 MA-PD, 3 MA-only, and 6 PDP received five stars (2017 Star Ratings, 2016).
December 2016 On December 13, 2016 President Barack Obama signed HR 34, the 21st Century Cures Act (21st Century Cures Act, 2016). HR 34 delayed termination of persistently low-performing MA plans pending the results of the IMPACT Act studies.
Month Year Action
2016-2017
The NAM releases five reports on Accounting for Social Risk Factors in Medicare Payment defining social risk factors, examining best practices in serving populations with social risk factors, defining criteria, factors and methods to account for social risk factors in Medicare payment, identifying current and potential data sources that could be used to account for social risk factors in Medicare payment and making recommendations based on those analyses (Board on Population Health and Public Health Practice; Board on Health Care Services; Health and Medicine Division, 2017; National Academies of Sciences, Engineering and Medicine, 2017; National Academies of Sciences, Engineering, and Medicine 2016a, 2016b, 2016c, 2016d).
Section 3.2 Medicare Advantage, the ACA and Quality Measurement
By 2009 when Congress began debating the law that became the ACA, MA plans were paid, on average, 15% to 30% more than the cost of serving a patient in the traditional Medicare program (Altman, 2011). This payment differential was due to a variety of factors related to the bidding methodology described in the previous section and was substantially increased as a result of the previously described benchmark increases which were a part of the 2003 MMA (Altman, 2011). In addition to this payment differential, MedPAC and others expressed concerns regarding the uneven quality of care delivered by the various MA plans and the variability of available supplemental benefits (Gold, 2008; The Medicare Advantage Program in 2014). In crafting the ACA, Congress sought to address both these quality and cost concerns (Service Members Home Ownership Tax Act of 2009, 2009).
to make monthly payments of 2% of the national monthly per capita cost for expenditures for individuals enrolled in traditional Medicare to MA plans that achieve, at least, a three-star rating and 4% to plans that achieve a four- or five-star rating. In addition, in situations in which an MA plan did not achieve three stars but CMS deemed the plan to be an improved quality plan, S1976 would have required CMS to make monthly bonus payments of 1%. S 1796 required the five-star rating system to measure clinical quality, enrollee satisfaction, and performance. In addition, it required the Secretary to risk adjust the distribution of performance bonuses under this program using the same risk-adjustment program utilized in rate setting (America's Healthy Future Act, 2009).
The Preservation of Access to Care for Medicare Beneficiaries and Pension Relief Act of 2010, House Resolution 3962 (HR 3962), was introduced by Rep. John Dingell (D-MI), Chairman of the Committee on Energy and Commerce, on October 29, 2009 (Thomas.gov, 2010). The act was renamed the Affordable Health Care for America Act, and it passed the House of Representatives on November 7, 2009 (Thomas.gov, 2010). HR 3962 created a quality-based payment adjustment applicable to MA plans. Under this legislation, the benchmarks against which plans bid would have been raised by 5% over a period of 3 years based on the plan’s quality performance. HR 3962 included explicit instruction to CMS
regarding how to measure quality performance. It required the Secretary to initially assess quality based on a blend of performance on the Healthcare Effectiveness Data and Information Set (HEDIS), Consumer Assessment of Healthcare Providers and Systems (CAHPS), and other measures of clinical quality as specified by the Secretary. In addition, it required CMS to include measures that reflect the outcomes of care. Those outcome measures were required, over time, to make up the preponderance of the measures. HR 3962 allowed the Secretary to risk adjust the measures as the Secretary deemed appropriate.
Act. The amendment retained the quality bonus and risk-adjustment language included in the Healthy Future Act (S1796) (Congressional Record, 2009).
During the course of debate on the amendment, Sen. Ron Wyden (D-OR) described the quality provisions contained in the amendment as follows:
I had an opportunity to work closely with Chairman Baucus in terms of addressing Medicare Advantage, and I think that with the chairman’s leadership, it has been possible to show you can find savings in the Medicare Program without harming older people, without reducing their guaranteed benefits, their essential benefits, as we have learned, with Medicare Advantage [. . .]. The way we have been able to do that is essentially through a two-part strategy: first, encourage competitive bidding and, second, provide incentives for quality, which is done through the bonus payment provisions that are in the legislation. First, on competitive bidding, you have plan bids, and you use the plan bids to set Medicare Advantage benchmarks which would encourage the plans to compete more directly on the basis of price and quality rather than on the level of extra benefits offered to those who are enrolling. With the competitive bidding, plans compete to be the most efficient and hold down costs [. . .]. In addition, in the Finance Committee I offered an amendment with several colleagues that would boost the payments to those plans that, according to the government—and the government uses a system of stars, in effect, to reward quality—our amendment would boost the payments to those Medicare Advantage plans with four- and five-star quality ratings. So, in effect, with our legislation there are both carrots and sticks.
Competitive bidding plus bonus payments offers both, so the plans compete to provide the best value for seniors. (Service Members Home Ownership Tax Act of 2009, 2009)
On March 21, 2010, the House of Representatives concurred in the Senate amendments to HR 3590 and, along with it, passed the Health Care and Education Reconciliation Act, House Resolution 4872 (HR 4872). HR 4872 revised the benchmark and quality measurement programs, removing bonus payments for three star and improving plans, removing risk adjustment from the quality measurement methodology, and including performance on the stars quality measurement methodology in the
calculation of benchmarks and rebates (Health Care and Education Affordability Reconciliation Act of 2010, 2010).
On March 24, 2010, in debate on HR 4872, Republican members of the Senate opposed the revisions as further cuts to the MA program, while Democratic Senators supported the changes as furthering efforts to improve quality. Senator Baucus, author of the America’s Healthy Future Act, defended the revised provisions, stating, “[. . .] it is important to remember that health care reform will
rankings . . . will receive an increase in payments. That is very important because, today, Medicare Advantage plans are paid the same amount regardless of the quality of care they provide. For the first time, under this legislation, payments to plans would be based on performance. I think that is something all seniors would prefer” (Consideration of the Health Care and Education Reconciliation Act of 2010,
2010). Both bills, now known in combination as the Affordable Care Act (ACA), were presented to and signed by President Barack Obama on March 23, 2010 (Thomas.gov, 2010).
As enacted, the ACA imposed an array of reductions in MA spending (Altman, 2011; Commission, 2011), including a phased-in reduction to the benchmarks against which plans bid, and reductions in payments to account for identified patterns of differential assessment of patient health risk between MA and traditional Medicare otherwise referred to as coding intensity adjustments (The Affordable Care Act, 2010). The benchmark reductions were complete effective January 1, 2017. As a result, each county is now categorized into one of four quartiles, which range from 95% to 115% of spending in the traditional Medicare program in that county (The Affordable Care Act, 2010). In addition, each plan’s benchmark and rebate amount, as well as access to bonus payments, are now contingent on
quality performance (The Affordable Care Act, 2010). Despite the inclusion of risk adjustment in several earlier drafts of the legislation the ACA does not address the issue of risk adjustment of the Medicare stars program. As a result of this combination of policy changes, the ACA creates significant financial risk for plans unable to achieve quality bonus eligibility.
On October 6, 2014, President Barak Obama signed the Improving Medicare Post-Acute Care Transformation Act of 2014 (the IMPACT Act) (Improving Medicare Post-Acute Care Transformation Act of 2014, 2014). This legislation requires the Secretary to conduct a series of studies that examine the effect of individual SES on quality measures, resource use and other measures under Medicare
(Improving Medicare Post-Acute Care Transformation Act of 2014, 2014).
IMPACT Act studies and recommendations. Specifically, it states that it is the intent of Congress to continue to study and request input on the effects of socioeconomic status and dual-eligible populations on the Medicare Advantage STARS rating system. Pending the results of those studies and stakeholder input, Section 1857(h) of the Social Security Act (42 U.S.C. 1395w–27(h)) is amended to require that “…through the end of plan year 2018, the Secretary may not terminate a contract under this section with
respect to the offering of an MA plan by a Medicare Advantage organization solely because the MA plan has failed to achieve a minimum quality rating under the five-star rating system under section 1853(o)(4)” (21st Century Cures Act, 2016).
On December 21, 2016, ASPE released the first of the IMPACT Act required reports concluding that “Dually-enrolled beneficiaries, beneficiaries living in low-income neighborhoods, Black
beneficiaries, rural beneficiaries and beneficiaries with disabilities experienced worse outcomes compared with other beneficiaries on many to most of the quality metrics included in the Medicare Advantage Quality Star Rating program” (Report to Congress: Social Risk Factors and Performance Under
Medicare's Value-Based Purchasing Programs, 2016). In this report ASPE simulated a series of policy options and offered several recommendations for revising the Medicare Stars program to address the impact of social risk factors on plan performance under the Medicare Stars program (Report to Congress: Social Risk Factors and Performance Under Medicare's Value-Based Purchasing Programs, 2016).
Section 3.3 MA Plan Designs
MA plans can be delivered through health maintenance organizations (HMOs), local or regional preferred provider organizations (PPOs), Medicare medical savings account (MSA) plans, special needs plans (SNPs), private fee-for-service (PFFS) plans, or religious fraternal benefit (RFB) plans. Within each MA plan, enrollees may obtain care from a network of doctors, hospitals, and other health care providers. In addition, some types of MA plans offer care coordination services, such as case and disease
example, in 2015, CMS established the maximum deductible (the amount a beneficiary must pay before insurance coverage begins) for the drug benefit under Medicare part D at $320. In addition, total cost sharing for parts A and B services may not exceed cost sharing for those services in the traditional Medicare program on an actuarially equivalent basis (Announcement of Calendar Year (CY) 2016 for Medicare Advantage (MA) Capitation Rates and Medicare Advantage and Part D Payment Policies and
Final Call Letter, 2015). This means that they must provide the same general level of financial protection to plan beneficiaries.
In designing the individual plan benefit packages, MA plans may require beneficiaries to pay a monthly premium, a deductible, or a portion of the cost of each service or prescription in the form of coinsurance or copayments. MA plans also typically offer additional supplemental benefits, such as dental care, vision care, or over-the-counter drugs, not available in traditional Medicare. MA plans also often have lower out-of-pocket costs compared with traditional Medicare, thereby reducing or eliminating the need for beneficiaries to purchase supplemental insurance.
Each MA plan must apply to CMS for approval to serve a designated service area. The service area is a geographic region made up of a county, multiple counties, or, in the case of a regional plan, a region designated by CMS. When approved to serve a service area, the plan must be made available to all eligible Medicare beneficiaries residing in the service area. CMS may approve a plan to serve less that an entire county within in a service area.
Section 3.4 Demographics of Medicare Advantage
participants (Harrison & Zarabozo, 2014). This is 3% less than the share of the traditional Medicare program represented by individuals who are dually eligible (19%) (Harrison & Zarabozo, 2014).
While new Medicare enrollees were more likely to enroll in Medicare Advantage than traditional Medicare, in the years 2006-2011, dual eligibles were less likely than other Medicare beneficiaries to choose MA (Jacobson, Neuman, & Damico, 2015). However, MedPAC has found that partial dual eligibles (individuals eligible for Medicaid-funded assistance, but not full Medicaid benefits) are more likely than full dual eligibles (those entitled to full Medicaid benefits) to enroll in MA (Harrison & Zarabozo, 2014). Recent changes in policy related to dual eligibles including an ongoing federal/state demonstration program designed to enroll individuals into fully integrated MA programs (Centers for Medicare and Medicaid Services, 2014g) and state efforts to align Medicaid managed care contracts with available Duals Special Needs Plans (DSNPs) (Philip, Archibald, & Sope, 2016) likely account for a substantial proportion of the growth in enrollment of dually eligible beneficiaries in MA.
Many MA beneficiaries have low incomes. In 2012, 10.8% of MA beneficiaries had incomes less than $10,000, as compared with 12.5% of beneficiaries in traditional Medicare. Twenty-six percent of MA beneficiaries had incomes between $10,000 and $19,999, as compared to 21.1% of beneficiaries in traditional Medicare, and 21.7% of MA beneficiaries had incomes between $20,000 and $29,999, as compared with 16.7% of beneficiaries in traditional Medicare (Americas Health Insurance Plans Center for Policy and Research, 2015).
MA plans serve a higher proportion of individuals who are Hispanic and African American than the traditional Medicare program (30% in MA versus 23% in traditional Medicare). In 2012, the most recent year for which data are available, Hispanic noninstitutionalized Medicare beneficiaries represented 9.8% of all Medicare beneficiaries. However, while Hispanic noninstitutionalized beneficiaries
57% of dual eligibles participating in MA were members of racial or ethnic minorities (Americas Health Insurance Plans Center for Policy and Research, 2015), while 47% of duals served by traditional
Medicare were racial or ethnic minorities (Americas Health Insurance Plans Center for Policy and Research, 2015).
Section 3.5 Social Determinants of Health and MA
The Centers for Disease Control (CDC) defines the social determinants of health as the “. . .
circumstances in which people are born, grow up, live, work, and age, as well as the systems put in place to deal with illness. These circumstances are in turn shaped by a wider set of forces: economics, social policies, and politics” (Centers for Disease Control, 2014). Examples of social determinants include
access to educational, economic, and job opportunities; disparities in access to health care services; and racism, socioeconomic conditions, language, literacy, and culture (U. S. Department of Health and Human Services, 2014). Based on a meta-analysis of nearly 50 studies, researchers estimated that social factors, including education, racial segregation, social supports, and poverty accounted for over a third of total deaths in the United States in a year” (Heiman, 2015).
The sources of disparities in health care are many and varied. They include both SES factors, such as income and education; other factors, such as the conditions of the community in which the patient resides, access to food and recreational facilities, proximity to environmental hazards, chronic stress, receipt of lower-quality care, more difficulty accessing care, difficulty navigating the health care system, provider ignorance or bias, providerdifficulty communicating with patients, providers lacking sufficient time to spend with patients, and patient nonadherence to recommended treatment (Bahls, 2011).
those that support changes in individual behavior, we can improve health for large numbers of people in ways that can be sustained over time. Improving the conditions in which we live, learn, work, and play and the quality of our relationships will create a healthier population, society, and workforce” (Centers for Disease, 2014). Given the demographics of MA, many MA enrollees have socioeconomic and
demographic characteristics, such as high poverty, low educational attainment, poor neighborhood conditions, and exposure to racism that directly or indirectly can act as social determinants, contributing to poorer health outcomes (Braveman et al., 2011).
Section 3.6 Quality Measurement in Medicare Managed Care
The current MA stars program is used both to assist Medicare beneficiaries in selecting a plan and as a mechanism for regulators to determine benchmarks, rebates, and quality bonuses paid to the plans. The MA stars measure set rates plans based on process of care, patient outcome, experience of care, and access to care measures (Medicare 2017 Part C & D Star Rating Technical Notes, 2016). However, quality measurement in Medicare is not new. Medicare health plans have been participating in quality improvement activities since 1982 (D. McIntyre, Rogers, L., Heier, E.J., 2001). Medicare+Choice plans began submitting HEDIS data in 1996 ( Emergency Clearance: Public Information Collection
Requirements, 1996). They began participating in CAHPS in 1996 and in the Medicare Health Outcomes Survey (HOS) in 1998 ( McIntyre, Rogers, & Heier, 2001).
Medicare drug plans (part D plans) have been subject to quality measurement since their inception (American Pharmacists Association and Academy of Managed Care Pharmacy, 2014). The MMA created the Medicare prescription drug benefit (part D) and required the Secretary to provide consumers with comparative information, including comparisons of quality and performance and the results of consumer satisfaction surveys (The Medicare Prescription Drug, Improvement and
Drug, Improvement and Modernization Act of 2003, 2003). Medicare initially graded part D plans using a scale of one to three stars. (Pharmacy, 2014) Medicare has been rating the quality of part D plan using a system of one to five stars since 2007 (Medicare Part D Performance Metrics Technical Notes November 9, 2006, 2006; Pharmacy, 2014; Statement by Kerry Weems Acting Administrator CMS Centers for Medicare & Medicaid Services on Medicare Advantage Increased Spending Relative to Medicare
Fee-for-Service, 2008) and MA and MA-PD plans since 2008 (Medicare Health Plan Quality and
Performance Ratings Technical Notes 11/01/2007,2007). The Medicare stars measurement program in its current form began in 2008.
Section 3.7 The Impact of the ACA and Subsequent Policy Making on the MA Stars Program
As discussed, according to CMS, prior to the passage of the ACA, MA plans were paid on average 114% of the cost of serving the same beneficiary in the traditional Medicare program
(Cavanaugh, 2016). This inequity which had been a concern of liberals throughout the life of the MA program was substantially exacerbated as a result of the MMA which raised the benchmarks in counties with low costs in the traditional Medicare program (Altman, 2011). As discussed, the ACA sought to address this payment inequity and to address concerns regarding uneven plan quality, and positive risk selection by among plans (Commission, 2009; Nicholas, 2009). To do so, the ACA modified Section 1853 of the Social Security Act (Payments to Medicare+Choice Organizations, 2010), changing the methodology used to pay MA plans and placing a substantial portion of plan compensation at risk based on plan performance under MA stars quality rating system. In 2016 MedPAC estimated that, the
Under Section 3202 of the ACA, “. . . quality rating for a plan shall be determined according to a
five-star rating system . . . .” (The Affordable Care Act, 2010). Plans that score 3.5 or more Medicare stars receive a higher premium amount. This percentage increase in premium grows as performance under the five-star system increases (3.5, 4, 4.5, and 5). The law also allows plans to “earn” as much as a 5% bonus for achieving five Medicare stars. This bonus revenue must be used for providing extra benefits or lowering premiums for enrollees. Moreover, CMS has the authority to terminate plans that fail to achieve three Medicare stars for three consecutive years (Termination of Contract by CMS, 2005), a provision temporarily suspended by Congress in December 2016 under the 21st Century Cures Act (21st Century Cures Act, 2016).
Under the law, in calendar year 2012, plans achieving four or more stars were eligible to receive a 1.5% bonus in 2012, a 3% bonus in 2013, and a 5% bonus in 2014 and subsequent years. To allow plans time to improve their quality scores prior to the imposition of the full bonus program, CMS created a transitional financing program called the Quality Bonus Demonstration program (Centers for Medicare Medicaid Services, 2010). Under this program, plans that achieved three or more Medicare stars received bonus payments. The quality bonus demonstration program ended on December 31, 2014. As a
consequence, results for the 2015 plan year (based on 2014 performance) were the first under the full force of the ACA provisions. As a consequence, the quantitative analysis included as phase 2 this study focuses on changes, if any, made between 2014 and 2015 on plan service areas and product filings.
In addition to the changes related to the MA stars program, the ACA sought to align MA and traditional Medicare rates. According to CMS, the ACA cut $68 billion by “Reducing excessive Medicare payments to private insurers who operate in Medicare Advantage” (CMS, 2012). To do so, Congress
Additional changes included in the ACA, as well as subsequent legislation, have further increased the financial pressure on MA plans. For example, the ACA imposed a non-tax-deductible fee on most health plans, including MA. The actuarial firm Milliman has estimated the impact of that fee to be between 1.7% and 3% of plan revenue (Doucet & Yahnke, 2013; Swanson & Goetsch, 2015). However, the Consolidated Appropriations Act of 2016, Division Q, Title II, Section 201 suspended this fee for the 2016 calendar year which would be paid by plans in 2017 (Consolidated Appropriations Act of 2016, 2015).
CMS has also used its regulatory authority to increase the relative importance of the MA Star scores. Star scores are widely publicly reported on the Medicare plan finder (online enrollment) website and elsewhere to aid in consumer plan selection (Medicare Plan Finder, 2017). Plans deemed persistently low-performing (fewer than three stars for 3 years) are so noted on that website (receiving what is referred to as a low-performing icon) and are unable to receive online enrollment. In addition, Medicare beneficiaries are allowed to switch to plans earning five stars at any point in the calendar year, while lower performing plans are restricted to the annual open enrollment period (Medicare 2017 Part C & D Star Rating Technical Notes, 2016; Report to Congress: Social Risk Factors and Performance Under Medicare's Value-Based Purchasing Programs, 2016).
In addition to the changes made in the ACA and subsequently by CMS, the American Taxpayer Relief Act of 2012 (ATRA) ("American Taxpayer Relief Act of 2012," 2013), and subsequent CMS regulations reduced MA rates to reflect differences in risk coding between health plans and traditional Medicare (known as a coding intensity adjustment) (Centers for Medicare and Medicaid Services, 2014a). In April 2013, Congress imposed a 2% “sequestration” across the board to cut all of Medicare, including MA (2014). For the 2017 plan year CMS modified this same risk-adjustment methodology in an effort to more appropriately compensate plans serving sicker and more disabled beneficiaries. This had the effect of further reducing revenue to some MA plans (Announcement of Calendar Year (CY) 2016 for Medicare Advantage (MA) Capitation Rates and Medicare Advantage and Part D Payment Policies and Final Call
Medicare Advantage and Part D Payment Policies and Final Call Letter, 2016; Centers for Medicare and Medicaid Services, 2014a). In a report created for the MA trade group The Better Medicare Alliance describing the cumulative impact of these changes, the actuarial firm Milliman estimated that while average annual premiums paid to MA plans between 2012 to 2015 increased by $18.96, the annual “benefit value” (meaning the extra benefits received by MA participants but not available to beneficiaries
in traditional Medicare, such as reduced cost sharing and supplemental benefits) fell by $132.72 (Swanson & Goetsch, 2015).
The combination of reimbursement changes required by the ACA and subsequent legislation, as well as the threat of contract termination for repeated low stars performance, has created an imperative for MA plans to achieve high Medicare stars scores in order to obtain the bonus revenue necessary to ensure their products remain financially viable. For the 2015 plan year, the consulting firm McKinsey estimated that plans with fewer than four stars would forgo $3.47 billion in bonus payments (Carlton, Ladsariya, & Machado-Pereira, 2014). For the 2016 plan year, because more plans were able to achieve bonus
eligibility and more beneficiaries joined MA plans with four or more stars, that number dropped to a still substantial $2.03 billion (Hurley, Ladsariya, Machado-Pereira, & Vaskov, 2015; Medicare Payment Advisory Commission Public Meeting, 2015). Simply dividing that number by the total number of
beneficiaries participating in plans below four stars, the revenue lost by a plan failing to achieve four stars in 2016 was $362.5 per beneficiary.
Section 3.8 Medicare Advantage Stars Methodology
Each year CMS establishes the set of measures under which each plan will be scored in the following year. In making changes from year to year, CMS states, “Our priorities include enhancing the measures and methodology to reflect the true performance of organizations and sponsors, maintaining stability to the link to payment, and providing advance notice of future changes” (Advance Notice of
Part C and Part D Payment Policies and 2015 Call Letter, 2014). Despite this stated goal, the type and magnitude of changes made from year to year are not consistent.
The inconsistency manifests in several ways. First, some of the measures included in the scoring methodology in one year are not included in the next year. Second, the weight applied to the measure can change from year to year. For example, each measure receives a weight of one in the scoring
methodology in the first year that it is a part of the methodology, but that weight can be increased over time. Third, the organizations that promulgate the measures used in the methodology, (such as CMS or the National Committee on Quality Assurance (NCQA)) can change each measure’s parameters from year
to year.
Phase 2 of this study focuses on the transition from the quality bonus demonstration program to the full effect of the stars methodology required under the ACA which occurred on January 1, 2015. Using this transition as an example, between 2014 and 2015 four MA stars measures were changed as a result of changes in NCQA’s HEDIS specifications: one measure was moved to the display page; one
measure was retired (removed entirely); the specifications for four measures implemented by CMS were changed; and CMS changed the scoring methodology to increase the weight of the summary measure of year-over-year improvement (Advance Notice of Methodological Changes for Calendar Year (CY) 2015 for Medicare Advantage (MA) Capitation Rates, Part C and Part D Payment Policies and 2015 Call
Letter, 2014). A table created by the Centers for Medicare and Medicaid Services that lists the measures included in the methodology by year from 2008 to 2016 is included as Appendix H (CMS, 2014a).
Quality, 2014). Since 2011, CMS has required MA and part D contracts with more than 600 members to administer a plan-specific CAHPS survey. The survey includes six composite measures: getting needed care, getting care quickly, doctors who communicate well, health plan customer service, getting needed prescription drugs, and getting information from the health plan regarding prescription drug coverage and cost(Quality, 2014). HOS evaluates patient-reported outcomes based on a random sample of each MA plan’s participants. Developed by CMS, NCQA, Health Assessment Lab (HAL), and other experts, the
HOS survey has been used since 1998. The current version of HOS (v.3.0) contains questions regarding health status, physical and mental health outcomes, questions on impairments in activities of daily living, four HEDIS effectiveness of care measures, and demographic questions regarding race, ethnicity, primary language, sex, and disability status as required under the Affordable Care Act. HOS is administered to a random sampled of 1200 MA participants from each MA organization with more than 500 enrollees. Two years later the same respondents are surveyed again. For example, the 2016 administration of the HOS survey administered the initial survey to HOS cohort 19 and the resurvey to cohort 17 who were initially surveyed in 2014 (Health Services Advisory Group, 2014). CMS administrative data include information about member satisfaction, plans’ appeals processes, audit results, and customer service.
The MA stars methodology measures the MA plan’s performance against each measure in the year before the plan receives its score. That score then applies for the subsequent year. For example, the 2015 plan year score (the score that beneficiaries saw when shopping for a plan for the calendar year 2015) was received by each plan in 2014. That score was a measure of the plans’ performance under the
2015 stars methodology using 2013 data.
Plans are given ratings by domain of care, part C and part D summary score, and an overall summary rating of between one to five Medicare stars. The summary rating is derived from all four data sets. In 2014, the total measure set included 48 measures. Of those measures, 31 made up approximately 61% of a health plan’s overall star score (Medicare.gov, 2014). Twenty measures, 39% of the overall
Each clinical measure includes specifications (a numerator and denominator of patients) and clinical exclusions. For the 2014 plan year, in addition to clinical specifications, nine measures (18.8%) each of which come from the CAHPS and HOS surveys were adjusted to account for some SES attributes of the measured population, including age, race, education, income, and dual status. Only one measure, plan all-cause readmissions, was adjusted for clinical comorbidities (Medicare.gov, 2014). This unique measure, plan all-cause readmissions, calculates the percentage of acute inpatient stays during a given year that were followed by an acute readmission for any reason within 30 days of discharge. The formula used to calculate this measure divides the actual (observed) readmission rate by an expected readmission rate (a weighted average for each of three age bands: 65-74, 75-84, and 85+) and then multiplies this result by the national average observed rate (Centers for Medicare Medicaid Services, 2014).
Section 3.9 Socioeconomic Status and Other Demographic Factors and MA Stars