January 13, 2017 Comparing dynamic monitoring strategies based on evolving CD4 cell counts in virologically
suppressed HIV-positive individuals on cART:
a prospective observational study in high-income countries
The HIV-CAUSAL Collaboration and the Center for AIDS Research Network of Integrated Clinical Systems*
Correspondence:
Ellen C. Caniglia, ScD
Department of Epidemiology, Harvard T.H. Chan School of Public Health 677 Huntington Avenue, Boston MA 02115, USA
phone: 617-432-1539
e-mail: [email protected]
Word count: 362 (abstract), 3,302 (main text); 2 tables (+5 Appendix tables), 3 figures (+3 Appendix figures)
Abstract
Background: Clinical guidelines vary with respect to the optimal monitoring frequency of HIV-positive
individuals. We compared dynamic monitoring strategies based on evolving CD4 cell counts in
virologically suppressed HIV-positive individuals.
Methods: We used data from prospective studies of HIV-positive individuals in Europe and the Americas
in the HIV-CAUSAL Collaboration and The Center for AIDS Research Network of Integrated Clinical
Systems. We compared three monitoring strategies, which differ with respect to the CD4 cell count
threshold that is used to measure CD4 cell count and HIV-RNA every 3-6 months (when below the
threshold) or every 9-12 months (when above the threshold). The strategies were defined by the
thresholds 200, 350, and 500 cells/µl. We estimated hazard ratios of death and of AIDS-defining illness or
death, risk ratios of virologic failure, and mean differences in CD4 cell count using inverse probability
weighting to adjust for baseline and time-varying confounders.
Findings: 47,635 eligible individuals initiated a cART regimen between January, 2000 and November,
2015 and met the eligibility criteria for our study. During follow-up, CD4 cell count and HIV-RNA were
measured on average every 4 and 3.8 months, respectively. 464 individuals died (107 in threshold 200
strategy, 157 in threshold 350, and 200 in threshold 500) and 1,091 had AIDS-defining illnesses or died
(267 in threshold 200 strategy, 365 in threshold 350, and 459 in threshold 500). Compared with threshold
500, the mortality hazard ratio (95% CI) was 1.05 (0.86, 1.29) for threshold 200 and 1.02 (0.91, 1.14) for
threshold 350. Corresponding estimates for death or AIDS-defining illness were 1.08 (0.95, 1.22) and
1.03 (0.96, 1.12), respectively. The respective 24-month risk ratios (95% CI) of virologic failure
(HIV-RNA>200 copies/ml) were 2.01 (1.17, 3.43) and 1.24 (0.89, 1.73) and 24-month mean CD4 cell count
Interpretation: Our findings suggest that decreasing monitoring to annually when CD4 cell count>200
cells/µl compared with >500 cells/µl does not worsen the short-term clinical and immunologic outcomes
of virologically suppressed HIV-positive individuals, but more frequent virologic monitoring may be
necessary to decrease the risk of virologic failure. Further follow-up is needed to establish the long-term
safety of these strategies.
Funding: National Institutes of Health
Introduction
The overall benefits of immunologic and virologic monitoring for the management of HIV-positive
individuals are widely accepted, but the frequency with which CD4 cell count and HIV-RNA should be
monitored remains unknown.1-6
Clinical guidelines recommend dynamic strategies in which monitoring frequency among virologically
suppressed individuals on combined antiretroviral therapy (cART) can be decreased when their CD4 cell
count increases. The guidelines, however, vary with regards to the CD4 cell threshold at which this
decrease should occur.7-10 For example, the European AIDS Clinical Society recommends that CD4 cell
monitoring frequency can be decreased among stable individuals with a CD4 cell count>350 cells/µl and
HIV-RNA<50 copies/ml.9 In comparison, the British HIV Association advises that CD4 monitoring
frequency can be decreased in patients with a CD4 cell count>200 cells/µl and HIV-RNA<50 copies/ml
for 1 year. Guidelines for thresholds at which HIV-RNA monitoring frequency can be decreased are
generally lacking.7-10
Two randomized trials11,12 and several observational studies,13-16 including ours,17 focused on CD4 cell
and HIV-RNA monitoring strategies in which monitoring frequency is independent of an individual’s
time-varying CD4 cell count. While these studies found no clinical harm for annual13-17 or biannual11,12
monitoring, further follow-up is needed to establish the long-term safety. Moreover, none of these studies
evaluated the effectiveness of the dynamic monitoring strategies recommended by the guidelines with
respect to virologic and clinical outcomes.
Here, we evaluate the effect of CD4 cell count and HIV-RNA dynamic monitoring strategies on clinical,
virologic, and immunologic outcomes in virologically suppressed HIV-positive individuals using
analyses study whether information about an individual’s time-varying CD4 cell count can provide any
additional benefit in determining when monitoring frequency can be decreased.
Methods
Study population
The HIV-CAUSAL Collaboration includes prospective cohort studies from 6 European countries and the
Americas.18 The individual cohort studies are FHDH-ANRSC04 (France), ANRS PRIMO (France),
ANRS SEROCO (France), ANRS CO3-Aquitaine (France), UK CHIC (United Kingdom), UK Register of
HIV Seroconverters (United Kingdom), ATHENA (the Netherlands), SHCS (Switzerland), PISCIS
(Spain), CoRIS/CoRIS-MD (Spain), GEMES (Spain), VACS (United States), AMACS (Greece), IPEC
(Brazil) and SAC (Canada). The Center for AIDS Research (CFAR) Network of Integrated Clinical
Systems (CNICS) contains clinical data from inpatient and outpatient encounters of HIV-infected
individuals at 8 U.S. sites: Case Western Reserve University, Fenway Community Health Clinic, Johns
Hopkins University, University of Alabama at Birmingham, University of California at San Diego,
University of California at San Francisco, University of North Carolina, and University of Washington.19
All cohorts included in the HIV-CAUSAL and CNICS Collaborations are based on data collected
prospectively for clinical purposes.
Our analysis was restricted to antiretroviral-therapy naïve individuals18 who initiated a cART regimen in
2000 or later consisting of at least two nucleoside reverse transcriptase inhibitors plus one or more of the
following: protease inhibitor, nonnucleoside reverse transcriptase inhibitor, entry/fusion inhibitor, or
integrase inhibitor. Regimens consisting of abacavir or tenofovir with two or more additional nucleoside
reverse transcriptase inhibitors were also considered cART regimens (2.8% of all eligible regimens).
Individuals with confirmed virologic suppression (two consecutive HIV-RNA≤200 copies/ml) within 12
confirmed virologic suppression following cART initiation. Our analysis was further restricted to
individuals who met the following criteria at baseline: age 18 years or older and no pregnancy (when
information was available), no history of AIDS (defined as the onset of any Category C AIDS-defining
illness),20 and a CD4 cell count measured within the previous three months.
Outcomes
We considered two clinical outcomes: all-cause mortality and a combined end point of AIDS-defining
illness or death. The date of death was identified using a combination of national and local mortality
registries and clinical records, as described elsewhere,18,19 and AIDS-defining illnesses were ascertained
by the treating physicians. For each individual, follow-up ended at the event of interest, pregnancy (if
known), or the cohort-specific administrative end of follow-up (ranging from December, 2009, to
November, 2015), whichever occurred earlier. We also considered virologic failure (HIV-RNA>200
copies/ml) at 24 ± 2 months and mean CD4 cell count over the first 24 months of follow-up as outcomes.
Monitoring strategies
We compared three monitoring strategies, which differ with respect to the CD4 cell count threshold that is
used to measure CD4 cell count and HIV-RNA every 3-6 months (when below the threshold) or every
9-12 months (when above the threshold). The three strategies were defined by the thresholds 200, 350 and
500 cells/µl (Figure 1) so we refer to the strategies as “threshold 200”, “threshold 350”, and “threshold 500”, respectively. All three strategies further require individuals to be monitored once every 3-6 months
when HIV-RNA>200 copies/ml or after diagnosis of an AIDS-defining illness. Each strategy allowed an
additional one month before and after each monitoring window (e.g. 3-6 ± 1), so the grace period was a
total of 5 months.
At baseline, all individuals included in our study had data consistent with each of the three monitoring
hypothetical randomized trial -- a target trial21 -- where each eligible individual is randomly assigned to
one of the three monitoring strategies, we created an expanded dataset by making 3 exact replicates of each individual (1 per strategy). If and when an individual’s data were no longer consistent with a given
strategy, we artificially censored the corresponding replicate at that time. Replicates were censored when
they were monitored sooner than indicated by their strategy or when they were not monitored soon
enough. Replicates were also censored when a CD4 measurement was recorded without a HIV-RNA
measurement, or vice versa, which occurred in fewer than 13% of months in which a measurement was
recorded. Examples of the replication and censoring process have been described elsewhere.17,22
Statistical analysis
We fit a pooled logistic regression model to the expanded dataset to estimate the mortality hazard ratio for
monitoring strategy (a 3-level categorical variable with “threshold 500” as the reference) conditional on
time of follow-up (restricted cubic splines with 4 knots at 1, 6, 12, and 24 months) and the following
baseline covariates: sex, CD4 cell count (≤200, 201-350, 351-500, ≥501 cells/µl), years since HIV
diagnosis (<1, 1-4, ≥5 years, unknown), race (white, black, other or unknown), geographic origin (N.
America/W. Europe, Sub-Saharan Africa, other, unknown), acquisition group (heterosexual, homosexual
or bisexual, injection drug use, other or unknown), calendar year (restricted cubic splines with 3 knots at
2001, 2007 and 2011), age (restricted cubic splines with 3 knots at 25, 39 and 60 years), cohort, and
months from cART initiation to virologic suppression (2-4, 5-8, ≥9). We conducted an identical analysis
to estimate the hazard ratio of the combined endpoint of AIDS-defining illness or death. Because the
monthly probability of an event is small, the parameters of our pooled logistic model closely approximate
the parameters of a Cox proportional hazards model.23,24
To estimate absolute risks for the two clinical outcomes under each monitoring strategy, we fit a pooled
monitoring strategy and follow-up time. The model’s predicted values were used to estimate 24-month
survival and 24-month AIDS-free survival curves for each strategy.
The process of artificial censoring could induce time-varying selection bias. For example, an individual
whose CD4 drops from 500 cells/µl to 250 cells/µl and is subsequently monitored more frequently will be artificially censored from the “threshold 200” strategy. To adjust for the potential selection bias,25 we
weighted each replicate at each time by the inverse of the probability of having one’s own observed
monitoring history. For an explanation of why the probability of monitoring can be used to estimate the
probability of remaining uncensored, please see Cain et al. 2010.22 To estimate the inverse probability
weights, we fit a pooled multinomial regression model for monitoring (a 3-level categorical variable) in
the original, unexpanded study population. The model included the previously listed covariates as well as
the most recent measurement of the following time-varying covariates: CD4 cell count (restricted cubic
splines with 5 knots at 200, 350, 500, 650, and 1000 cells/µl), HIV-RNA (≤200, 201-999, 1,000-9,999, ≥10,000 copies/ml), diagnosis of an AIDS-defining illness (when the outcome was all-cause mortality),
proportion of months of follow-up from baseline to the current observation with a CD4 cell count
measurement (restricted cubic splines with 3 knots at 0.2, 0.3 and 0.5) and months since the last CD4 cell
count measurement (restricted cubic splines with 3 knots at 1, 4 and 7). Because of the dynamic nature of
the strategies under consideration, we computed partially stabilized weights and weights corresponding to
monitoring strategies where individuals are monitored with a uniform probability during the grace period
(Appendix Page 2).17,22 The weights were truncated at the 99th percentile,26 but truncation had little effect
on the estimates. Under each strategy, any replicate who did not have a CD4 cell count and HIV-RNA
measurement at least every 13 months was artificially censored, and so additional adjustment for loss to
follow-up was not necessary.
For the outcome virologic failure, we fit a weighted Poisson regression model27 with the same covariates
monitoring strategy among those with measurements at 24 ± 2 months. We used additional inverse
probability weights to adjust for censoring due to not having an HIV-RNA measurement at 24 ± 2
months. We varied the definitions of virologic suppression and failure and estimated the risk of virologic
failure at 18 ± 2 months in secondary analyses. To estimate mean CD4 cell count, we fit a weighted
log-linear regression model for mean CD4 cell count that further included product terms between monitoring
strategy and follow-up time. The model’s predicted values were used to estimate 24-month mean CD4
cell count curves. We performed several sensitivity analyses, which are described in the Appendix (Page
1). We used nonparametric bootstrapping with 500 samples to compute 95% confidence intervals for all
of our estimates.
Role of the funding source
The funders had no role in study design, data collection and analysis, data interpretation, or preparation of the manuscript. The corresponding author had full access to all data in the study and had final responsibility for the decision to submit for publication.
Results
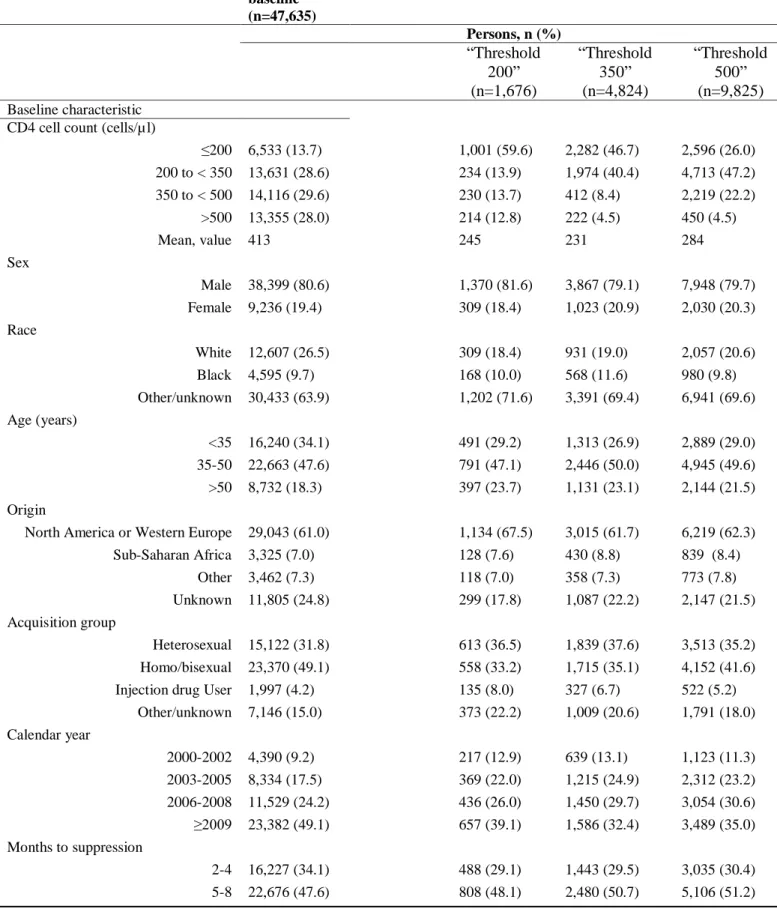
Table 1 shows the baseline characteristics of the 47,635 eligible individuals who initiated a cART
regimen between January, 2000 and November, 2015 and met the eligibility criteria for our study. The
analyses presented here are based on data pooled in November, 2015. During follow-up, CD4 cell count
and HIV-RNA were measured on average every 4 and 3.8 months, respectively, and HIV-RNA was
measured in more than 94% of months in which CD4 cell count was measured. In a given month, having
CD4 cell count measured was associated with older age, lower CD4 cell counts and higher HIV-RNA in
previous months, earlier calendar years, and a history of more frequent monitoring (Appendix Page 3).
Among the individuals who had data consistent with at least one monitoring strategy for one complete
more likely to be homo/bisexual, and were less likely to have been diagnosed with HIV infection in the
previous year, compared with individuals following the other strategies (Table 1). The rate of treatment
switching was smaller for those following the “threshold 200” strategy and similar for those following the “threshold 350” strategy, compared with those following the “threshold 500” strategy (Appendix Page 5).
Figure 2 shows the number of uncensored individuals who followed each of the three monitoring
strategies over time in the all-cause mortality analysis. Appendix Figure 1 (Page 8) show the proportion of
individuals who followed each monitoring strategy over follow-up time with HIV-RNA≤200 copies/ml,
without a diagnosis of an AIDS-defining illness, and with CD4 cell count greater than the corresponding strategy’s threshold (i.e. monitored every 9-12 months). The proportion of individuals with a CD4 cell
count above each strategy’s threshold decreased over follow-up time; a large amount of the artificial
censoring was due to individuals being monitored more frequently than every 9-12 months.
Death and AIDS-defining illness
During follow-up there were 464 deaths and 1,091 cases of the combined endpoint of AIDS-defining
illness or death. On average, each death contributed to 2.2 strategies and each case of AIDS-defining
illness or death contributed to 2.3 strategies. Among those with the event of interest, the median (IQR)
time from baseline to event was 6 (2,15) months for all-cause mortality and 5 (1,11) months for death or
AIDS-defining illness.
The mortality hazard ratio (95% CI) was 1.05 (0.86, 1.29) for “threshold 200” and 1.02 (0.91, 1.14) for “threshold 350”, compared with “threshold 500” (Table 2). Compared with “threshold 500”, the hazard
ratios for death or AIDS-defining illness were 1.08 (0.95, 1.22) for “threshold 200” and 1.03 (0.96, 1.12)
for “threshold 350”. If we had not adjusted for time-varying confounding, the hazard ratio estimates
would have been similar (Appendix Page 6). None of the sensitivity analyses yielded appreciably
The estimated 24-month survival (95% CI) was 0.99 (0.99, 1.00) for “threshold 200”, 0.99 (0.99, 0.99) for “threshold 350” and 0.99 (0.99, 0.99) for “threshold 500”. The corresponding estimates for 24-month
AIDS-free survival (95% CI) were 0.98 (0.97, 0.99), 0.98 (0.97, 0.98) and 0.98 (0.98, 0.99) (Figure 3).
Virologic failure
295 individuals experience virologic failure (HIV-RNA>200 copies/ml) at 24 ± 2 months. Compared with “threshold 500”, the risk ratio for virologic failure at 24 ± 2 months (95% CI) was 2.01 (1.17, 3.43) for
“threshold 200” and 1.24 (0.89, 1.73) for “threshold 350”. The risk ratios at 18 ± 2 months (95% CI) and
from alternative definitions of virologic suppression were closer to the null (Appendix Page 7), but the
95% confidence intervals were wide.
CD4 cell count
The mean baseline CD4 cell count was 413 cells/µl. At 24 months, the mean CD4 cell count (95% CI)
was 504.4 cells/µl (446.0, 570.5) for “threshold 200”, 500.5 cells/µl (446.2, 561.3) for “threshold 350”
and 504.0 cells/µl (450.5, 563.9) for “threshold 500”. The 24-month mean CD4 cell count difference
(95% CI) was 0.4 (-25.5, 26.3) cells/µl for “threshold 200” and -3.5 (-16.0, 8.9) cells/µl for “threshold
350”, compared with “threshold 500” (Appendix Page 9). When adjusting only for baseline confounding,
the 24-month mean CD4 cell count was larger for “threshold 500” compared with “threshold 200” (533.8
cells/µl compared with 486.8 cells/µl) (Appendix Page 10). There were no differences in mean CD4 cell
count at 24 months between the three strategies when excluding individuals presenting late to care, when
excluding intravenous drug users and those with an unknown mode of transmission, and when restricting
the analysis to individuals with baseline CD4 cell counts>500 cells/µl (data not shown).
Our findings suggest that decreasing monitoring of CD4 cell count and HIV-RNA from every 3-6 months
to every 9-12 months while CD4 cell count>200 cells/µl does not worsen the 2-year clinical and
immunologic outcomes of HIV-positive, virologically suppressed individuals on cART without AIDS in
high-income countries. Our estimates also suggest that decreasing monitoring frequency when CD4 cell
count>200 cells/µl compared with when CD4 cell count>500 cells/µl results in an increased risk of
virologic failure at 24 months of follow-up, but the 95% confidence intervals around these estimates were
wide. Because few individuals followed the strategies of interest for extended periods of time, we were
not able to assess clinical, immunologic, and virologic outcomes after 2-years of follow-up.
The individuals following the “threshold 500” strategy were monitored more frequently over follow-up on
average and had a higher rate of treatment switching compared with those following the “threshold 200”
strategy, even after adjusting for confounding. Thus one potential explanation for the virologic failure
finding is that individuals following the “threshold 500” strategy who had virologic failure switched
treatment and achieved virologic suppression before 24 months of follow-up.
Some limitations of our study should be noted. Like any other observational study, the validity of our
estimates relies on the untestable assumption that the measured covariates were sufficient to adjust for
confounding and selection bias. An imbalance of individuals with poor adherence to cART and to clinic
visits across the monitoring strategies could lead to bias. For example, physicians might monitor
individuals perceived to have lower adherence with greater frequency, and individuals with poor
adherence who maintain a suppressed HIV-RNA and CD4 cell count slightly above 200 cells/µl will follow the “threshold 200” strategy for longer than the other strategies. Though data on collection of ART
prescriptions or more direct adherence measurements were not available in our study, excluding
subgroups of individuals hypothesized to have low levels of adherence (those who did not achieve
and those with an unknown mode of transmission) did not affect the results. Still, if these sub-group
analyses did not adequately exclude individuals with poor adherence, our results could still be biased.
An imbalance of individuals with low CD4 cell counts across the monitoring strategies could also bias the
results. Since individuals in our study are monitored frequently over follow-up, regardless of their CD4 cell count, the “threshold 200” strategy has a higher concentration of individuals with CD4 cell
count<200 cells/µl than the other strategies. However, the inverse-probability weights function to balance
the distribution of baseline CD4 cell count across the strategies.
Our estimates would also be susceptible to bias if individuals monitored more (or less) frequently were
individuals at later stages of HIV infection, since these sicker patients would also be at a higher risk of
death. However, an analysis that partially reduces this confounding by excluding individuals presenting
late to care (initiating cART at a CD4 cell count<200 cells/µl) did not yield appreciably different results.
Our estimates could also be confounded if individuals are monitored more frequently after a treatment
regimen switch, but an analysis adjusting for time since first treatment switch did not affect our estimates.
If individuals with comorbidities visit the clinic more often compared with those who do not our results
could also be confounded, but adjustment for time since the last clinic visit did not alter the results. Some
residual confounding due to varying practice patterns among clinical centers is possible because our
estimates are adjusted for cohort but not for the individual centers within each cohort.
Clinical guidelines discourage CD4 cell count monitoring for individuals with undetectable HIV-RNA
and CD4>500 cells/µl for two years.10 While we could not directly compare strategies where CD4 cell
count monitoring is discontinued while HIV-RNA monitoring is maintained (because CD4 cell count and
HIV-RNA were usually monitored at the same time in our study), our finding that monitoring frequency
can be safely decreased with respect to clinical and immunologic outcomes, but not with respect to
Non-AIDS defining clinical events contribute substantially to morbidity in HIV-positive individuals on
successful cART, but were not assessed in this study. While our results support decreasing CD4 cell count
and HIV-RNA monitoring in healthy populations, regular clinic visits remain critical to assess adherence,
co-morbidities like HCV coinfection16, and psychosocial needs. Finally, our analysis included individuals
initiating cART in 2000 or later, yet it is possible that monitoring frequency could have differential effects
over calendar time as cART guidelines and prescribing patterns evolve.
Our results support current guidelines7-10 and suggest that the CD4 threshold at which monitoring
frequency can be decreased to annually may be as low as 200 cells/µl with respect to 2-year clinical and
immunologic outcomes. However, more frequent virologic monitoring may be necessary to reduce the
risk of virologic failure. While further research is warranted to obtain more precise effect estimates over
Writing Committee: Ellen C. Caniglia, Lauren E. Cain, Caroline A. Sabin, James M. Robins, Roger Logan, Sophie Abgrall, Michael J. Mugavero, Sonia Hernández-Díaz, Laurence Meyer, Remonie Seng, Daniel R. Drozd, George R. Seage III, Fabrice Bonnet, Francois Dabis, Richard D. Moore, Peter Reiss, Ard van Sighem, William C. Mathews, Julia del Amo, Santiago Moreno, Steven G. Deeks, Roberto Muga, Stephen L. Boswell, Elena Ferrer, Joseph J. Eron, Sonia Napravnik, Sophie Jose, Andrew Phillips, Amy Justice, Janet Tate, John Gill, Antonio Pacheco, Valdilea G. Veloso, Heiner C. Bucher, Matthias Egger, Hansjakob Furrer, Kholoud Porter, Giota Touloumi, Heidi Crane, Jose M. Miro, Jonathan A. Sterne, Dominique Costagliola, Michael Saag, Miguel A. Hernán
Contributors: ECC and MAH designed the study and wrote the manuscript with significant input from LEC, JMR, GRS, and SHD. CAS, SA, MJM, LM, RS, DRD, FB, FD, RDM, PR, AvS, WCM, JdA, SM, SGD, RM, SLB, EF, JJE, SN, SJ, AP, AJ, JT, JG, AP, VGV, HCB, ME, HF, KP, GT, HC, JMM, DC, and MS contributed to data collection. ECC and RL did statistical analyses. All authors contributed to
interpretation of data and revised and approved the manuscript.
Funding: This research was supported by NIH grant R01 AI073127; by NIH grant T32 AI007433 from the National Institute of Allergy and Infectious Diseases; and by the CFAR Network of Integrated Clinical Systems-CNICS, an NIH funded program (R24 AI067039) that was made possible by the National Institute of Allergy and Infectious Diseases (NIAID) and the National Heart, Lung and Blood Institute (NHLBI). Its contents are solely the responsibility of the authors and do not necessarily represent the official views of the NIH. JMM received a personal intensification research grant #INT15/00168 during 2016 from Instituto de Salud Carlos III, Madrid, Spain.
Squibb, Gilead Sciences, Janssen, and ViiV Healthcare; and personal fees from Merck, outside the submitted work. JAS reports grants from UK Medical Research Council, during the conduct of the study. PR reports grants and other from Gilead Sciences, Janssen Pharmaceutical and ViiV Healthcare; and grants from Bristol Myers Squibb and Merck & Co, outside the submitted work. HF reports grants paid to his institution from ViiV; and grants from Gilead, MSD, Janssen, BMS, and Abbvie, outside the
Table 1. Characteristics of the individuals at baseline and at 14 months of follow-up, CNICS and HIV-CAUSAL Collaboration 2000-2015
Individuals at baseline (n=47,635)
Individuals remaining at 14 months of follow-up (n=16,325)
Persons, n (%) “Threshold 200” (n=1,676) “Threshold 350” (n=4,824) “Threshold 500” (n=9,825) Baseline characteristic
CD4 cell count (cells/µl)
≤200 6,533 (13.7) 1,001 (59.6) 2,282 (46.7) 2,596 (26.0) 200 to < 350 13,631 (28.6) 234 (13.9) 1,974 (40.4) 4,713 (47.2) 350 to < 500 14,116 (29.6) 230 (13.7) 412 (8.4) 2,219 (22.2)
>500 13,355 (28.0) 214 (12.8) 222 (4.5) 450 (4.5)
Mean, value 413 245 231 284
Sex
Male 38,399 (80.6) 1,370 (81.6) 3,867 (79.1) 7,948 (79.7) Female 9,236 (19.4) 309 (18.4) 1,023 (20.9) 2,030 (20.3) Race
White 12,607 (26.5) 309 (18.4) 931 (19.0) 2,057 (20.6) Black 4,595 (9.7) 168 (10.0) 568 (11.6) 980 (9.8) Other/unknown 30,433 (63.9) 1,202 (71.6) 3,391 (69.4) 6,941 (69.6) Age (years)
<35 16,240 (34.1) 491 (29.2) 1,313 (26.9) 2,889 (29.0) 35-50 22,663 (47.6) 791 (47.1) 2,446 (50.0) 4,945 (49.6) >50 8,732 (18.3) 397 (23.7) 1,131 (23.1) 2,144 (21.5) Origin
North America or Western Europe 29,043 (61.0) 1,134 (67.5) 3,015 (61.7) 6,219 (62.3) Sub-Saharan Africa 3,325 (7.0) 128 (7.6) 430 (8.8) 839 (8.4)
Other 3,462 (7.3) 118 (7.0) 358 (7.3) 773 (7.8) Unknown 11,805 (24.8) 299 (17.8) 1,087 (22.2) 2,147 (21.5) Acquisition group
Heterosexual 15,122 (31.8) 613 (36.5) 1,839 (37.6) 3,513 (35.2) Homo/bisexual 23,370 (49.1) 558 (33.2) 1,715 (35.1) 4,152 (41.6) Injection drug User 1,997 (4.2) 135 (8.0) 327 (6.7) 522 (5.2)
Other/unknown 7,146 (15.0) 373 (22.2) 1,009 (20.6) 1,791 (18.0) Calendar year
2000-2002 4,390 (9.2) 217 (12.9) 639 (13.1) 1,123 (11.3) 2003-2005 8,334 (17.5) 369 (22.0) 1,215 (24.9) 2,312 (23.2) 2006-2008 11,529 (24.2) 436 (26.0) 1,450 (29.7) 3,054 (30.6) ≥2009 23,382 (49.1) 657 (39.1) 1,586 (32.4) 3,489 (35.0) Months to suppression
9-12 8,732 (18.3) 383 (22.8) 967 (19.8) 1,837 (18.4)
Mean, value 5.9 6.4 6.2 6.1
Years since HIV diagnosis
<1 15,602 (32.8) 695 (41.4) 2,114 (43.2) 3,692 (37.0) 1- < 5 17,114 (35.9) 439 (26.2) 1,204 (24.6) 3,118 (31.3) 5 or more 5,716 (12.0) 180 (10.7) 629 (12.9) 1,343 (13.5) unknown 9,203 (19.3) 365 (21.7) 943 (19.3) 1,825 (18.3) Time-varying characteristic
(measured at 14 months)
Most recent CD4 cell count (cells/µl)
<200 -- 700 (41.7) 938 (19.2) 964 (9.7)
200 to < 350 -- 426 (25.4) 2,438 (49.9) 3,341 (33.5) 350 to < 500 -- 208 (12.4) 1,066 (21.8) 3,898 (39.1)
≥500 -- 345 (20.6) 448 (9.2) 1,775 (17.8)
Mean, value -- 324 316 379
Most recent HIV-RNA (copies/ml)
≤200 -- 1,525 (90.8) 4,607 (94.2) 9,511 (95.3)
201-999 -- 45 (2.7) 112 (2.3) 204 (2.0)
1,000-9,999 -- 40 (2.4) 66 (1.4) 110 (1.1)
≥10,000 -- 69 (4.1) 105 (2.2) 153 (1.5)
Table 2. Clinical and virologic outcomes by monitoring strategy, CNICS and HIV-CAUSAL Collaboration 2000-2015
Outcome and monitoring strategy Outcomes, cases Person-months Hazard ratios* (95% CI)
All-cause mortality
“Threshold 200” 107 249,597 1.05 (0.86, 1.29)
“Threshold 350” 157 340,428 1.02 (0.91, 1.14)
“Threshold 500” 200 490,713 1.00 (reference)
AIDS-defining illness or death
“Threshold 200” 267 247,816 1.08 (0.95, 1.22)
“Threshold 350” 365 337,823 1.03 (0.96, 1.12)
“Threshold 500” 459 487,232 1.00 (reference)
Virologic failure
(RNA>200) at 24 months
No. faileda Risk ratios* (95% CI)
“Threshold 200” 35 2.01 (1.17, 3.43)
“Threshold 350” 89 1.24 (0.89, 1.73)
“Threshold 500” 171 1.00 (reference)
a. Based on 405, 1,610, and 3,962 individuals with HIV-RNA measurements at 24 ± 2 months following the “threshold 200”, “threshold 350” and “threshold 500” strategies, respectively.
Figure 1. Schematic of one of the three dynamic monitoring strategies under the CD4 cell count threshold 200cells/µl, CNICS and HIV-CAUSAL Collaboration 2000-2015.
The other two strategies are identical except that the CD4 cell count threshold is 350 cells/µl in the 2nd strategy and 500 cells/µl in the 3rd strategy.
CD4>200 cells/µl, HIV-RNA≤200 copies,
and no AIDS at time t
yes
again after 9-12 monthsmonitor CD4 and RNAFigure 2. Number of individuals following each monitoring strategy over follow-up,CNICS and HIV-CAUSAL Collaboration 2000-2015
“Threshold 200” “Threshold 350” “Threshold 500”
47,635 8,826 3,158 969 462 0 10,000 20,000 30,000 40,000 50,000 60,000
0 6 12 18 24
Time (months) 47,635 15,390 6,779 3,204 1,784 0 10,000 20,000 30,000 40,000 50,000 60,000
0 6 12 18 24
Time (months) 47,635 23,386 12,350 7,129 4,384 0 10,000 20,000 30,000 40,000 50,000 60,000
0 6 12 18 24
Time (months)
censored for other reasons
artificially censored - uneven monitoring
artificially censored - monitored too late
artificially censored - monitored too early
Figure 3. 24-month survival and AIDS-free survival curves by monitoring strategy, CNICS and HIV-CAUSAL Collaboration 2000-2015
References
1. Mugyenyi P, Walker AS, Hakim J, et al. Routine versus clinically driven laboratory monitoring of HIV antiretroviral therapy in Africa (DART): a randomised non-inferiority trial. Lancet 2010; 375(9709): 123-31.
2. Kekitiinwa A, Cook A, Nathoo K, et al. Routine versus clinically driven laboratory monitoring and first-line antiretroviral therapy strategies in African children with HIV (ARROW): a 5-year open-label randomised factorial trial. Lancet 2013; 381(9875): 1391-403.
3. Mermin J, Ekwaru JP, Were W, et al. Utility of routine viral load, CD4 cell count, and clinical monitoring among adults with HIV receiving antiretroviral therapy in Uganda: randomised trial. BMJ
(Clinical research ed) 2011; 343: d6792.
4. Chang LW, Harris J, Humphreys E. Optimal monitoring strategies for guiding when to switch first-line antiretroviral therapy regimens for treatment failure in adults and adolescents living with HIV in low-resource settings. The Cochrane database of systematic reviews 2010; (4): Cd008494.
5. Kahn JG, Marseille E, Moore D, et al. CD4 cell count and viral load monitoring in patients undergoing antiretroviral therapy in Uganda: cost effectiveness study. BMJ (Clinical research ed) 2011;
343: d6884.
6. Laurent C, Kouanfack C, Laborde-Balen G, et al. Monitoring of HIV viral loads, CD4 cell counts, and clinical assessments versus clinical monitoring alone for antiretroviral therapy in rural district hospitals in Cameroon (Stratall ANRS 12110/ESTHER): a randomised non-inferiority trial. The Lancet
infectious diseases 2011; 11(11): 825-33.
7. World Health Organization. WHO Guidelines Approved by the Guidelines Review Committee. Antiretroviral Therapy for HIV Infection in Adults and Adolescents: Recommendations for a Public Health Approach: 2010 Revision. Geneva: World Health Organization; 2010.
8. Asboe D, Aitken C, Boffito M, et al. British HIV Association guidelines for the routine
investigation and monitoring of adult HIV-1-infected individuals 2011. HIV medicine 2012; 13(1): 1-44. 9. European AIDS Clinical Society. EACS Guidelines Version 8.0. June 2016.
http://www.eacsociety.org/files/guidelines_8.0-english-revised_20160610.pdf (accessed June 15 2016). 10. Department of Health and Human Services. Guidelines for the Use of Antiretroviral Agents in HIV-1-Infected Adults and Adolescents. January 28 2016.
http://aidsinfo.nih.gov/contentfiles/lvguidelines/adultandadolescentgl.pdf (accessed June 15 2016). 11. Weissman S, Singh S, Dykema S, Parker RD. Randomized Controlled Trial: 4 Month versus 6 Month Monitoring of HIV-infected Patients on Highly Active Antiretroviral Therapy. Journal of
community health 2016; 41(5): 1044-8.
12. Haubrich RH, Currier JS, Forthal DN, et al. A randomized study of the utility of human immunodeficiency virus RNA measurement for the management of antiretroviral therapy. Clinical
infectious diseases : an official publication of the Infectious Diseases Society of America 2001; 33(7):
1060-8.
13. Reekie J, Mocroft A, Sambatakou H, et al. Does less frequent routine monitoring of patients on a stable, fully suppressed cART regimen lead to an increased risk of treatment failure? AIDS (London,
England) 2008; 22(17): 2381-90.
14. Chaiwarith R, Praparattanapan J, Nuntachit N, Kotarathitithum W, Sirisanthana T, Supparatpinyo K. Impact of the frequency of plasma HIV-1 RNA monitoring on the outcome of antiretroviral therapy.
Current HIV research 2011; 9(2): 82-7.
16. Nicolas D, Esteve A, Cuadros A, et al. Safe Reduction in CD4 Cell Count Monitoring in Stable, Virally Suppressed Patients With HIV Infection or HIV/Hepatitis C Virus Coinfection. Clinical infectious
diseases : an official publication of the Infectious Diseases Society of America 2016; 62(12): 1578-85.
17. Caniglia EC, Sabin C, Robins JM, Logan R, Cain LE, al. E. When to monitor CD4 cell count and HIV RNA to reduce mortality and AIDS-defining illness in virologically suppressed HIV-positive persons on antiretroviral therapy in high-income countries: a prospective observational study. Journal of acquired
immune deficiency syndromes (1999) 2016.
18. Ray M, Logan R, Sterne JA, et al. The effect of combined antiretroviral therapy on the overall mortality of HIV-infected individuals. AIDS (London, England) 2010; 24(1): 123-37.
19. Kitahata MM, Rodriguez B, Haubrich R, et al. Cohort profile: the Centers for AIDS Research Network of Integrated Clinical Systems. International journal of epidemiology 2008; 37(5): 948-55. 20. Centers for Disease Control and Prevention. 1993 revised classification system for HIV infection and expanded surveillance case definition for AIDS among adolescents and adults. MMWR Morbidity and Mortality Weekly Report; 1992. p. 1-9.
21. Hernan MA, Robins JM. Using Big Data to Emulate a Target Trial When a Randomized Trial Is Not Available. American journal of epidemiology 2016; 183(8): 758-64.
22. Cain LE, Robins JM, Lanoy E, Logan R, Costagliola D, Hernan MA. When to start treatment? A systematic approach to the comparison of dynamic regimes using observational data. The international
journal of biostatistics 2010; 6(2): Article 18.
23. D'Agostino RB, Lee ML, Belanger AJ, Cupples LA, Anderson K, Kannel WB. Relation of pooled logistic regression to time dependent Cox regression analysis: the Framingham Heart Study. Statistics in
medicine 1990; 9(12): 1501-15.
24. Thompson WA, Jr. On the treatment of grouped observations in life studies. Biometrics 1977;
33(3): 463-70.
25. Hernan MA, Lanoy E, Costagliola D, Robins JM. Comparison of dynamic treatment regimes via inverse probability weighting. Basic & clinical pharmacology & toxicology 2006; 98(3): 237-42.
26. Cole SR, Hernan MA. Constructing inverse probability weights for marginal structural models.
American journal of epidemiology 2008; 168(6): 656-64.
27. Spiegelman D, Hertzmark E. Easy SAS calculations for risk or prevalence ratios and differences.
Research in context panel Evidence before this study
We searched PubMed and reports from WHO, the Department of Health and Human Services, the European AIDS Clinical Society, and the British HIV Association using combinations of the search terms “CD4 cell count”, “viral load”, “antiretroviral therapy”, and “monitoring” for articles published in English up to January 1, 2017. Two randomized trials and several observational studies have addressed the
question of when to monitor CD4 cell count and HIV-RNA in HIV-positive individuals on combined antiretroviral therapy (cART). The results from the randomized trials were conflicting with respect to the main virologic outcome, but the studies defined the monitoring strategies, eligibility criteria, and follow-up differently. Both the randomized trials and the observational studies did not assess clinical endpoints, had short follow-up, and did not compare dynamic monitoring strategies in which monitoring frequency depends on an individual’s time-varying CD4 cell count.
Added value of this study
We have used observational data from two collaborations of prospective cohort studies from Europe and the Americas to compare the effectiveness of three dynamic monitoring strategies applied to virologically suppressed HIV-positive individuals. The three strategies differ with respect to the CD4 cell count threshold that is used to measure CD4 cell count and HIV-RNA every 3-6 months (when below the threshold) or every 9-12 months (when above the threshold). The threshold was 200 cells/µl in the first strategy, 350 cells/µl in the second strategy, and 500 cells/µl in the third strategy. In this population we found no effect of the monitoring strategies on survival, AIDS-free survival, and 2-year mean CD4 cell count, suggesting that decreasing monitoring to annually when CD4 cell count>200 cells/µl compared with >500 cells/µl does not worsen the short-term clinical and immunologic outcomes of virologically suppressed HIV-positive individuals. However, we found that decreasing monitoring frequency when CD4 cell count>200 cells/µl compared with >500 cells/µl results in an increased risk of virologic failure at 2 years.
Implications of all the available evidence