ASSESSMENT OF PHANTOM DOSIMETRY AND IMAGE QUALITY OF ACCUITOMO 170 AND MINICAT CONE-BEAM COMPUTED
TOMOGRAPHY
Robert Todd Erickson
A thesis submitted to the faculty at the University of North Carolina at Chapel Hill in partial fulfillment of the requirements for the degree of Master of Science in the School of
Dentistry.
Chapel Hill 2014
Approved by:
John B. Ludlow
Andre Mol
©2014
ABSTRACT
Robert Todd Erickson: Assessment of Phantom Dosimetry and Image Quality of Accuitomo 170 and MiniCAT Cone-Beam Computed Tomography
(Under the direction of John B. Ludlow)
Introduction: Escalating use of cone-beam computed tomography contributes to a
burgeoning public health issue regarding the amount of ionizing radiation associated with
diagnostic imaging delivered to the population, especially children.
Methods: Effective doses were calculated and compared from optically stimulated
dosimeter measurements and a previously validated protocol using anthropomorphic adult
and child phantoms scanned with the Accuitomo 170 (J. Morita, Japan) and MiniCAT
(Xoran Technologies, Ann Arbor, MI) CBCT machines.
Results: Average child phantom doses (440 and 117 µSv) were 60% and 56% greater
than the adult doses from the Accuitomo 170 and MiniCAT units respectively. Thyroid dose,
particularly to the child, had a significant contribution to the overall dose.
Conclusion: Effective dose for the two units increased as FOV increased. The child
dose, especially the thyroid, increased when compared to the adult phantom. Child protocols
To my magnificent, beautiful, and loving wife, Anne, who has endured so much being supportive of me and our incredible son Luke, who is a young man with qualities of intellect,
TABLE OF CONTENTS
LIST OF TABLES ... vii
LIST OF FIGURES ... viii
CHAPTER 1. LITERATURE REVIEW ... 1
Cone-beam Computed Tomography Imaging ... 1
Newer Imaging Modalities ... 3
Factors Effecting Image Quality and Patient Dose ... 5
Scan Volume ... 6
Detectors ... 7
Grayscale... 9
Reconstruction ... 9
Three-Dimensional Volume Rendering ... 10
Accuracy ... 12
Imaging Protocol ... 13
Image Optimization ... 13
Spatial Resolution ... 14
Image Artifacts of CBCT ... 15
Introduced Artifacts ... 19
Strengths and Limitations of CBCT ... 20
Relatively Low Patient Radiation Dose ... 20
Interactive Analysis ... 21
Reconstruction Algorithms ... 23
Poor Soft Tissue Contrast ... 25
CBCT in Dentistry ... 26
Irradiation of Children ... 30
References ... 33
CHAPTER 2. ASSESSMENT OF PHANTOM DOSIMETRY AND IMAGE QUALITY OF ACCUITOMO 170 AND MINICAT CONE-BEAM COMPUTED TOMOGRAPHY ... 37
Introduction ... 37
Exposure to Radiation ... 39
Measuring Dose ... 40
Image Quality... 44
Materials and Methods ... 46
Effective Dose ... 51
Statistics ... 52
Results ... 53
Discussion ... 57
Conclusion ... 64
References ... 66
LIST OF TABLES
Table 1. ICRP Tissue-Weighting Factors (WT)
(ICRP 1977; ICRP 1990; ICRP 2007) ... 92
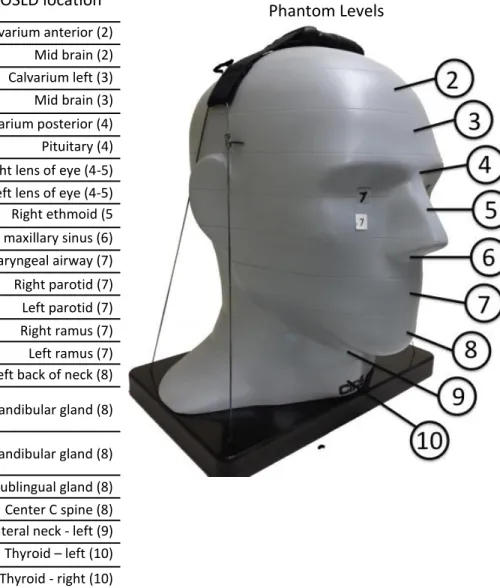
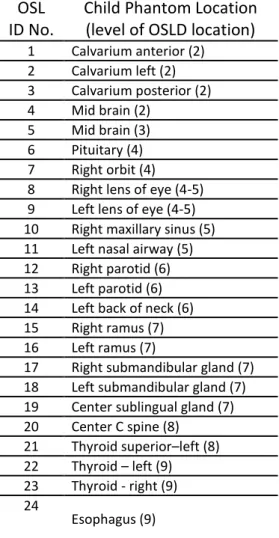
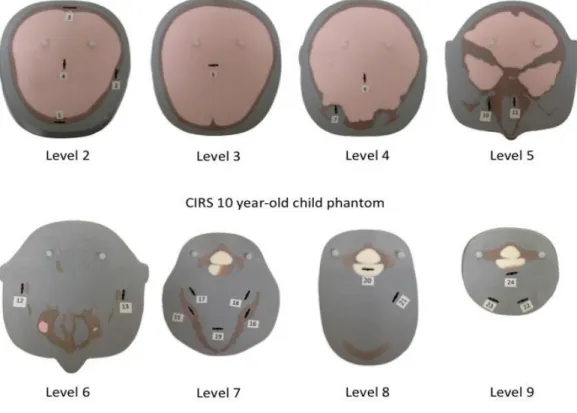
Table 2. Estimated Percentage of Tissue irradiated and OSLs Used to Calculate Mean Absorbed Dose to a Tissue or Organ of an Adult or 10-Year-Old Child ATOM Phantom ... 94
Table 3. MiniCAT: Effective Dose Adult and Child ATOM Phantom ... 95
Table 4. MiniCAT: Effective Dose with Percentage Increase from Adult to Child ... 95
Table 5. MiniCAT: Thyroid Effective Dose Adult and Child ATOM Phantom 95 Table 6. MiniCAT Thyroid Effective Dose ... 96
Table 7. Accuitomo 170 Adult and Child Effective Dose ... 96
Table 8. Accuitomo 170 Adult and Child Thyroid Effective Dose ... 97
Table 9.Accuitomo 170 Percent Thyroid Contribution to Effective Dose ... 98
Table 10. Equivalent Dose Measurements on the Adult Phantom for MiniCAT ... 99
Table 11. Equivalent Dose Measurements on the Child Phantom for MiniCAT ... 100
Table 12. Equivalent dose Measurements on an Adult Phantom for the Accuitomo 170 ... 101
Table 13. Equivalent Dose Measurements on a Child Phantom for the Accuitomo 170 ... 102
Table 14. Quart Data for the Accuitomo 170 ... 103
LIST OF FIGURES
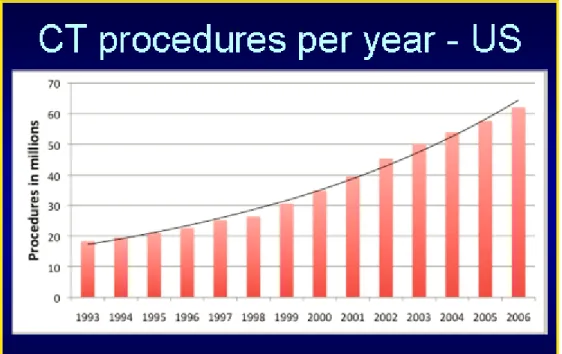
Figure 1. CT procedures per year in the United States ... 70
Figure 2. Source of per dapita contribution of of radiation exposure in the United States ... 70
Figure 3. A. Optically Stimulated Luminescent (OSL) dosimeters B. Microstar Reader ... 71
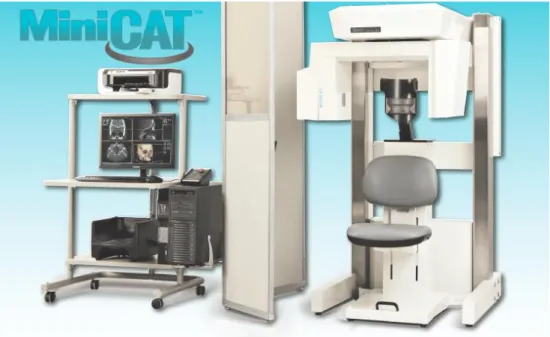
Figure 4. MiniCAT CBCT and viewing station (Xoran Technologies, Ann Arbor, MI) ... 71
Figure 5. MiniCAT fields of view (Courtesy of Xoran Technology Sales and Marketing Brochure) ... 72
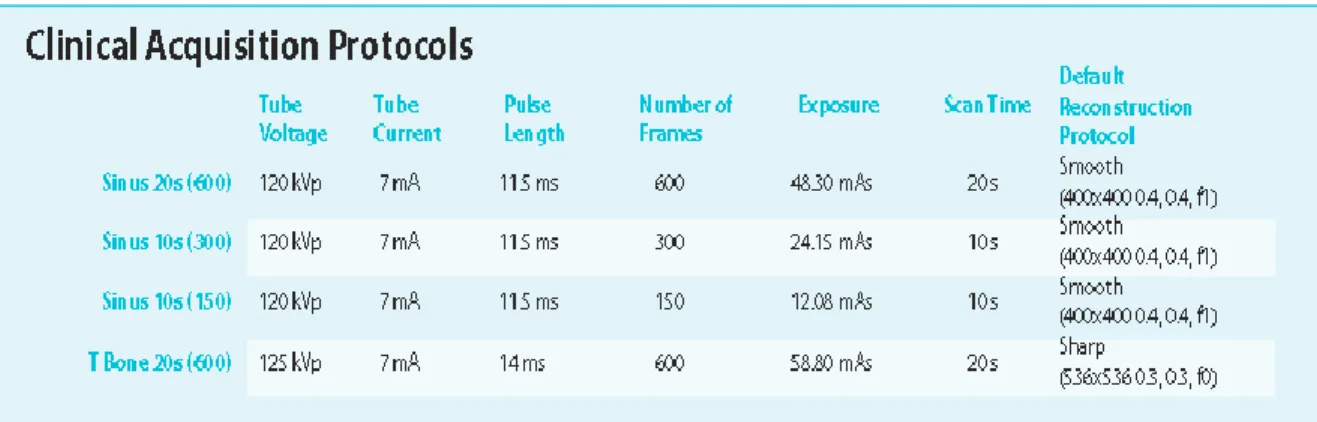
Figure 6. Protocols per manufacturer ... 73
Figure 7. Accuitomo 170, J. Morita Corporation ... 73
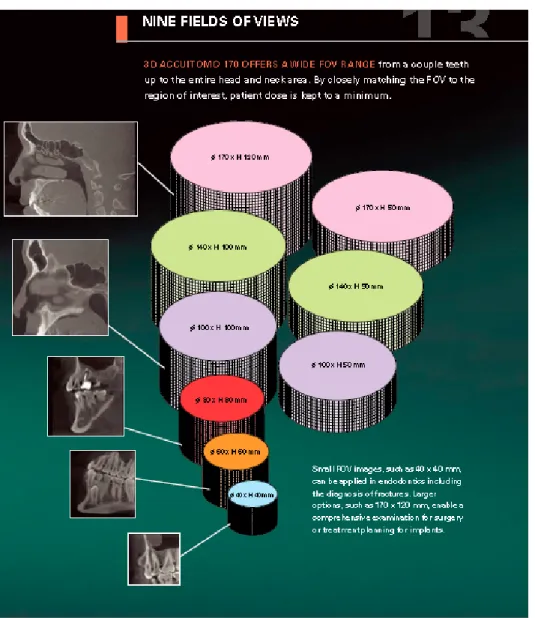
Figure 8. Accuitomo 170: Nine fields of view ... 74
Figure 9. Accuitomo 170 acquisition parameters ... 75
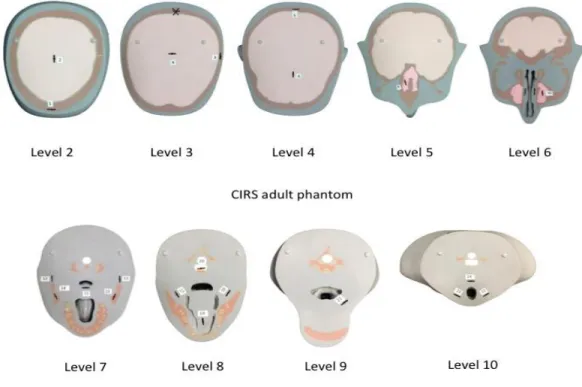
Figure 10. Adult ATOM Phantom slices with machined slots for OSL dosimeters ... 76
Figure 11. Locations of Optically Stimulated Luminescent (OSL) dosimeters in Adult ATOM Max model 711 Phantom ... 77
Figure 12A. Child ATOM Phantom with OSL dosimeter locations ... 78
Figure 12B. Child ATOM Slices with machined OSL dosimeter locations ... 79
Figure 13. Field of view examples acquired from Xoran MiniCAT volumes ... 80
Figure 14. Examples of representative FOVs from the Accuitomo 170; adult and child ... 82
Figure 15.QUART DVT_AP CBCT image quality system ... 85
Figure 16. Graphic representation of effective dose using the MiniCAT and ATOM Phantom ... 86
Figure 17. Effective doses for thyroid gland in adult and child ATOM Phantom ... 86
Figure 19. Accuitomo 170 effective dose for adult and child ATOM Phantom... 88
Figure 20. Accuitomo 170 effective dose for thyroid using the adult
and child ATOM Phantom ... 89
Figure 21. Accuitomo 170: Percent thyroid contribution to effective
dose for adult and child ATOM Phantom ... 90
CHAPTER 1. LITERATURE REVIEW
Cone-beam Computed Tomography Imaging
The field of radiology had its genesis in late 1895, when Wilhelm Roentgen
fortuitously discovered x-rays while working in his physics lab in Germany. Roentgen
quickly recognized the value of his discovery to medicine and within a very short time
produced and published the first medical x-ray image in early 1896. The discovery of x-rays
was followed by significant scientific vigor and further research and additional properties
were learned. Some facts revealed that x-rays had an insidious characteristic that could cause
extensive tissue damage and even death. The famous American inventor Thomas Edison was
investigating various properties of x-rays with an assistant and long-time friend, who
subsequently suffered severe radiation burns that lead to tremendous suffering and his death
a few years later. This occurred because x-rays are located in the high-energy spectrum of
electromagnetic radiation. X-rays can penetrate as well as interact with tissues in their path.
Absorption and scattering of this high-energy radiation is what reaches an x-ray receptor and
ultimately results in an image. A Boston dentist made a significant discovery regarding the
spectrum of energy in an x-ray beam when he used x-rays to image teeth. He learned that by
restricting the x-ray beam with a sheet of lead with a hole in the center and inserting a leather
or aluminum filter into the hole he improved the diagnostic quality of the radiographs. This
property of x-rays heralded the quest to understand and manipulate the complex relationship
Over the past nearly 120 years, the field of radiology has made huge strides with
technological advancements that have subsequently resulted in remarkable contributions to
the diagnosis and treatment of disease in all fields of health care. Different types of medical
images can be made by varying the types of energies and the acquisition technology
employed. In its simplest form radiography is accomplished with an x-ray source on one side
of the patient and a typically flat ray detector on the other side. A short-duration pulse of
x-rays is emitted by the x-ray tube, and a large percentage of x-x-rays in the beam interact with
the patient and are preferentially attenuated due to the varying tissue densities. Some x-rays
reach a detector and, depending on the technology being used, will produce an image of
varying likeness and resolution to the region being scanned.2
One of the most significant landmark developments in image acquisition was the
invention of a revolutionary imaging technique in 1972 by Godfrey Hounsfield, a British
engineer/physicist, that used image reconstruction mathematics developed by Alan Cormack
in the 1950s and 1960s to produce cross-sectional images of the head.3 This modality has
become known as computed tomography (CT). Although initially slow with rudimentary
image quality, CT has undergone several generations of technological advancements over the
past four decades. The improvements have reduced scan time, increased x-ray tube power,
and advanced reconstruction algorithms, which have led to significant enhancements in CT
image quality and ease of use.2. Due to the escalations in image quality and reduction in
acquisition time, CT has experienced gigantic growth since its inception. The advent of
helical CT scanners in 1989 and then multi-slice CT in 1998 has led to a pronounced boom in
usage. Reducing scan time increases the number of clinical applications for CT imaging and
number of CT scans performed annually in the United States is between 70 million and 80
million. Between 1997 and 2007, there has been an exponential growth rate for CT scanning
that shows no sign of abatement in the near future.2
Newer Imaging Modalities
CT scanners function with the x-ray source emitting a fan-shaped beam of radiation
that encircles the patient 360°as the patient is moved through a gantry. For a specified region
of interest (ROI), modified axial or helical slices of a predetermined width using collimation
are captured by an array of detectors. The raw data captured in each projection by the
detector is stored in a computer. With CT imaging systems, the x-rays form a stored
electronic image that is displayed as a matrix of intensities. Image reconstruction occurs via a
complex process called filtered back projection and Feldkamp reconstruction. The CT imaging system will often use an array processor and completes several hundred thousand
calculations simultaneously. Three-dimensional multiplanar reconstruction (MPR) images
can be viewed in axial, coronal, or sagittal planes or in a custom plane depending on the
diagnostic task desired.1
The type of CT imaging used for this project is a relatively recent technology most
commonly referred to as cone-beam computed tomography (CBCT). The equipment has
many comparisons to conventional CT, but it is the differences that have made this modality
gain tremendous popularity, particularly for maxillofacial imaging. CBCT was initially
developed for angiography in 1982. More contemporary medical applications have included
radiotherapy guidance,4 mammography,5and cardiology.6
CBCT is the imaging modality used in this research study. Therefore, an overview of
obtaining an understanding of the influence of technical parameters on image quality and
patient radiation exposure. It is vital to understand that there are similarities between CBCT
and Multi-Slice Computed Tomography (MSCT), which is used ubiquitously in hospitals and
medical centers throughout the developed world. However, the unique characteristics of the
CBCT have both lead to its escalating use in maxillofacial imaging, as well as inherently
limited the depth and spectrum of its usage.
Imaging data for CBCT is acquired by using an x-ray source and a detector mounted
on a rotating gantry that moves synchronously around the region of interest. The radiation
emitted from the x-ray tube passes through circular collimation, which produces a
three-dimensional divergent pyramidal beam or “cone beam.” This beam revolves 180°to 360°
around the patient, passing through the middle of the area of interest onto a two-dimensional
digital array, which serves as an area detector. The exposure incorporates the entire region of
interest; therefore, the full volume of tissue is captured with one rotation of the gantry.
During this rotation, between 150 and 600 (depending on the unit) sequential planar
projection images of the selected field-of-view (FOV) are acquired. The individual images
are similar to 2D lateral and posterior- anterior (PA) cephalometric images that have been
sequentially offset from each other during the rotation of the gantry. This process differs
from Multi-Detector CT (MDCT), which uses a fan-shaped beam in a spiral progression
through a region of interest acquiring individual image slices that are then stacked to provide
a 3D representation.
The single projection or set of basis images produced as the result of photons being
attenuated by the tissue in the ROI reach the receptor and constitute the “raw data.” During
enough data to be calculated and reconstructed to form a visual image. Complex software
programs with sophisticated algorithms incorporating filtered back projection have been
created to provide primary reconstruction images in three orthogonal planes (axial, sagittal,
and coronal). Custom sections can also be constructed using numerous software programs
available for viewing the images.
Factors Effecting Image Quality and Patient Dose
There are many factors that complement or compromise the final quality of a
radiographic image and the dose of ionizing radiation received by the patient. The end
product is a result of the interplay between a long list of variables that comprise the imaging
protocol. In any form of imaging examination, keeping the patient immobile is essential to
provide data with little or no motion artifacts. CBCT machines are different than MDCT
machines. They are of smaller dimension than MDCT units, which place the patient secured
in a supine position on a specialized exam table that moves through the gantry, and the
design allows the patient to stand or be comfortably seated. A variety of head restraints, chin
rests, and bite indices become critical to stabilize the patient, particularly children and the
disabled, injured, or elderly to minimize movement.
The manner in which the x-rays are delivered to the patient can have a significant
impact on the exposure a patient receives. Delivering the least amount of radiation dose to
the patient is a fundamental tenet of responsible imaging practices. The ALARA (As Low As
Reasonably Achievable) principle has been promoted for many years in the field of
radiology. It essentially dictates that acquisition of the image be performed with appropriate
selection of exposure factors and an imaging protocol that minimizes the dose to the patient
principle has trickled into the mindset of the manufacturers. CBCT machines are being built
with x-ray generation that is pulsed to coincide with detector activation and sampling rather
than generating a continuous beam. This alone will permit up to 50% reduction in exposure
time to the patient, which reduces the radiation dose. More CBCT machines are being
manufactured with this capability, in part, because of the industry response to the initiative to
rein in exposure and harmful effects to patients.
Other factors that affect patient dose are tube current (mA), tube voltage (kVp), and
time (s). These settings are often fixed on CBCT units, but newer technology is also
incorporating scout views and exposure control feedback mechanisms to help limit exposure.
More will be said about this later in the paper.
Scan Volume
Field of view (FOV) and number of basis images need to be taken into account in the
effort to reduce the dose to the patient, particularly children or adolescents, who are much
more susceptible to the stochastic effects of radiation over a lifetime.3 Scan volume or (FOV)
plays pivotal role in determining the amount of radiation delivered. Initially, the CBCT
machines had only one or a few choices available to capture the region of interest, many
times incorporating much more volume of tissue than actually necessary. The more
contemporary machines are being designed with more latitude for both selection of FOV
(small, medium, large, or specific sizes such as 5 x 5 cm, 8 x 8 cm, 6 x 12 cm, 10 x 10 cm,
etc.) and for tube amperage (mA) (i.e., High Definition, Standard, Fast Scan). These
parameters allow refinement and individualization to fulfill the needs of the practitioner and
There are additional components of CBCT that make it unique. Appropriate use of
these functions will assist with compliance of the ALARA principle. These are the selection
of the number of images acquired per second by the detector (frame rate), the arc rotation
(180°–360°), and the rotation speed of the synchronously moving x-ray source and detector.
These factors will determine the number of basis images that will play a role in patient
exposure. Some of the newer CBCT units are configured so a pre-set number of basis images
are obtained based on the type of image requested. There are positive and negative
ramifications to adjustment of these variables. Higher frame rates increase the signal-to-noise
ratio, which produces images with less noise and fewer artifacts. Of course, this comes at a
cost to the patient with more exposure to ionizing radiation. Also, the time necessary for
reconstruction is longer. Decreasing the scan times by increasing the frame rate is more
desirable because it reduces the likelihood of patient movement and the subsequent decrease
of image quality.
Detectors
There are two basic groups of image detectors used by CBCT machines—the older
image intensifier tube/charge-coupled device (II/CCD) and or the newer, more widespread
but expensive flat panel detector (FPD). FPD’s are either direct or indirect detectors. The
direct route uses a photoconductor material, selenium, which is a more efficient absorber of
x-rays. The electrons released are sent “directly” to a thin-film transistor and an electrical
signal is generated. An “indirect” detector uses the scintillating material cesium iodide,
which converts x-ray energy into light. The light energy is converted into electrical energy
are very expensive as they get larger. To keep the cost of the CBCT more manageable, the
FPD will be limited in size.
With CT imaging systems, the x-rays form a stored electronic image that is displayed
as a matrix of intensities. The matrices can be different sizes. Most are 512 x 512, which
represents 262,144 cells of information. Some are 1024 x 1024, which is an incredible
1,048,576 individual cells. Therefore, the detector can have the same physical dimensions but
contain four times the number specific data points that will comprise the image. Generally,
the image produced from more pixels leads to better resolution.
Each cell of information is a 2D pixel (picture element). When multiplied by the
thickness dimension it becomes a 3D voxel (volume element). A unique characteristic of
CBCT is that the voxels are isotropic (each 2D square is the same dimension), unlike the
MDCT, which has anisotropic (unequal sides) voxels. The voxel size is determined by
multiplying the pixel size by the thickness of the CT slice. The precise CT number of any
given pixel is related to the x-ray attenuation coefficient of the tissue contained in the voxel.
For CBCT, each pixel is assigned a brightness number that represents a specific location in
the matrix. MDCT pixels also each contain exclusive information. This data is referred to as
the CT number or Hounsfield unit (HU) (-1000 to +3000). The HU is a discrete value
allowing image quality to be easier to characterize and quantitate. The particular value will
be identical in all MDCT images. There has been an attempt to correlate CBCT brightness
values with Hounsfield units; however, it is controversial has not been shown to be accurate.7
In regards to the relationship between pixel size and exposure, detectors with smaller
this effect and gain higher resolution, greater doses of radiation are necessary. Again, this
demonstrates the compromise between image quality and patient exposure.
Grayscale
Grayscale is the ability of the CBCT image to display subtle contrast differences in
attenuation of the x-ray beam by the detector. This parameter is defined as the bit depth of
the system, which determines the number of shades of gray that can be displayed.
Contemporary CBCT machines use detectors capable of presenting 12 bits or more. For
example, a 12-bit detector is capable of displaying 212,or 4096, shades of gray and a 16-bit
can exhibit 65,536 shades of gray. Interestingly, initial observations proposed that the human
eye could distinguish only 30 to 50 shades of gray.8,9 It is now established that the human eye
can discriminate ‘between 700 and 900 simultaneous shades of gray for the available
luminance range of current medical displays and in optimal conditions.10
Reconstruction
Once information from the basis projection frames has been received by the detector
and sent to the computer, the next process is to create a volumetric data set. This procedure is
referred to as primary reconstruction. As previously stated, a single rotation around the patient (180°–360°) is all that occurs with CBCT and is relatively quick (12–20 sec). What
happens next with this data is quite complex and could not occur until the 1990’s, when
inexpensive, more powerful computers were available to process the massive amount of
acquired image data. For example, approximately 100 to more than 600 individual basis
images, each with more than 1 million pixels and 12 to 16 bits of data assigned, need to be
processed. This presents a colossal task that has to be performed in a matter of seconds and
Reconstruction times vary depending on the acquisition parameters (voxel size, FOV,
and number of projections), the speed of the hardware, and the sophistication of the software.
A series of computationally complex software algorithms process the data and create a
volumetric data set composed of individual cuboidal voxels by a process termed
reconstruction. Subsequently, secondary reconstruction allows sectioning of the volumetric data into orthogonal images (axial, sagittal, and coronal) to finally be visualized on a screen
and evaluated by the clinician.3
Three-Dimensional Volume Rendering
Because CBCT systems have been developed for the maxillofacial region, there has
been an interest in 3D reconstruction. Many devices are capable of large FOV imaging of the
skull.11 Dose measurements in micro-Sieverts (µSv) and time measured in seconds (s) or
milliseconds (ms) have been suggested to be of the same order of magnitude as other dental
radiographic modalities.12 Volume rendering refers to techniques in computer graphics that
are used to project a 3D discretely sampled data set to display a 2D projection. There are two
approaches: Direct Volume Rendering (DVR) and Indirect Volume Rendering (IVR). IVR is
the oldest and requires huge amounts of pre-processing on the dataset. A pre-selection of the
intensity of the grayscale to be displayed throughout the entire dataset is required. This
requires special software and powerful computers that perform complex calculations.
Sensitivity to noise with introduction of errors can be a problem. Ultimately, IVR provides a
volumetric surface rendering with depth, allowing the image to display objects of interest
such as the soft tissue surface, bone, and teeth. This is often referred to as segmentation.
DVR is the most popular and simple method of 3D reconstruction. Maximum
image.13 MIP consists of projecting the voxel with the highest attenuation value along a
straight line on every view traced from the expected position of the operator throughout the
volume onto a 3D image.14 Such an algorithm is rather simple; for each x, y coordinate only
the pixel with the highest CT number along the z-axis is represented. In a bi-dimensional
image all dense structures in a given volume are observed. For example, it is possible to find
all the hyper-dense structures in a volume independent of their position. This method tends to
display bone, a contrast-filled structure, preferentially. Lower attenuation structures are not
well visualized.15 Contrast has not been used in maxillofacial imaging for dental purposes
other than to visualize gland parenchyma in sialography with CBCT. Additional applications
may become available in the future.
Surface rendering using special algorithms has initiated a new application related to
data processing that is being used in dentistry, particularly in orthodontics and oral and
maxillofacial surgery applications. In surface rendering, the voxels located on the edge of a
structure are identified, usually by intensity thresholding, and sometimes enhanced with
morphologic filtering, and these voxels are displayed. The remaining voxels in the image are
usually invisible. The thresholding assignment of the voxels that will be visible is both
critical and sometimes difficult to reproducibly define. If the thresholding process is too
aggressive, actual protruding structures can be lost from view because of partial-volume
effects. If the thresholding process is too lax, non-tissue materials (fluids) can be rendered as
if they were tissue, causing inaccuracies in the image.15 The presence of exo-mass effects
occur when there is a mass outside the FOV. This effect lowers the measured CT number
there are no CT numbers in CBCT, this process can affect the gray value display of bone in
different areas of the volume.45
Accuracy
The institution of maxillofacial CBCT machines provides practitioners with the
ability to easily generate 3D volumetric renderings using relatively inexpensive third-party
computer-based software. This becomes a wonderful picture on the computer screen, but can
the data actually provide useful information that will aid in treatment of patients? One of the
primary questions to answer is: Are the 3D reconstruction images dimensionally accurate
with the original subject, the patient? A great number of researchers set out to determine the
answer and numerous papers were published. The overall consensus indicated that CBCT
measurements could be used for quantitative analysis. The CBCT measurements compared
with the anatomic truth were highly reliable.16,17,18,19
Researchers wrote that “many linear measurements between cephalometric landmarks
on 3D volumetric surface renderings using Dolphin 3D software generated from CBCT
datasets may be statistically significantly different from anatomic dimensions, most can be
considered to be sufficiently clinically accurate for craniofacial analysis.”20 Although there
were errors in the linear measurements, they were often not significant. “For well-defined
points, measurement accuracy was expressed by average errors less than 1.2% for
two-dimensional measurement techniques and less than 0.6% for three-two-dimensional measurement
techniques. Average errors from 0.2 mm to 2.1 mm are in line with errors reported for both
Imaging Protocol
An imaging protocol is a customary set of technical exposure parameters for CBCT
imaging that depend on the particular purpose of the examination. It is developed to provide
images of premium quality with the least amount of radiation exposure to the patient.
Ordinarily, the CBCT manufacturer will have fixed, pre-set protocols that are automatic
based on the imaging field, number of basis images, and voxel resolution.3
Exposure settings of tube voltage (kVp) and tube current (mA) will affect the quality
and quantity of the x-ray beam. The manufacturer most often will have these parameters
fixed as well. In the event that there are operator-adjustable exposure settings, it is mandatory
that the operator have command of the working knowledge of how the image quality and
eventual patient dosage will be impacted by these settings. Because this is often not likely, it
is best that the units have default settings that lead to better compliance with the ALARA
principle.
Image Optimization
Most software programs for CBCT provide the user with resources to adjust contrast,
brightness, and edge sharpening. To aid the system to present the best image to the clinician
and assist with an accurate diagnosis, there are controls available to adjust brightness (level)
and contrast (window) parameters to selectively favor bony tissue. This is analogous to the
window and leveling functions in conventional CT to facilitate viewing a ‘bone window” or a
“soft tissue window.” Unlike conventional CT, there is pronounced variability between
different CBCT units depending on how the machine was manufactured and the proprietary
software pre-set parameters employed. Medical imaging benefits more from increased
processed for visual interpretation, viewers are the ultimate judge of how well a specific
method work.22 Application of sharpening, filtering, and edge algorithms is encouraged. Edge
enhancement is the accentuation of the interface between different tissues. This controls the
extent to which the contrast in the edge detected is enhanced. Subtle detail is not improved
but imperfections from noise, for example, are diminished. Some image data are lost as part
of this process. Edge enhancement is only capable of improving the perceived sharpness of an image.23
Spatial Resolution
The image quality on a medical image is related to how well it reproduces and
represents anatomical or functional information to the interpreting practitioner, allowing an
accurate diagnosis. Radiological images acquired using ionizing radiation can usually be
enhanced by increasing the radiation dose. The dose to the patient then becomes a potential
health safety issue. Therefore, diagnostic radiographic images require a number of important
compromises in which image quality is not completely maximized but is reasonably
optimized to successfully execute the diagnostic assignment ordered.
Spatial resolution designates the level of detail that can be seen by the human eye in
an image. Basically, the limiting spatial resolution relates to how small of an object can be
seen on an individual imaging system. Measurements of spatial resolution are generally
performed at high doses of x-rays, so there is low noise and issues of quantum mottle are
excluded as a reason for poor resolution. The preponderance of imaging systems in radiology
are now digital. The size of the pixel is a limiting factor in an image and establishes a
boundary on what can theoretically be resolved in a particular image. It is typically not
although images with smaller pixels have the potential to convey increased spatial resolution,
there are many additional dynamics that affect spatial resolution. In many cases, it is actually
not the pixel size that limits spatial resolution.2 Additional factors including the number of
basis images, reconstruction algorithm, focal spot size, the fraction of the pixel’s area capable
of collecting light (fill factor), detector motion blur, internal patient scatter, and beam
geometry affect the spatial resolution of an image. The focal spot size and the geometric
configuration of the x-ray source determine the amount of blur or lack of sharpness in the
image. A smaller focal spot leads to less image blur and better spatial resolution. X-ray tubes
that produce smaller focal spots are considerably more expensive and will therefore be
limited to allow the CBCT machine to remain cost effective.3
Image Artifacts of CBCT
An imaging system that perfectly presents the structures within the region of interest
without distortion has not been developed yet. To one degree or another, there are artifacts in
all of the images produced by our radiographic equipment. In general, an “artifact” is “a
distortion or error in an image that is unrelated to the subject being studied.”24 A CT image
artifact is defined as “any discrepancy between the reconstructed CT numbers in the image
and the true attenuation coefficients of the object.”25 This definition is comprehensive and
implies that anything that causes an incorrect measurement of transmission readings by the
detectors will result in an image artifact. Because CT numbers represent gray shades in the
image, incorrect measurements will produce incorrect CT numbers that do not represent the
attenuation coefficients of the object.26 Artifacts can degrade image quality, affect the
perceptibility of detail, or even lead to misdiagnosis. This can cause serious problems for the
CBCT images inherently have more artifacts than MDCT images for a number of
reasons. CBCT machines use a lower energy spectrum, have the cone-beam–shape geometry,
produce aliasing artifacts caused by the cone-beam divergence and scatter, and commonly
contain a higher noise level.
Artifacts can be arranged into categories of inherent artifacts: procedure-related
artifacts, introduced artifacts, and patient motion artifacts. Inherent artifacts are a result of
limitations in the physical processes involved in the acquisition of CBCT data. There are also
three types of cone-beam–related artifacts under this category: scatter, partial volume
averaging, and cone-beam effect.
Scatter is a fundamental phenomenon associated with the interaction between x-ray
photons and matter. Scatter radiation is comprised of photons that have been diffracted from
their original straight-line trajectory by interactions with tissue/material. These photons can
interact, which results in a change in direction multiple times prior to reaching the detector.
Or they may exit the patient and never reach the detector. They provide useless information
and degrade the image quality. Scatter is reduced in MDCT by post-patient collimation
placed in front of the detector and special algorithms. This cannot be done in CBCT because
of the unique pyramidal-shaped beam and the use of area detectors. Scatter increases with
increased field size. Scatter-induced artifacts in CBCT are only slightly diminished using
processing algorithms. The images, therefore, are characterized by a lower signal-to-noise
ratio than MDCT and have poor soft tissue contrast.
Partial-volume averaging is a feature of both MDCT and CBCT. This occurs when
the voxel size of the detector contains two or more tissue types of the subject being imaged.
performed by the computer will then be an average of the CT numbers of the tissue covered
in the voxel. If the CT numbers are close together (i.e., +43 gray matter, +40 blood, and +46
white matter), then the CT number reported for that voxel will be an average that is
reasonably close to the actual tissue. This is known as partial-volume averaging.26 If the
voxel contains tissues that are significantly different (i.e., + 35 muscle, -75 fat, +850 bone)
then the mathematical calculation to determine the single CT number that will represent the
voxel will be significantly different from the actual tissue. This leads to partial-volume
artifacts, which are very inaccurate and appear as bands or streaks in the image.27 Selection of the smallest voxel size will help reduce the presence of these effects. In MDCT, selection
of thinner slices will also diminish these effects.
Cone-beam effect occurs particularly in the peripheral portions of the scan volume.
Because of the divergence of the x-ray beam as it rotates around the patient, structures at the
bottom of the image field are exposed only when the x-ray source is on the opposite side of
the patient.3 The use of a large cone angle can lead to significant artifacts. Some MDCT units
use a small cone-shaped beam as opposed to strictly a fan beam and will also obtain artifacts.
The result is image distortion, streaking artifacts, and greater noise from what amounts to
under-sampling. This effect is minimized by incorporation of various forms of cone-beam
reconstruction by the manufactures.
Procedure-related artifacts are another type of artifact that can follow as a result of the
acquisition process. Under-sampling of the object being imaged can occur when too few
basis images are obtained for image reconstruction or when rotation trajectory arcs are
insufficient. The reduced data sample leads to mis-registration, sharp edges, and noisier
occurs when too great an interval between basis projections (under-sampling) or an
incomplete scanning trajectory results in improper recording of data by the reconstruction
software. On the CBCT image, particularly on the periphery, fine alternating hyper-dense
and hypo-dense stripes appear to be radiating from the edge of the volumetric data. This can
be reduced by increasing the number of basis images. However, the dose to the patient
becomes greater so a compromise much be reached.
Scanner-related artifacts appear as circular or ring streaks resulting from deficiencies
in scanner detection or poor calibration. Both of these problems result in a consistently
repetitive reading at each angular position of the detector, resulting in a circular artifact.
Misalignment of the x-ray source to the detector creates a double contour artifact,
similar to that created by patient motion. Repeated use of CBCT equipment over time may
result in slight configuration changes, and components may need to be periodically
realigned.3
Noise-induced artifacts are an important issue when selecting the exposure
techniques. Noise is influenced partially by the number of photons that strike the detector.
More photons mean less noise and a stronger detector signal, whereas fewer photons result in
more noise and a lower detector signal. One can be over-judicious with trying to deliver the
least amount of radiation possible and actually cause photon starvation. Photon starvation can
ensue with poor patient positioning in the FOV, causing the object to be improperly scanned.
Also, unsuitable selection of exposure factors (kVp, mA, time), scan speed, and inadequate
Introduced Artifacts
When an x-ray beam passes through an object being imaged, the lower energy
photons are preferentially absorbed by the material and the higher energy rays pass through
the substance to the detector. This phenomenon is referred to as beam hardening. Standard
filtered-back projection reconstruction algorithms do not fully address the polyenergetic
nature of the x-ray spectrum used in CT. X-rays that pass through a large amount of dense
tissue, such as the petrous portion of the temporal bone, teeth, etc., have a high degree of
attenuation and cause the x-ray beam to become “hardened.” A hard x-ray beam refers to a
beam whose average spectrum of energies is higher than the original beam when it left the
source prior to interacting with the patient. The presence of dense (higher z) structures such
as bone in the x-ray path cause the lower energy portion of the beam to be preferentially
attenuated compared to the higher energy photons. The beam undergoes an upward shift in
average x-ray energy as it passes through more dense material like bone.2
To reduce some of the beam hardening effects in CT, the beam can be pre-hardened
by adding a filter comprised of thicknesses of aluminum, for example. However, beam
hardening can still occur, especially when dense structures such as metal exist in the field.
The x-ray beam that corresponds to the path that intersects the metal becomes exceptionally
hardened and appears as a streak in the image. The dark, angular artifacts that result appear
as webbing due to the CT scan geometry. Metallic restorations in teeth, dental implants,
metal surgical clips, titanium reconstruction plates, and bullet fragments will all cause streak
artifacts to a certain degree. In clinical practice, methods to lessen streak artifacts would be to
reduce the field size, modify patient position, and separate the dental arches to avoid
remove any jewelry prior to scanning to eliminate overlay of the object over the desired
anatomy of interest and also to reduce peripheral beam hardening effects and scatter
superimposed on the region of interest.3
Strengths and Limitations of CBCT
Many of the qualities of CBCT that have been mentioned make CBCT a very suitable
imaging system over conventional CT for routine usage in the dental office. There are also
limitations to its use. CBCT offers significantly reduced physical dimensions compared to
conventional CT and a cost that is approximately one-fifth the price.3
CBCT offers fast acquisition with utilization of advanced solid-state detectors and
fast frame rates, increased computer processing speed, and many units integrating reduced
arc trajectory. The majority of CBCT scanning can be performed in 30 seconds or less.3
All CBCT machines presently use megapixel solid-state equipment for x-ray
detection, which provide sub-millimeter voxel resolution in all orthogonal planes. There are a
few CBCT units capable of high resolution imaging (.076–0.125 mm voxel resolution),
which is necessary to distinguish fine detail in structures such as root canal morphology or
root fractures in dentistry.3
Relatively Low Patient Radiation Dose
As was previously discussed, the ultimate radiation dose delivered to the patient is of
utmost importance. Published reports indicate that the effective dose (ICRP 2007) for various
CBCT machines ranges from 25 to 1025 µSv, depending on the manufacturer, model, FOV,
and imaging protocol employed. These readings are approximately equal to 1 to 42 digital
dental panoramic radiographs (~24 µSv) or 3 to 123 days’ equivalent per capita natural
by beam collimation, number of basis images, exposure factors, and protective shielding.
CBCT imaging affords a breadth of patient dose reduction compared with head MDCT
imaging, which can be in the range of 430 to 1160 µSv.3
Interactive Analysis
CBCT use is not only very easy for a clinical office environment, it is also very user
friendly to view and analyze the images. Data reconstruction and viewing is performed via a
personal computer. Furthermore, some manufactures provide in-depth software that allows
for specific tasks and cursor driven measurements for determining accurate positioning and
precise dimensions for dental implant placement, bone grafting, orthodontic work-up and
mid-treatment analysis, endodontic procedures, and oral surgical requirements. The locations
and sites can be annotated and labeled for future reference and discussion with patients and
other practitioners.
Limitations
With any radiographic imaging system there are limitations. None of the devices are
perfect. The cone-beam projection acquisition geometry leads to a large volume of tissue
being irradiated with each basis image. A large portion of the photons undergo Compton
interactions and produce scattering. The scattered radiation occurs in all directions and can
exit the patient or reach the pixels in the area detector from a pathway unrelated to the
direction the photon was originally traveling. Many of the photons have enough energy to
permit them to be scattered many times by multiple atoms. Ultimately, this results in
information generated in the pixel that is useless because it does not correlate with a
number or value has been adulterated by this process and is useless information, referred to
as noise.29
There are three major sources that contribute to noise in an image. The first source is
the quantum noise determined by the x-ray flux or the number of detected x-ray photons. It is
influenced by the scanning techniques (i.e., x-ray tube voltage, tube current, slice thickness,
and scan speed), the scanner efficiency (e.g., detector quantum efficiency), and the patient
(e.g., patient size, amount of bone and soft tissue in the scanning plane). The scanning
technique dictates the number of photons that reach the patient, and the scanner efficiency
determines the percentage of the x-ray photons exiting the patient converted to useful
signals.26 Also, because of the enlarged divergence of the x-ray beam over the area detector,
there is a pronounced heel effect. The x-rays that constitute the useful beam emitted toward the anode side must traverse a greater thickness of target material than the x-rays emitted
toward the cathode direction. The intensity of x-rays that are emitted through the “heel” of
the target is reduced because they have a longer path through the target and therefore
increased absorption. The difference in radiation intensity across the width of the useful
beam of an x-ray field vary as much as 45%.1
The second source that influences the noise performance is the inherent physical
limitations of the system. These include the electronic noise in the detector photodiode, the
electronic noise in the data acquisition system, scatter radiation, and other factors beyond the
scope of this paper. Electronic noise is due to the inherent degradations of the detector
Reconstruction Algorithms
The third noise-influencing factor is the reconstruction parameters. Image
reconstruction in CT is a mathematical process that generates images from x-ray projection
data acquired at many different angles around the patient. Image reconstruction has a
fundamental impact on image quality and therefore on radiation dose. For a given radiation
dose, it is desirable to reconstruct images with the lowest possible noise without sacrificing
image accuracy and spatial resolution. Reconstructions that improve image quality can be
translated into a reduction of radiation dose because images of acceptable quality can be
reconstructed at a lower dose.30
Two major categories of methods of image reconstruction exist, analytical and
iterative reconstruction. Methods based on filtered-back projection (FBP) are one type of
analytical reconstruction that is currently widely used on clinical CT scanners because of
their computational efficiency and numerical stability.31
Iteration is defined as a computational process in which a series of operations is
repeated until a condition is met.31 Iterative reconstruction offers the ability to minimize
radiation exposure while preserving and, in some cases, improving image quality. When CT
was developed by Godfrey Hounsfield in the 1970’s, the original reconstruction algorithm he
employed was iterative reconstruction (IR), where the software builds and then revises with
hundreds of reiterations to enhance image quality. Computer speeds in the 1970’s were so
slow, it took about 45 minutes to reconstruct one slice using the IR method. The computer
would work all night to have a rudimentary-quality image ready for viewing the following
adopted that could process slices in 30 seconds. This software and the incremental
improvements made to it have been the backbone of CT imaging for more than 30 years.32
“You can get a fast answer to the problem of how to take all those inputs into the
detector and create an image from them. The problem with filtered back projection is that it
tends to have relatively high noise and relatively high dose,” said Jeffrey B. Mendel, MD,
staff radiologist, radiation safety officer, Parkland Medical Center, Derry, NH, and assistant
professor of radiology, Tufts University School of Medicine. Mendel is an expert on CT
reconstruction software. He said FBP either offers high spatial resolution or high contrast
resolution, but it cannot do both at the same time. However, IR does offer this ability and can
do so at a lower dose.46
As computing power and speeds rose exponentially in the 1990s and 2000s, IR saw a
revival, especially in its ability to enhance image quality for lower-dose scans. Lowering CT
dose became a major issue in recent years after mass media reports of patients receiving
radiation burns from newer CT scanners. “Here’s the bottom line: radiation is scary and it is
certainly very scary to the general public,” Mendel said. “The big driver to adopt iterative
reconstruction is that we can reduce dose.”46
With IR, the data is processed in a continuous loop where calculations are performed
to create the different images. Projection data is then processed and compared to assumed
ideal models over and over to improve the image voxel-by-voxel.
“Iterative reconstruction solves the equation for each voxel in the image,” Mendel
said. “It’s a slow, complex calculation, but it offers both low noise and dose, and the ability
The technique also creates its own set of image artifacts. Images can appear plastic
because of the absence of noise, edges are artificially sharper, and the tissue appears to be
smudged or smoothed. IR can also cause blotchy pattern artifacts inside the borders of
organs. To reduce the time required to reconstruct IR images and to reduce these artifacts, all
current IR software programs use a blend of FBP and IR techniques.
The downside of IR software is that each vendor offers their own version. They can
be slightly different and have their own strengths and limitations. The software is also
extraordinarily expensive and would add a significant cost to the imaging machine.32
Users of clinical CT scanners usually have very limited control over the inner
workings of the reconstruction method and are confined principally to adjusting various
parameters specific to different clinical applications. The reconstruction kernel, also referred
to as the “filter” or “algorithm” by some CT vendors, is one of the most important parameters
that affect the image quality. Generally speaking, there is a trade-off between spatial
resolution and noise for each algorithm. A smooth algorithm generates images with lower
noise but with reduced spatial resolution. A sharp algorithm generates images with higher
spatial resolution but increases the image noise.30
Poor Soft Tissue Contrast
The characteristic of CBCT that has most limited its use is the poor soft tissue
contrast. This is due to the intrinsic properties of the acquisition parameters. As previously
discussed, the pyramidal or cone-beam shape of the x-ray beam results in the development of
a significant amount of noise, which dramatically decreases the contrast resolution of the
image. Contrast resolution is the ability of an image to reveal subtle differences in image
tissues that differ in density, atomic number, or thickness. Two principle factors limit the
contrast resolution of CBCT. First, although scattered photons contribute to increased noise
of the image, it is also a substantial factor in reducing the contrast of the cone-beam system.
Scattered x-ray photons reduce subject contrast by adding background signals that are not
representative of the anatomy, reducing image quality. CBCT units have noticeably less soft
tissue contrast than MDCT units.
Second, there are numerous inherent FPD-based artifacts that affect linearity or
response to x radiation. Saturation (nonlinear pixel effects above a certain exposure), dark
current (charge that accumulates over time with or without exposure), and bad pixels (pixels
that do not react to exposure) contribute to nonlinearity. In addition, the sensitivity of
different regions of the panel to radiation (pixel-to-pixel gain variation) may not be uniform
over the entire region.29
CBCT in Dentistry
Since CBCT devices were introduced commercially in the United States in 2001,
dentists have come to use the technology in increasing numbers. Yet, although CBCT
technologies have advanced rapidly over time, concerns have been expressed about whether
the information acquired with CBCT imaging warrants the additional exposure risk, as well
as about the level of training, education, and experience required to interpret the CBCT data
set.33 To provide guidance on CBCT imaging, national and international groups have
prepared basic principles, position statements, and professional guidelines for CBCT use.
These include the American Academy of Oral and Maxillofacial Radiology’s Academy of Oral and Maxillofacial Radiology executive opinion statement on performing and
Dental and Maxillofacial Radiology’s Basic principles for use of dental cone beam computed tomography: consensus guidelines of the European Academy of Dental and Maxillofacial
Radiology, 2009; the Academy of Osseointegration’s 2010 Guidelines of the Academy of Osseointegration for the provision of dental implants and the associated patient care, 2010;
The SEDENTEXCT Project’s Radiation Protection: Cone Beam CT for Dental and Maxillofacial Radiology: Evidence Based Guidelines 2011; the Joint Position Statement of the American Association of Endodontists and the American Academy of Oral and
Maxillofacial Radiology’s Use of cone-beam computed tomography in endodontics, 2012the American Dental Association Council on Scientific Affairs’ advisory statement, The use of
cone-beam computed tomography in dentistry, 2012; and the Joint Position Statement by the American Association of Orthodontists and the American Academy of Oral and
Maxillofacial Radiologists, Clinical Recommendations for the Appropriate use of Cone Beam
Computed Tomography (CBCT) in Orthodontics, 2012.
“In the field of Dentistry CBCT has been researched in the application of the following: Three-dimensional measurements and dental implant planning, assessment of craniofacial structures for patients undergoing orthognathic surgery, three-dimensional imaging in cleft lip and palate patients, diagnostic evaluation of osseous abnormalities of the mandibular condyle, detection and operative planning for mandibular osteomyelitis, assessment of bone quality, surface and volume rendering of facial structures, assessment of
morphological temporomandibular joint changes, determination of osseous lesion size and volume, analysis of the internal structure of tumors,
initial and long-term costs of CBCT over conventional CT it is believed by the authors that the demand for CBCT will increase in the field of maxillofacial imaging.” 34
The authors of the above referenced statement did not specifically mention CBCT in
orthodontics. However, the field of orthodontics has seen tremendous growth in the use of
CBCT for obtaining pre-treatment records, establishment of treatment plans, and
mid-treatment evaluation.35 In addition, CBCT is used in orthodontics for determination of
appropriate sites for mini-screws, palatal bone thickness, cephalometry, assessment of tooth
position or inclination, assessment of rapid palatal expansion, determination of skeletal age
based on cervical vertebrae morphology, and 3D evaluation of upper airway anatomy in
adolescents.36 The use of CBCT in dentistry, and particularly orthodontics, is not without
controversy, mainly because the majority of the patient population undergoing orthodontic
treatment is in the pediatric to adolescent age group. It is well known that children have a
significantly elevated risk of untoward side effects, namely a lifetime risk of cancer, when
exposed to radiation.37
There are two types of effects on tissue caused by radiation. If cellular damage occurs
as a result of radiation and it is not adequately repaired, it may prevent the cell from
surviving or reproducing or it may result in a viable cell that has been modified (suffered a
change or mutation). The two scenarios have profoundly different outcomes for the patient.
Deterministic effects occur when there is significant damage to the cell or tissue resulting in loss of function. Above a certain dose, the threshold dose, the probability of manifestation
increases swiftly to 100%. The severity and occurrence increase with dose (e.g., cataract,
tissue fibrosis). The probability of such harm is zero at small radiation doses observed in
The consequence is very different if the irradiated cell remains viable but has been
altered. Carcinogenesis and heritable effects fall into this category. When somatic cells are
exposed to radiation, the probability of cancer rises with dose, most likely with no threshold,
as in the deterministic response. However, the severity of the cancer is not dose related. This
category is referred to as stochastic effects. If the radiation occurs to a germ cell, mutations could result that could have harmful effects in future generations. It is also believed that there
is probably no threshold and the severity of heritable effects is not dose-related, just hat the
probability increases with dose.38 The belief that stochastic effects have no dose threshold is
based on the molecular mechanisms involved. There is reason to believe that even a single
x-ray photon could result in a base change, leading to a mutation that could cause cancer or a
heritable defect. This concept is also referred to as the Linear No-Threshold (LNT) risk
assessment model that any amount of radiation exposure may lead to cancer in a population.
Based on the LNT model, risk from low-dose radiation increases linearly with increasing
doses of radiation. It is thought that extrapolating the linear graph into the very-low-dose
range is also accurate. For this reason, it is considered sensible and conservative to assume
that no dose is too small to be effective, although this can never be proved.38
Cancer induction is the most important somatic effect of low-dose ionizing radiation.
There is a long history of a link between radiation exposure and an elevated incidence of
cancer. Many reports have been made but the most recent and significant example of human
experience with radiation-induced cancer includes the Japanese survivors of the atomic bomb
attacks. This is the most important single group studied because of their large number, the
care with which they have been followed, and the fact that people of all ages and both sexes
Irradiation of Children
The hazards associated with medical radiation in children are basically the same as in
adults, cancer and heritable effects. However, the risks associated with a given absorbed dose
of radiation are higher because of an increased sensitivity in younger people. This was
evident in the survivors of the of the Japanese atomic bomb attack (Life Span Study, LSS,
Radiation Effects Research Foundation, RERF). There is a noticeable alteration in sensitivity
to radiation-induced malignancies with increasing age, with young children being more
radiosensitive than older adults by a factor of 10-15. Concern for possible heritable effects
induced by radiation is similarly greater in children because they have their entire
reproductive life ahead of them.38
With radiation-induced cancer, there is a latent period between irradiation and the
appearance of the malignancy. There is also a difference in the type of cancer that develops.
Leukemia has the shortest latent period. Excess cases began to appear in the survivors of the
Japanese atomic bomb attack and reached a peak in 5-7 years and extended to about 15 years.
Solid tumors, on the other hand, show a longer latency and extend from 10 to about 60 years
out from the time of irradiation.38
The Position Statement by the American Academy of Oral and Maxillofacial
Radiologists, 2012, outlined a series of
“general recommendations and specific criteria for the use of CBCT based on specific clinical scenarios and most appropriate scan field of view.”… “Dose minimization and professional use strategies are provided. The use of CBCT must be justified based on individual clinical presentation and is not
appropriate for routine diagnostic use nor as a substitute for non-ionizing radiation techniques to record the dentition or maxillofacial complex.”40
The issue of dose was also addressed in the Position Statement. “The recent results of
between exposure to radiation from computed tomography (CT) and cancer risk in
children.”40 They found that “children and young adults who received radiation doses from
the equivalent of 2 or 3 CT scans of the head have almost triple the risk of developing
leukemia or brain cancer later in life. Medical CT scans may have an effective dose of up to
2000 µSv,”41 “However, substantial reductions to less than 1,000 µSv have been reported for
low dose protocol CT examinations.”12, 42 “Most CBCT examinations are reported to impart a
fraction of medical CT effective dose, however, doses vary considerably between CBCT
units.”40
“The actual risk of cancer induction for low dose radiographic procedures currently
considered to be below about 100,000 μSv, including as maxillofacial CBCT, is difficult to
assess. Radiation epidemiologists and radiobiologists internationally are in consensus that for
stochastic risks such as carcinogenesis, from a radiation safety perspective, the risk should be
considered to be linearly related to dose, all the way down to the lowest doses.”43
In this paper, the AAOMR Task Force Committee reviewed information on the
potential health effects of exposure to diagnostic ionizing radiation. There is neither
convincing evidence for carcinogenesis at the level of dental exposures nor the absence of
suchdamage. This situation is unlikely to change in the foreseeable future. In the absence of
evidence of a threshold dose, it is prudent to assume that such a risk exists. This implies that
there is no safe limit, or safety zone, for ionizing radiation exposure in diagnostic imaging.
Every exposure cumulatively increases the risk of cancer induction. Consequently, to be
cautious, the Committee’s recommendations are focused on minimizing or eliminating
The release of the Position Statement by the AOAOMR was followed quickly by
responses that were not in agreement with the recommendations in the document. Mah, et al.
responded with an article in Orthodontic News that was highly critical and stated, “The AAO/AAOMR draft document is lacking in many respects related to objectivity, balance, failure to apply the available evidence, and flawed recommendations. As is, it may be impossible for AAO members to follow the guidelines and may put them, their practices, and the AAO in difficult, if not impossible, situations.”44
The use of CBCT in dentistry shows no sign of decelerating. More and more uses will
be found. Manufacturers of CBCT machines will continue to respond to the increasing
demand by offering units that will satisfy the needs of practitioners and their patients.
Computers, detectors, monitors, and software algorithms will all continue undergo
technological advancements. It is an important public health issue that ALARA will continue
to be respected and the dose received by patients reduced while the benefits of the
References
1. Bushong SC, Radiologic Science for Technologists: Physics, Biology, and Protection, 9th ed, ch. 28, p. 7, 2008
2. Bushberg JT, Seibert JA, Leidholdt Jr EM, Boone JM, The Essential Physics of Medical Imaging, 3rd ed, ch. 1, 2012
3. White SC, Pharoah MJ, Oral Radiology: Principles and Interpretation, 7th edition, 2013
4. Cho PS, Johnson RH, Griffin TW. Cone-beam CT for radiotherapy applications. Phys Med Biol 1995;40: 1863–83.
5. Ning R, Chen B. Cone beam volume CT mammographic imaging: feasibility study. In: Antonuk LE, Yaffe MJ, editors. Medical imaging 2001: physics of medical imaging proceedings of SPIE. vol. 4320. San Diego (CA): CA SPIE; 2001. p. 655– 64.
6. Iola AA, Metz CT, Schaap M, Klein S, Grass M, Niessen WJ, “Cardiac motion-corrected iterative cone-beam CT reconstruction using a semi-automatic minimum cost path-based coronary centerline extraction. Comput Med Imaging Graph. 2012 Apr; 36(3):215-26.
7. Ping HS, Kandaiya S. The influence of the patient size and geometry on cone beam-computed tomography Hounsfield unit. J Med Phys 2012;37:155-8
8. Berg E. Forensic image processing. Digital imaging: An introduction to image enhancement 1996. Available from: http://www.imagingforensics.com/forensic.pdf. [Last accessed on 2007 Sep 1]
9. Fukui Y. Human eyes as an image sensor. Available from:
http://faculty-web.at.northwestern.edu/med/fukui/Human%20eye.pdf. [Last accessed on 2007 Apr 15].
10. Kimpe T, Tuytschaever T. Increasing the number of gray shades in medical display systems: How much is enough? J Digit Imaging. Dec 2007;20(4):422-432
11. Sukovic P. CBCT in Craniofacial Imaging. Orthod Craniofac Res. 2003;6 (suppl 1):31-36
12. Ludlow JB, Davies-Ludlow LE, Brooks SL, Howerton WB Dosimetry of 3 cbct devices for oral and maxillofacial radiology: CB Mercuray, Newtom 3G and i-CAT, Dentomaxillofac Radiol, 2006;35:219-26
14. Perandini S, Faccioloi N, Zaccarella A, The diagnostic contribution of CT volumetric rendering techniques in routine practice. Indian J Radiol Imaging. 2010;20 (2):92-7
15. Cody D, AAPM/RSNA Physics Tutorial for Residents:Topics in CT, RSNA Radiographics, 2002, 22:5
16. Koybayashi K et al, Accuracy in measurement of distance using CBCT, Inter J of Oral and Maxillofac Impl, vol 19, 2 March 2004 pp228-31.
17. Kumar V, Ludlow JB, Mol A, Cevidanes L, Comparison of conventional and cone beam CT synthesized cephalogramsDentomaxillofac Radiol, 36 (2007), pp. 263–269
18. Loubele M, Assche N, Carpentier K, Maes F,Jacobs R, Steenberghe DV, Suetens P, Comparative localized linear accuracy of small-field cone-beam CT and multislice CT for alveolar bone measurements,Oral Surg Oral Med Oral Pathol Oral Radiol Endod, 105 (2008), pp. 512–518
19. Moshiri M, Scarfe SC, Hilgers ML, Scheetz JP, Silveira AM, Farman AG, Accuracy of linear measurements from imaging plate and lateral cephalometric images derived from cone-beam computed tomography,Am J Orthod Dentofacial Orthop, 132 (2007), pp. 550–560
20. Periago D, Scarfe W, Moshiri M, Sheetz, Linear Accuracy and Reliability of cone Beam CT Derived 3-Dimensional Images Constructed Using an Orthodontic
Volumetric Rendering Program, Angle Orthodontist, vol. 78, No 3, 2008, pp387-95
21. Ludlow JB, Laster WS, See M, Bailey LJ, Hershey HG, Accuracy of measurements of mandibular anatomy in cone beam computed tomography images,Oral Surg Oral Med Oral Pathol Oral Radiol Endod, 103 (2007), pp. 534–542
22. Saleh H, Improving Diagnostic Viewing of Medical Images using Enhancement algorithms, Journal of Computer Science, 7 (12): 1831-38, 2011
23. Yin, L, Scalable edge enhancement with automatic optimization for digital radiographic images, Pattern Recognition, Vol. 37, (7) July 2004, pp1407-22
24. Morgan CL, Basic Principles of Computed Tomograpohy, 1983, Univ Park Press
25. Hsieh J, Image Artifacts, causes and correction, Medical CT current technology and applications, College Park ,Maryland, 1995 American Association of Physics in Medicine.
26. Seeram E, Computed Tomography, Physical Principles, Clinical Applications, and Quality Control, 3rd Ed, 2009.