U
UNTIL THE 1990S, TECHNOLOGICAL BREAKTHROUGHS IN THE AUTOMATION OF electric distribution systems were slow to materialize. Early SCADA (supervisory control and data acquisition) systems promised to improve reliability. But many of the early systems were little more than an extension of SCADA beyond the substation fence. With their relatively low computational and communication capabilities, these early systems required a high degree of human intervention and offered little in the way of true automation. As a result, expectations were not always met, leading to the termination or scaling back of many projects.Nevertheless, many lessons were learned and technology has advanced, especially through the 1990s and to the present. More advanced automation applications have been developed that are far more practical and manageable for utilities to implement.
Technology continues to create an environment of ever-increasing expectations for reliability on the part of electric system users. The advent of widespread Internet access allows people to realistically telecommute. They can live in more rural areas where power reliability is often lower than in urban settings. And the expanded use of sensitive computing technology, both in the home and in industry, requires increasingly more reliable power.
Deregulation was a sea change for electric utilities. It resulted in rampant cost cutting, including early retirement programs, layoffs, cutbacks, hiring freezes, and other euphemisms for reducing headcount. Along with the reduced headcount came a loss of experience in run-ning electric utility systems. The engineers who were left to run the system are now nearing retirement age, and utilities now face a crisis of experience. Although hiring is currently in vogue, will it be enough?
Fortunately, the new generation of utility engineers and personnel were brought up on PCs and PDAs and are well poised to make full use of advancements in feeder automation (FA) tech-nology. They can consider the use of high-speed, small-scale computing and high bandwidth— the 1981 engineer could only dream of such sophisticated communication technology.
Why Automate?
Before considering the “how,” a review of why one might wish to automate their distribution feeder sys-tem is in order. The reasons cited for implementation of distribution automation are varied. Significant reli-ability improvement is the number one reason offered. Reduction of SAIDI (system average interruption dura-tion index) is a key driver. In some states, the public utility commission has mandated performance improvements, either through direct mandate or through performance incentives (or penalties).
Most importantly, when a decision to improve reliability has been made, then the evaluation of relative costs to reduce SAIDI shows that feed-er automation is the least costly and almost always the quickest route to achieving that goal. Fig-ure 1 illustrates how a typical outage restoration scenario might progress both with and without advanced feeder automation. The times shown will be extended even further during storm con-ditions when dispatchers are juggling multiple outage investigations.
When automation using distributed intelligence is applied on distribution feeders, restoration of unfaulted segments occurs in less than one minute. And the more the feeder is segmented with automated switches, the more SAIDI improvement can be realized.
It is easy to justify automation when the public utility commission is mandating reliability improvements, especially when monetary penalties and rewards are in play. Plus, there is bound to be some savings in labor as shown above; however, other, softer costs and benefits also apply. Offering excellent service is an oft-cited reason. And energy users do take notice when the lights go out over and over. Maintaining a good reliability record is also cited as important when
A Look at the
Applications for
Distribution
Automation
© DIGIT AL VISIONseeking rate relief; the theory is that “no news is good news,” and regulators who don’t hear negative comments from their constituents are more likely to be sympathetic to a request for a rate increase.
Still, other utilities see good reliability statistics as an element that can attract new business and new energy sales to the territory. A key benefit of attracting new business is that it also tends to bring new jobs to the area, hence increased tax revenue to the local government.
Advanced feeder automation is also a viable tool for wringing the maximum out of feeder assets. Many utilities already have some sort of distribution automation scheme utilizing looped circuits to provide backup in the event of a fault on a part of the loop. But the current allowed to flow in each half of the loop is typically limited to 50% of its capacity to allow the circuit to pick up faulted segments of another circuit.
If one measures load on various points along the feeder on a continuous basis, it is possible to compare real-time loading prior to a fault against stored capacity values and decide, based on the result, whether to pick up load or not. Such a process permits the utility planner to allow the load to rise to 75% or greater on a feeder, without risking costly feeder damage due to overloading. Also, ties to multiple circuits can significantly enhance the chances of getting the lights back on for any given situation. But, manually performing com-plex circuit-restoration switching without overloading the line takes time. The answer is to use distributed intelligence and automated switching to accomplish the task quickly, accurately, and flexibly. In fact, circuits that the planner
for-merly could not tie can now be tied, resulting in higher relia-bility and greater asset utilization.
In the end, the justification will be unique to each utility, depending upon the balance of local reliability drivers, the cost to implement changes, and external influences.
Feeder Automation Tools
Some tools for feeder automation have been available for many years. S&C Electric Company introduced medium-voltage automatic source-transfer switchgear in the 1960s. Such gear is not typically considered “automation,” but it does restore power without human intervention, so technically it qualifies.
Reclosers and breakers have also been used on electric distribution systems for many years and are yet another form of automated fault isolation. One could even say that fuses are an automated device. After all, they respond to specific currents and interrupt them to clear faults.
So it seems that virtually every electric distribution system has some form of automation implemented (if one stretches the common definition a bit). The move to more advanced forms of feeder automation only requires one to consider it an improvement of the existing technology rather than the adop-tion of a completely “new” technology.
The Future Is Now
In 2003, the IntelliTEAM II Automatic Restoration System was introduced by S&C Electric Company. IntelliTEAM II is a patented automatic power restoration system that uses dis-tributed intelligence and peer-to-peer communication to switch and isolate the faulted line section and restore power to unfaulted line sections.
IntelliTEAM II utilizes ties to multiple circuits, enabling a wide variety of circuit configurations to maximize the restoration potential. Distributed intelligence prevents line overloads. IntelliTEAM II can automate parts of a circuit in need of attention or an entire distribution system consisting of open-loop feeders with multiple tie points to other feeders. It can be used both tactically and strategically, based on the reli-ability problems the utility needs to solve.
IntelliTEAM II Theory of Operation
IntelliTEAM II dynamically tracks system conditions on overhead and underground distribution systems and provides fully automatic fault isolation and service restoration.
“Team” and “coach” metaphors help to describe Intelli-TEAM II operation. Each team is defined as a line segment bounded by two to eight automated switches, each of which can represent a different power source. Each team has a soft-ware coach.
If an outage or line fault occurs, local control logic deter-mines if a switch should open. The coach of each affected team then uses real-time data, including voltage and current data gathered prior to the system event to develop a restora-tion strategy for unfaulted secrestora-tions. The coaches of adjacent figure 1.Outage restoration without and with advanced
feeder automation. Return to Normal Without Automation Crew Travel Time 20–30 min Find the Fault
15–25 min Manual Switching 10–15 min Fault Repair 1–5 h 5–10 min 50–80 min Fault Occurs Customer Reports Outage Crew Dispatched Crew Dispatched Customers on Unfaulted Segments Restored Fault Repair 1–5 h Find the Fault
5–10 min Crew Travel Time 20–30 min 2–5 min With Automation < 1 min
teams then work together through shared controls to imple-ment strategies that will maximize restoration of the circuit within the prioritization rules defined by the user.
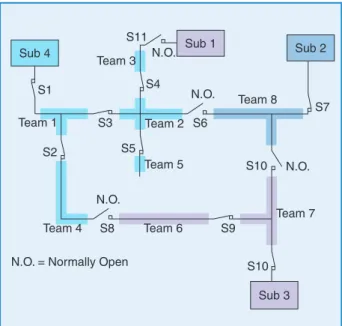
Breakers and reclosers can also be incorporated as team members with the addition of a module that interfaces to the electronic relay or control that operates the breaker or recloser. Figure 2 illustrates the team concept.
The coach distributes data and coordinates the operation of automated switches, reclosers, and breakers. In the event of a loss of communication, service restoration may be inhibited, but an automated switch, recloser, or breaker can still isolate a fault based on local fault detection and isolation software logic. At the beginning of a fault or outage event, any team mem-ber detecting the event will communicate to all the other team members and the coach, reporting the time, type of event, report identification, and so on. The coach also monitors the status of each device, ensuring that all are in the right open or closed position to allow progress to the next restoration step.
In order to close a switch, the coaches of adjacent teams must grant permission based on circuit conditions, location of fault, and an evaluation of loading conditions. When all appropriate conditions are met, the switch can be closed to restore service to a feeder segment. This process is repeated for each segment in turn. As switches close, the IntelliTEAM II system updates available capacity on the feeders used to restore service, ensuring maximum service restoration even at maximum peak load.
IntelliTEAM II distributed control algorithms can address multiple contingencies. If a team is in the reconfigured state and the alternate source experiences a new event, the team can look for a new alternate source, if available, to supply its line segment. As long as an alternate is availble, some amount of service can be restored.
A large IntelliTEAM II system may have reconfigurations occurring simultaneously at more than one location. To pre-vent circuit overloading, the restoration logic has an additional option to use contracts to ensure that it will not pick up more line segments than the circuit can supply. Contracts are nego-tiated across several teams to safely secure resources needed to energize the line segment.
Following a reconfiguration event, and subsequent repair and restoration of the faulted line section, team members can return to their normal state. Once the “return to normal” is initiated, the coaches begin the process of returning each team to its normal configuration. The return-to-normal process begins at the team closest to the normal source and
works outward, using either an open or closed transition approach as defined by the user.
To support the distributed control architecture of IntelliTEAM II, a peer-to-peer wide-area communication network is essential. There are only a few commercially available wide-area communication systems that readily sup-port such a network. Typically, communication for the IntelliTEAM II system is provided by 900-MHz UtiliNet spread-spectrum radios. The UtiliNet radio system transports data using a connectionless mesh architecture. This architec-ture allows each radio in the network to act as both a repeater radio and a data transceiver for an automated switch. The radio network is highly scalable and obviates the need to invest in the tall master radio towers prevalent in point-to-multipoint radio networks.
Fiber-optic networks have also been utilized for high-speed peer-to-peer communication, typically in underground applications where fiber is installed along with the under-ground cable infrastructure.
Is This Real?
Since IntelliTEAM II was introduced in 2003, several utilities in North America have undertaken strategic implementations to automate their entire distribution system. Others have
figure 2.An example of IntelliTEAM II used to automate four open-loop distribution circuits.
Sub 4 Sub 1 Sub 2
Sub 3 S1 S2 S3 S5 S10 S4 S6 S7 S8 S9 S10 S11 Team 1 Team 2 Team 3 Team 7 Team 8 Team 5 Team 6 Team 4 N.O. N.O. N.O. N.O.
N.O. = Normally Open
It is easy to justify automation when the public utility commission is
mandating reliability improvements, especially when monetary
penalties and rewards are in play.
taken a more tactical approach. All have reaped immediate and significant benefits.
The Need for Speed
ENMAX Power Corporation (Calgary, Alberta, Canada) has embarked on a multiyear project to improve the reliability of their distribution system. They are continuing the deployment of an advanced FA system on their least-reliable circuits to automatically isolate faults and restore power to unfaulted segments and to provide restoration quickly, despite the com-plex nature of the circuit interconnections. Ultimately, ENMAX envisions automating 80 circuits on their distribution system.
When integrating the IntelliTEAM II system into the existing ENMAX SCADA network, efforts were made to make use of the existing infrastructure where possible and to minimize the requirement for new infrastructure.
The ENMAX system utilizes a UtiliNet radio network to provide both peer-to-peer interswitch communication as well as remote SCADA functionality from the ENMAX control center. SCADA information from the switch controllers is collected by UtiliNet head-end radios located at the originat-ing substations of the automated feeders. From there, the SCADA information is transferred to the ENMAX broad-band fiber-optic network. At the control center, the data pass-es through a firewall and is concentrated in the S&C Proxy Server. The proxy server makes the data available
simultane-ously to the ENMAX EMS master station, the substation logic module, and to engineering workstations for remote configuration and monitoring of the IntelliTEAM II system using S&C WinMon Graphical User Interface Software.
The Human Interface
New operator screens were created for the ENMAX EMS master station to provide dispatcher visibility and control of the FA system. Key elements of the operator interface include an overview showing the dispatchers, at a glance, which areas of the FA system are enabled. From here, the dispatcher can drill down to screens of feeder maps with the automated switches shown in their physical locations. Clicking on the individual switch locations brings up a detail page of the switch, which shows all pertinent information for each individual switch.
All alarms and events generated by the automated switches are logged and available to the engineering staff. A smaller subset of these is presented to the operators and is limited to only the essential points required to operate the system.
A Unique Challenge
ENMAX had a unique challenge in accommodating electro-mechanical relays at the substation breakers into the automatic operation, including the load-management aspects of the IntelliTEAM II system. These relays only provided a single reclose operation in response to a fault on the feeder. This meant figure 3.A single-line diagram of Phase I substations and automated feeders.
xx xx xx xx yy yy xx 111 Sub 28 Sub 53 Sub 24 Sub 39 Sub 11 Sub 14 Sub 36
Automated Pad-Mount Switch Automated Overhead Switch Substation Breaker Legend Totals 14 Pad-Mount Switches 32 Overhead Switches 19 Feeders 32 26 27 26 27 14* 8* 3 9 2 111 111 36 37 45 65 44 43 9 117 113 112 114 118 114 111 115 112 116 7 8 8 3 3 48* 42 31 43 35 39 30 16 17 11 28 23 33 19* 22 59 xx 40 113 116 115 114 41 43 32 6 5 xx xx xx xx xx xx xx 17* 9* 7* 4* 8* 20* 111A 111B
that momentary faults would become permanent faults when combined with the sectionalizing desired on the feeder switches. Further, the substation relays were not able to directly supply feeder loading data to the distributed controls, reducing the effec-tiveness of the load-management feature of IntelliTEAM II.
Overcoming this challenge meant that the first line seg-ment outside the substation would need to be restorable like other feeder segments. A new algorithm was needed. The ENMAX EMS master station sends notice of a breaker lockout to the algorithm, which then interrogates the first automated switch on the feeder to determine the fault loca-tion. If the fault is beyond the first automated switch and the switch is open, the logic module issues a close command to the breaker and restores the first feeder segment.
The reclosing function of the substation breaker is blocked for safety reasons when personnel are working on a feeder. Blocking of the reclosing function now also triggers the logic module to automatically issue “prohibit restoration” com-mands, which prohibit the closing of automated switches on that feeder. Prohibit restoration commands are also sent by the logic module to all automated switches during sys-temwide underfrequency or undervoltage events.
Project Status
Phase I of the project was completed in early 2004, automat-ing a total of 18 25-kV distribution feeders as shown in Figure
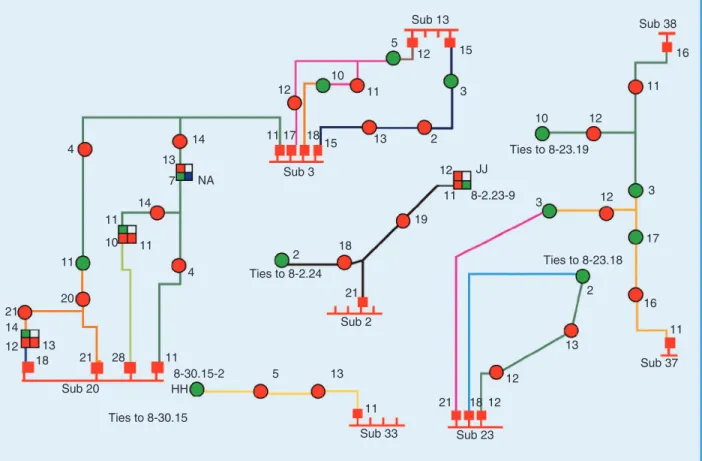
3. As of November 2004, there have been a total of 11 outage events on the automated feeders. During these events, the FA system has averted an estimated 862,000 customer outage figure 4.A single-line diagram of Phase II substations and planned automated feeders.
21 20 11 13 14 11 10 7 4 14 11 17 18 15 13 2 3 5 15 12 11 12 10 NA 11 4 2 19 18 12 11 JJ 21 21 21 18 12 12 13 2 28 HH 11 5 13 11 14 12 18 13 Sub 20 Sub 33 Sub 23 Sub 2 Sub 3 Sub 13 Ties to 8-30.15 Ties to 8-2.24 Ties to 8-23.18 Ties to 8-23.19 8-2.23-9 8-30.15-2 17 16 11 11 16 12 12 10 3 3 Sub 38 Sub 37
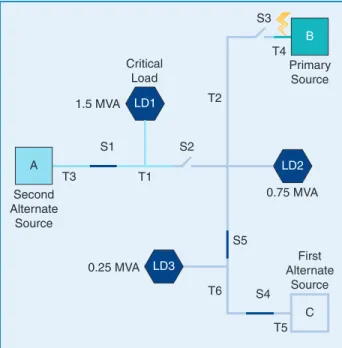
figure 5.A single-line diagram of the automated system: normal configuration. Critical Load T2 T4 T1 T3 S2 S5 S4 T6 T5 S3 S1 Second Alternate Source First Alternate Source Primary Source LD3 LD2 LD1 C A B
minutes and 6,800 customer outages. This represents an over-all reduction in SAIDI of 8.6% and a system average interrup-tion frequency index (SAIFI) reducinterrup-tion of 1.7%. These are significant numbers given that only 16% of ENMAX cus-tomers are currently benefiting from the FA system.
Phase II is now underway and includes an additional ten feeders on the 13.2-kV system. Rather than deploying on a per-substation basis, as was done on the 25-kV system, individual feeders with the worst reliability records are being targeted to maximize the SAIDI and SAIFI benefits. A single-line
repre-sentation of the Phase II feeders is shown in Figure 4. In the fifth year of the project, full build-out will be an estimated 200 automated switches on 80 distribution feeders.
ENMAX has already generated significant reliability improvements through the implementation of this advanced feeder automation system, and significant improvement is expected as the program continues to roll out on the five-year plan.
Reliability and Optimizing Use of Existing Assets A rural electric cooperative in the southeastern United States was faced with a problem: dealing with the demands for higher reliability by a large and influential retailer that had brought hundreds of jobs to the cooperative’s service area. The cooperative could not risk losing the load or its associat-ed jobs.
Several approaches were studied. System constraints ruled out the installation of stand-alone source-transfer gear because the available alternate circuit could not handle the peak load. Upgrading the existing lines for higher reliability was just too expensive. Instead, the cooperative chose to address the challenge with the installation of a system that could dramatically improve reliability and also effectively manage the loads in the area to prevent overloads during cir-cuit reconfiguration without expensive line upgrades.
Figure 5 shows the implementation of an IntelliTEAM II system to maximize reliability for LD1 and the large retail store and also to optimize the use of existing distribution cir-cuit assets. The system utilizes UtiliNet spread-spectrum radios to communicate within and between the teams.
Here’s a roadmap of the system:
✔ Substation B serves Distribution Circuit B (Ckt B). ✔ Substation C serves Distribution Circuit C (Ckt C). ✔ Substation A serves Distribution Circuit A (Ckt A). ✔ Teams are designated T1, T2, T3, T4, T5, and T6. ✔ Automated switches are designated S1, S2, S3, S4, and
S5.
✔ Circuit loads are designated LD1, LD2, and LD3.
Background
Substation B, the primary source, is capable of supporting the maximum combined area load of 2.5 MVA. Before the addi-tion of the feeder automaaddi-tion system, the area loads were fed by Ckt B. Ckt A and Ckt C were running adjacent to the serv-ice area but not interconnected. Each of those circuits can support an additional 2 MVA of load but Ckt A is less reliable than Ckt C.
The five switches were divided into three teams, each defined as a line section bounded by automated switches. Each team is responsible for restoring its load as well as iso-lating faults within its section.
Switch S3 was installed to isolate the primary source from the subject service area. Its principal responsibility is to sectionalize the area upon loss of the primary source. A sec-ond switch, S2 (shared between Teams T1 and T2), was figure 6.A peak load example: ready for reconfiguration.
Critical Load T2 T4 T1 T3 S2 S5 S4 T6 T5 S3 S1 1.5 MVA 0.25 MVA 0.75 MVA Second Alternate Source First Alternate Source Primary Source LD3 LD2 LD1 C A B
figure 7.The initial configuration of the system: peak load example. Critical Load T2 T4 T1 T3 S2 S5 S4 T6 T5 S3 S1 1.5 MVA 0.25 MVA 0.75 MVA Second Alternate Source First Alternate Source Primary Source LD3 LD2 LD1 C A B
installed to isolate LD1 from the rest of the area loads, LD1 and LD2. Switches S1 and S4 were added to tie their respec-tive alternate sources, Feeders A and C, to the service area.
Since Ckt A is less reliable than Ckt C, it was decided to rely on Ckt C as the preferred alternate source for both loads (unless the combined loads exceed the 2-MVA limit). If the loads are greater than 2 MVA before the loss of Source B, they would be split and served separately: Ckt A serving LD1 and Ckt C serving LD2 and LD3.
This was accomplished by configuring limits of 2 MVA on S1 and S4, forcing S2 to petition for supply from S1 and/or S4 before determining whether it should close. The amount of supply for which it petitions is based on the real-time, measured load at S2 at the time Substation B is lost.
To ensure Team T1 always seeks its supply from Ckt C when the combined area load is below 2 MVA, the Team T1 logic setting for S2 assigns this switch as the “priority source” for the load it serves, LD1.
Circuit Outage at Peak Load
A fault upstream of S3 has caused the loss of Substation B when the area is operating at peak load. At the time of the fault, the combined load of the area is 2.5 MVA; LD1 is 1.5 MVA, LD2 is 0.75 MVA, and LD3 is 0.25 MVA.
After sensing an extended loss of voltage, S3 opens to isolate the area from Substation B, and S2 and S5 open in preparation for the intelligent load restoration. As shown in Figure 6, the entire load previously served by Substation B is now de-energized.
Since each team has measured and recorded its pre-event real-time loads, the next step is to determine whether the first alternate source Ckt C can accommodate the combined loads of Teams T1, T2, and T6.
S4 closes after confirming the stability of Team T5 and S4’s ability to accommodate the 0.25 MVA of prefault load. The load on S4 is now 0.25 MVA.
Team T1 has also been attempting to restore its load, but because S2 is configured as the priority source for Team T1—and Team T1 can’t seek an alternate source until first negotiating with Team T2—no action is taken.
Team T2’s coach negotiates with Team T6’s coach through S5. Since the total load on S4 will remain below its contracted limit, S5 closes, restoring service to T2 and LD2. The load at S4 is now 1.0 MVA.
Now that Team T2 has been restored, Team T1’s coach attempts to negotiate to close S2. However, a contract has been set to require that the prefault load on T1 be qualified not only against the configured limit for S2 but also against the contracted limit at S4. When T1’s prefault load of 1.5 MVA is added to the measured load at S4 of 1.0 MVA, it becomes clear that the 2.0 MVA limit would be exceeded and the negotiation stops, prevent-ing S2 from closprevent-ing. Since S2’s priority has now been satisfied, Team T1 is free to seek other sources.
Team T1’s coach now determines that its prefault load is within the configured capacity limit for S1 and that T3 is
energized. S1 is closed to restore service to critical load LD1; all operations occur in less than 60 seconds. See Figure 7 for the final configuration.
Conclusion
Distributed intelligence, as applied to distribution feeder circuits, makes it possible to consider application of automation to solve tactical problems, such as the large retailer that requires better-than-available power reliability. The utility planner can use this new technology to not only address such tactical problems but to eliminate or reduce the need for costly system upgrades, thus providing opti-mal asset management.
While many consider automation in the distribution arena to be a corporatewide endeavor, it has, more likely than not, already surfaced as a spot solution to some difficult problems. Many companies have made good use of advanced feeder automation to gain a strategic leverage in serving their cus-tomers and meeting increasingly difficult expectations on the part of the users of electric power.
All that remains is for those of us in the energy delivery industry to take advantage of the technological breakthroughs available to make our collective lives easier—and the lives of energy users brighter.
Biographies
Douglas M. Staszeskygraduated from the Georgia Institute of Technology in 1981. He joined S&C Electric Company in 1989 and has held positions in sales, product management, research and development, and power systems services. He currently is director of product management for all automa-tion systems products and is responsible for customer service, application support, and marketing. Before joining S&C Electric Company, Doug was with Public Service Electric and Gas Co. of New Jersey. Doug has experience in line con-struction, distribution engineering, operations, planning, and in the operation and maintenance of SCADA (supervisory control and data acquisition) systems.
Dean Craig is a project specialist engineer at ENMAX Power Corporation. Dean joined ENMAX in 2003 and acts as project manager and technical lead on the ENMAX feeder automation project. Before joining ENMAX, Dean held engi-neering positions at GE Power Systems, U2 Systems, and UMA Engineering. Dean holds a B.Sc. in electrical engineer-ing from the University of Alberta, Canada.
Craig Befus is an application director for S&C Electric, providing application and technical consulting on automation technologies to customers in states west of Illinois as well as western Canadian provinces. Since joining S&C in 1999, Craig has helped several utilities deploy and manage new dis-tribution automation projects using S&C technology. Before joining S&C Electric, Craig held engineering positions at Cooper Power Systems and Public Service Company of Colorado. Craig holds B.S.E.E. and M.S.E.E. degrees from