Article
Characteristics of Gridded Rainfall Data for Thailand
from 1981–2017
Shojun Arai
1,a, Kazuya Urayama
2,, Taichi Tebakari
2, and Boonlert Archvarahuprok
31 Graduate school of Environment Engineering, Toyama Prefectural University, Imizu, Toyama, Japan 2 Department of Environment and Civil Engineering, Toyama Prefectural University, Imizu, Toyama, Japan 3 Thai Meteorological Department, Bangkok, Thailand
E-mail: a[email protected] (Corresponding author), [email protected]
Abstract. We used a spatially interpolated gridded dataset produced by the Thai
Meteorological Department (TMD) to explore long-term rainfall trends. We placed data from 1981–2017 into a 0.5° grid using the Kriging method. Long-term trends in maximum daily and monthly rainfall, and total annual rainfall, were analyzed using the nonparametric Mann–Kendall trend test. Chumphon, Lamphun, Nakhon, Sawan, and Buriram provinces exhibited significant positive trends in the annual maximum daily rainfall (p<0.05, p<0.01). The coastal area of Chachoengsao Province exhibited a significant negative trend (p<0.05). January rainfall showed a negative trend throughout Thailand. Annual rainfall showed a positive trend in many regions, especially in northern, northeastern, and southern areas. The eastern region exhibited a negative trend but statistical significance was not attained. The 10-, 30-, 50-, and 100-year daily rainfall probabilities were estimated using the Generalized Extreme Value method. The eastern side of the southern region exhibited remarkably high rainfall
Keywords: Generalized extreme value distribution, Mann-Kendall test, rainfall, Thailand
ENGINEERING JOURNAL Volume 23 Issue 6
1.
Introduction
Precipitation is a critical meteorological factor; however, accurate observations are difficult because spatiotemporal variation is large. Recently, satellite data covering wide areas are being used with increasing frequency. However, the observational periods are brief and errors can arise due to the indirect nature of the measurements. For example, to verify high-resolution climate models, the temporospatial resolution of existing precipitation data is inadequate.
APHRODITE (Asian Precipitation Highly Resolved Observational Data Integration Towards the Evaluation of Water Resources) is a large dataset containing daily gridded precipitation amounts for over 50 years, as derived from rain-gauge measurements; this is presently the only long-term, continental-scale high-resolution source of daily data (Yatagai et al., 2008) [1]. Kamiguchi et al. (2010) independently collected long-term rain-gauge data in Asia and published a high-resolution daily precipitation grid (the APHRO_PR dataset) [2]. The cited authors used a new interpolation method that considered the statistical features of precipitation; this improved estimations in locations with few rain gauges. The data were used to verify the rainfall estimates employed in climate modeling and to identify variations in extreme precipitation. Limsakul and Singhruck (2015) used quality-controlled daily station data to explore long-term trends and variations in total and extreme precipitation from 1955–2014 in Thailand [3]. It was found that although precipitation had become less frequent across most of Thailand, rainfall events had become more intense. Moreover, a trend toward wetter conditions was evident; heavy precipitation constituted an increasingly large proportion of annual totals.
The Thai Meteorological Department (TMD) is developing a spatially interpolated gridded rainfall dataset. However, the properties of rainfall data may differ by the interpolation method employed. Here, we explore the features of such data and long-term trends in rainfall.
2.
Study Area and Dataset
Figure 1 shows a map of Thailand and the locations of TMD rain-gauge stations. We gridded rainfall data by interpolating point rainfall data for 1981–2017 into a 0.5° grid using the Kriging method. The number of rain-gauge stations varied annually. The Kriging method is a geostatistical interpolation technique that considers both distance and variation among known data points when estimating values in unknown areas. A kriged estimate is a weighted linear combination of known values around the point of interest. When used appropriately, the method derives weights that allow optimal unbiased estimates, minimizing error variance and setting the mean prediction errors to zero, thus eliminating over- and under-estimates. We evaluated the accuracy of spatially interpolated data using rain-gauge data from six stations (Nakhon Sawan [2007–2017], Bangna [2008–2017], Khao Kheow [2008–2017], Khon Kaen [2008–2017], Trang [2008–2017], and Nan [2016–2017]).
3.
Statistical Methods
3.1. Generalized Extreme Value Distribution
The generalized extreme value (GEV) distribution is a flexible three-parameter formulation that combines the Gumbel, Fréchet, and Weibull maximum extreme value distributions, and can be expressed as:.
(1)
where z = (x-μ)/σ; and k, σ, and μ are shape, scale, and location parameters, respectively. The scale must be positive (sigma > 0); shape and location can assume any real value. The range embraced by the GEV distribution depends on k, as follows:
0 ) (
1
σ μ x
k for k 0 (2)
x for k 0 (3)
Various values of the shape parameter yield extreme value distributions of types I, II, and III. Specifically, the three cases in which k = 0, k > 0, and k < 0 correspond to the Gumbel, Fréchet, and “reversed” Weibull distributions, respectively; the latter distribution is rarely used but has an upper bound. When fitting the GEV distribution to sample data, the sign of the shape parameter k usually indicates which of the three models best describes the random process under evaluation.
Fig. 1. Map of Thailand showing the locations of the Thai Meteorological Department (TMD) rain-gauge stations.
3.2. Mann-Kendall Test
The Mann–Kendall trend test, which is frequently used to evaluate hydrometeorological data, is a nonparametric method employing ranked data without assuming a probability distribution. The Mann– Kendall test statistic (S) is:
j k
n k j n k
x
x
S
[image:3.595.175.423.178.544.2]where n is the dataset length and xj and xk are sequential data values.
Under the null hypothesis, the distribution of S would be expected to exhibit the following mean and variance:
S
0
E
(6)
18
5
2
1
var
S
n
n
n
(7)The normal Z statistic is:
0 var 1 0 0 0 var 1 S if S S S if S if S SZ (8)
The null hypothesis is rejected at the significance level of α if Z Z12 , where Z1 2 is the probability that the standard normal distribution will exceed . S > 0 indicates a positive trend and S < 0 a negative trend within a data time series xi.
4.
Result
4.1. Annual monthly, and Rainfall Analysis
Fig. 2. Mean annual rainfall distributions over 37
years (1981–2017). Fig. 3. Standard deviations of monthly rainfall over 37 years (1981–2017).
[image:5.595.81.289.77.378.2] [image:5.595.195.399.415.718.2]Fig. 5. Relationships between daily rain-gauge and gridded data at Nakhon, Sawan Bangna, Khao Kheow, Khon Kaen, Trang, and Nan.
4.2. GEV Analysis
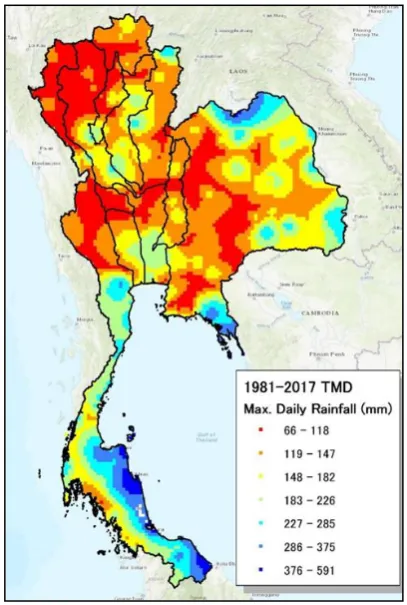
Figure 6 shows the GEV distribution maps of the 10-, 30, 50-, and 100-year probabilities of rain. All distributions exhibited near-identical trends. The probability of precipitation was high on the east side of the southern coast, but slightly higher for the Mekong River basin in the northeast, and for Bangkok.
[image:6.595.71.523.81.379.2] [image:6.595.74.524.503.665.2]4.3. Mann-Kendall Testing
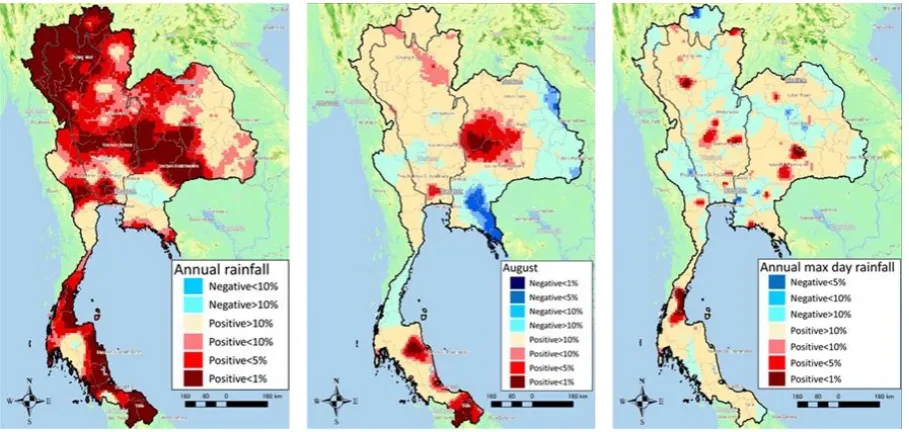
Figure 7 shows the Mann–Kendall trends for annual and August rainfall, and the annual maximum daily rainfall; the latter tended to increase countrywide. Although statistical significance was not attained, rainfall tended to decrease in Nakhonnayok, Prachinburi, and Sakaeo provinces. In terms of August rainfall, Trat, Chanthaburi, Chachoengsao, and Nakhonphanom provinces exhibited significant negative trends (p<0.01) but the central northeastern region a locally significant positive trend (p<0.05, p<0.01). Chumphon, Lamphun, Nakhon Sawan, and Buriram Provinces exhibited significant positive trends in annual maximum daily rainfall (p<0.05, p<0.01). We found no region in which the annual maximum precipitation decreased significantly.
Fig. 7. Maps of Mann–Kendall trends in annual and August rainfall, and annual maximum daily rainfall.
5.
Conclusion
We used rain-gauge data to compare and statistically analyze the characteristics of gridded data interpolated by the TMD. Some correlations between rain-gauge and gridded data were very strong; others were very weak. For example, the correlations between the adjacent Bangna and Khao Kheow regions were weak, perhaps reflecting inappropriate rain-gauge positioning in one or both regions. We used the gridded data to draw 10-, 30-, 50-, and 100-year probability distribution maps of annual and August rainfalls, and the annual maximum daily rainfall, using the GEV and Mann–Kendall trend tests. We plotted the spatial distributions of extreme rainfall, trends in annual and August rainfall, and the annual maximum daily rainfall, over 37 years (1981–2017).
Acknowledgment
References
[1] A. Yatagai,, P. Xie,, and P. Alpert, “Development of a daily gridded precipitation data set for the Middle East,” Adv. Geosci., vol. 12, pp. 165-170, 2008. [Online]. Available: https://doi.org/10.5194/adgeo-12-165-2008