FKBP5
DNA methylation does not mediate the association between
childhood maltreatment and depression symptom severity in the
Detroit Neighborhood Health Study
Angela C. Bustamante
a, Allison E. Aiello
b, Guia Guffanti
c, Sandro Galea
d,
Derek E. Wildman
e,f, Monica Uddin
a,f,g,*aNeuroscience Program, University of Illinois at Urbana-Champaign, Urbana, IL, USA
bDepartment of Epidemiology, University of North Carolina Gillings School of Global Public Health, USA cDepartment of Psychiatry, McLean Hospital, Harvard Medical School, Belmont, MA, USA
dBoston University School of Public Health, Boston, MA, USA
eDepartment of Molecular and Integrative Physiology, University of Illinois at Urbana-Champaign, Urbana, IL, USA fCarl R. Woese Institute for Genomic Biology, University of Illinois at Urbana-Champaign, Champaign, IL, USA gDepartment of Psychology, University of Illinois at Urbana-Champaign, Champaign, IL, USA
a r t i c l e i n f o
Article history:
Received 16 March 2017 Received in revised form 8 September 2017 Accepted 14 September 2017
Keywords:
Epigenetics Gene expression Childhood maltreatment Major depressive disorder Mediation
a b s t r a c t
Exposure to childhood maltreatment increases the risk of developing mental illness later in life. Child-hood maltreatment and depression have both been associated with dysregulation of the hypothalamic-pituitary-adrenal (HPA) axisda key regulator of the body's stress response. Additionally, HPA axis dys-regulation has been implicated in the etiology of a range of mental illnesses. A substantial body of work has shown history of childhood maltreatment alters DNA methylation levels within key HPA axis genes. We therefore investigated whether one of these key genes,FKBP5mediates the relationship between childhood maltreatment and depression, and assessedFKBP5DNA methylation and gene expression within 112 adults from the Detroit Neighborhood Health Study (DNHS). DNA methylation was assessed in 4 regions, including the upstream promoter, downstream promoter, and two glucocorticoid response elements (GREs) via pyrosequencing using whole blood derived DNA; Taqman assays measured relative RNA expression from leukocytes. Mediation analyses were conducted using sequential linear regression. Childhood maltreatment was significantly associated with depression symptom severity (FDR<0.006), but was not a significant predictor of DNA methylation in any of the four loci examined.FKBP5showed elevated expression levels in participants with vs. without a history of depression (p<0.001); no sig-nificant difference in gene expression levels was observed in relation to childhood maltreatment (p > 0.05). Our results suggest DNA methylation does not mediate the childhood maltreatment-depression association in the DNHS.
1. Introduction
Adverse early life experiences, such as childhood maltreatment (CM), increase susceptibility for developing depression (Hussey et al., 2006; Nanni et al., 2012; Nelson et al., 2017), post-traumatic stress disorder (PTSD) (Stein et al., 1996), bipolar
disorder (Afifi et al., 2008), and other mental health disorders (MacMillan et al., 2001; Martin-Blanco et al., 2014; McGowan et al., 2009) in adulthood. In addition, exposure to CM has been shown to dysregulate the hypothalamic-pituitary-adrenal (HPA) axis, a master regulator of the body's stress response (reviewed in (Van Voorhees and Scarpa, 2004)). Substantial work has demonstrated that dysregulation of the HPA axis increases the likelihood of developing mood and anxiety disorders (Appel et al., 2011; Ceulemans et al., 2011; Espejo et al., 2007; Guerry and Hastings, 2011; Nemeroff, 2004). Moreover, it has been well-documented that exposures during early life, including CM, impact DNA methylation (5mC) levels within genes of the HPA axis (Martin-*Corresponding author. Department of Psychology, Carl R. Woese Institute for
Genomic Biology, University of Illinois at Urbana-Champaign, 603 E. Daniel St, 527 Psychology, Champaign, IL 61820, USA.
Blanco et al., 2014; McGowan et al., 2009; Romens et al., 2015; van der Knaap et al., 2014) making the HPA axis a logical starting point for studies examining the epigenetic impact of CM.
FK506 Binding Protein 5 (FKBP5) is a gene whose product is involved in HPA axis function by negatively regulating the stress response. The HPA axis is activated by stress and is regulated by two levels of negative feedback: long range and ultra-short intracellular feedback loops. Long range feedback occurs when high levels of cortisol in the blood stream are detected by the hypothalamus, resulting in decreased excretion of corticotropin releasing hormone (CRH) and subsequent tamping down of the stress response (Binder, 2009; Binder et al., 2008; Davies et al., 2002; Yang et al., 2012). Ultra-short feedback occurs at the cellular level and in-volves FKBP5, which acts as a negative regulator of the glucocor-ticoid receptor (GR) (Appel et al., 2011; Binder, 2009; Binder et al., 2008; Yang et al., 2012). The presence of FKBP5, when bound to a multi-protein chaperone complex in the cytoplasm, lowers the binding affinity between cortisol and the GR (Binder, 2009). When cortisol is able to successfully bind to the GR, the GR-cortisol complex translocates into the nucleus, where it binds to glucocor-ticoid response elements (GREs) (Binder et al., 2008; Yang et al., 2012) and acts as a transcription factor to upregulateFKBP5 tran-scription. Increased expression of FKBP5 reduces GR sensitivity, leading to more unbound cortisol in the cytoplasm and in the blood, thereby activating the long feedback loop (Binder, 2009).
DespiteFKBP5'sprominent role in the regulation of the stress response, relatively few studies have examined the relationship between CM and FKBP5 5mC in humans. Klengel et al. (2013). examinedFKBP55mC in participants with a history of childhood trauma compared to a control group. They reported significantly decreased 5 mC at several glucocorticoid response elements (GREs) and a significant interaction between childhood trauma exposure and genetic variation at rs1360780 to predict 5 mC at intron 7 (Klengel et al., 2013). A second study, by Tyrka et al. examined the association of CM andFKBP55 mC at intron 7 in a cohort of pre-school aged children, and found significantly decreased FKBP5
5mC of two CpG sites within intron 7 and found no significant interaction between SNP rs1360780 and lifetime contextual stress
on FKBP5 5mC of intron 7 (Tyrka et al., 2015). A third study in
children, by Weder et al. employed a genome-wide approach using Illumina's 450K Bead Chip to examine 5mC and more broadly the relationship between CM and depression (Weder et al., 2014). They reported significant differences among CM cases compared to controls at several CpG sites withinFKBP5. However, due to the incomplete coverage of theFKBP5region by the 450K array, the region examined in the two earlier studies was not assessed.
Two additional groups have examinedFKBP55mC in relation to other stressful life events. H€onhe et al. examined the impact of psychosocial stress onFKBP55mC and gene expression (GE) within the context of major depression history andFKBP5genotype. They found a significant interaction of SNP genotype at rs1360780 and depression status onFKBP55mC of intron 7, however thisfinding did not survive multiple test corrections (Hohne et al., 2015). Lastly, Non et al. found the length of time in institutionalized care was significantly negatively correlated withFKBP5intron 7 CpG site 1 5mC after correcting for multiple hypothesis testing (Non et al., 2016).
These studies reported significantly differentFKBP55mC asso-ciated with either exposure to CM or major depression, however none of them directly examined the relationship among CM, 5mC, and depressiondyet, given the demonstrated relationship between CM and 5mC, as well as differential 5mC in relation to depression in
FKBP5(Hohne et al., 2015) and other HPA axis genes (Na et al., 2014;
Nantharat et al., 2015; Tyrka et al., 2012), a plausible relation exists among these factors. To address this possibility, we examined
whetherFKBP55mC mediates the relationship between CM and depression, and if the altered 5mC subsequently influences GE levels of FKBP5. Our primary analyses focused on the introns implicated in previous work as being influenced by CM (Klengel et al., 2013; Tyrka et al., 2015), while theFKBP5promoter region analyses reflect a smaller exploratory dataset that tested more ca-nonical influences of 5mC on GE.
2. Methods
2.1. Participant selection
The Detroit Neighborhood Health Study (DNHS) was approved by the institutional review board at the University of Michigan and the University of North Carolina at Chapel Hill. Participants were selected from the DNHS, a longitudinal, population-based repre-sentative sample of adult residents from Detroit, MI (Goldmann et al., 2011; Uddin et al., 2010). All participants provided informed consent prior to participation. Selection for inclusion in this study was based on the availability of whole-blood derived DNA, leukocyte-derived RNA, and complete survey data regarding CM and depression histories. The full sample (N¼112) was tested for intron 2 and intron 7, and a subset of participants (N¼72) was selected for the promoter region assays.
2.2. Childhood maltreatment
CM history was collected via structured telephone interviews assessing the severity, duration, and frequency of each event type. Assessment of CM was based on an adaptation of the Conflict Tactics Scale (CTS) (Straus, 1979) and the Childhood Trauma Questionnaire (CTQ) (Bernstein et al., 1997), as previously described (Keyes et al., 2012; Uddin et al., 2013). CTS items assessed physical and emotional abuse before age 11, with responses rated on a 5-point scale. CTQ assessed physical and sexual abuse before age 18, rating responses on a 3-point scale. In this study, a binary variable of CM exposure was used, such that CM exposure (N¼56) was defined as any individual belonging to the upper quartile for CM score within the full wave 2 DNHS survey sample (N ¼1588). Participants without exposure to CM (N ¼56) belonged to the bottom quartile of CM score within the full wave 2 DNHS survey sample.
2.3. Depression measure
Depression symptom severity (depSS) scores were based on participant responses from the Patient Health Questionnaire (PHQ-9) (Kroenke et al., 2001), rated on a 4-point scale for each of the 9 questions with each question ranging from 0 (not at all) to 3 (nearly every day); and total depression severity scores ranging from 0 to 27 as described in (Uddin et al., 2013). Lifetime major depressive disorder (MDD) was assessed at each wave of the DNHS using the PHQ-9, with additional questions to assess the timing and duration of symptoms, consistent with DSM-IV criteria (American Psychiatric, 1994) and previously validated (Uddin et al., 2011). Participant depression information was taken from the same wave as the participants’ biospecimens tested in the experiments described below. In this study, the continuous measure of depSS was used in the regression models. Within the GE analyses MDD was defined as history of lifetime MDD.
2.4. Antidepressant medication
described previously (Bustamante et al., 2016) and is included in the regressions as a covariate.
2.5. Genotype
Participant genotype ofFKBP5SNP rs1360780 was imputed from data collected by the Illumina HumanOmniExpress BeadChip. PLINK (Purcell et al., 2007) was used to impute the genotype of rs1360780 for the DNHS participants. A subset of the study par-ticipants (N¼100) had available genotype information.
2.6. Sample preparation
2.6.1. DNA and RNA collection
Whole blood was collected via venipuncture from study par-ticipants during scheduled in-home visits by a phlebotomist. DNA was isolated from whole blood and concentration was verified via Nanodrop 1000 (Thermofisher Scientific, Waltham, MA) as previ-ously described (Bustamante et al., 2016). RNA was isolated from leukocytes and subjected to the following criteria to ensure high quality RNA was obtained, including a RNA integrity number (RIN) 5, 28s/18s1.0, and 260/2801.7 (Fleige and Pfaffl, 2006; Fleige et al., 2006). RNA sample RIN values and 28s/18s ratios were calculated using the 2100 Bioanalyzer (Agilent, Wilmington, DE) to determine RNA quality.
2.6.2. Peripheral blood mononuclear cell counts
At the time of blood draw, two FICOLL gradient containing 8 ml BD Vacutainers CPT™with sodium citrate (Franklin Lakes, NJ) were used for the collection of peripheral blood mononuclear cell (PBMC) samples and processed as previously described (Bustamante et al., 2016).
2.6.3. Bisulfite conversion
Using Qiagen's Epitect Bisulfite Kit, 750 ng of participant DNA was bisulfite converted following the manufacturer's recom-mended protocol. Negative controls containing RNAse/DNAse free water in place of DNA were included with each bisulfite conversion. High and low methylation control DNA purchased from Zymo Research (Irvine, CA) was bisulfite converted along with the participant samples in order to assess assay performance.
2.7. PCR amplification&pyrosequencing
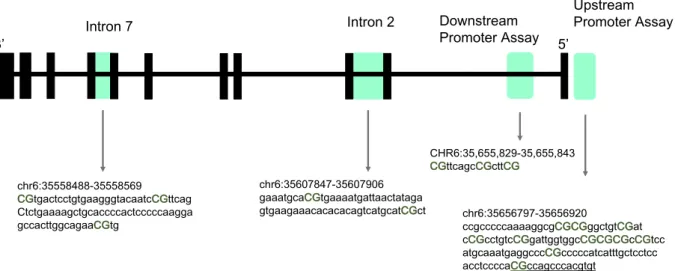
5mC upstream of the transcription start site (TSS) (CHR6:35,656,797e35,656,920), downstream of the TSS (CHR6:35,655,829e35,655,843), and introns 2 (CHR6:35,558,310
e35,558,785) and 7 (CHR6:35,607,754e35,608,049) ofFKBP5were assessed via pyrosequencing. These regions were targeted in part based on: (i) previous work withinFKBP5(intron 2 and 7 (Klengel et al., 2013):), and (ii) previous work demonstrating an association between early life adversity and 5mC in promoter regions of related HPA axis genes (i.e.NR3C1(Oberlander et al., 2008; Tyrka et al., 2012)). All assayfiles were designed and created using the Pyro-Mark Q24 Assay Design Software 2.0 (Qiagen). 5mC of FKBP5's
Intron 2 and 7, which encompass GREs, has been previously investigated by (Klengel et al., 2013; Tyrka et al., 2015; Yehuda et al., 2015a) (Fig. 1). PCR and pyrosequencing primers for Intron 2 and 7 have been previously described in (Klengel et al., 2013). Due to the read length of the assay associated with the intron 7 primers developed by Klengel et al. intron 7 CpG 3 methylation data was not reliably obtained; therefore, a new sequencing primer for Intron 7 CpG 3 was designed and used with the amplicon amplified by the PCR primers as described by (Klengel et al., 2013). The two intron 2 CpG sites are both located near a consensus GRE sequence, ~552bp
away. Within intron 7 CpG sites 1 and 3 surround the consensus GRE sequence: CpG 1 is 15bp away from the closest GRE consensus sequence, and CpG 3 is 47bp away from the same GRE consensus sequence; in contrast, CpG 2 is located within the consensus GRE sequence. Within the promoter region, two separate loci were examined. Thefirst was a ready-made Qiagen assay targeting 3 CpG sites within intron 1 and overlapped a CpG island TSS, denoted as downstream promoter (Fig. 1). The second was newly developed using the PyroMark Q24 Assay Design Software 2.0 (Qiagen). The newly developed primer set encompassed 11 CpG sites within several transcription factor binding sites (TFBS) including EGR-1, and overlapped a CpG island upstream of the TSS, denoted as up-stream promoter (Fig. 1).
All PCR and sequencing primers were validated according to the recommendations in the PyroMark manual to ensure high quality primers were used. Additionally, each primer set was tested using commercially available Human high and low methylation control DNA (Zymo Research) that was bisulfite converted on site. For each locus examined, the high methylation control DNA averages and ranges were: 91.1% for the upstream promoter with methylation ranging from 74% to 100%; 96.7% for the downstream promoter ranging from 92% to 100%; 76.1% for intron 2, ranging from 67% to 85%; and 96.4% for intron 7 ranging from 93% to 100%. The low methylation control DNA averages and ranges were: 8% for the upstream promoter, with methylation ranging from 2% to 32%; 6.6% for the downstream promoter ranging from 5% to 8%; 27.9% for intron 2, ranging from 27% to 30% intron 2; and 60.6% for intron 7 ranging from 54% to 68%. Bisulfite converted participant DNA was amplified using Qiagen's PyroMark PCR kit for all four loci ofFKBP5
examined in this study. PCRs were run in duplicate and contained 20 ng of bisulfite converted participant DNA as starting template. No template controls were run in duplicate and were included with each set of PCRs as a negative control as they did not contain any DNA. Qiagen's PyroMark Q24 Pyrosequencer was used to detect 5mC levels following manufacturer's protocols and default settings.
Upstream Promoter Assays: Upstream Promoter Primerset_1
Forward PCR primer (biotinylated): 50 -AGGGTT-TAGGGGTTGTTAGT-30
Reverse PCR primer: 50-TCCACCATCCCTTCTCTATAAC-30 Sequencing primer: 50 -ATAATAAAAACCAAACCTCATTTAC-30
Annealing temperature: 58C Targets 9 CpG sites
Upstream Promoter Primerset_2
Forward PCR primer: 50-AGGGTTTAGGGGTTGTTAGT-30 Reverse PCR primer (biotinylated): 50 -TTTCCAC-CATCCCTTCTCTATAAC-30
Sequencing primer: 50-GTTTATGTAAATGAGGT-30 Annealing temperature: 58C
Targets 2 CpG sites Downstream Promoter Assay:
Assay Name: Hs_FKBP5_01_PM PyroMark CpG assay Qiagen Catalogue Number: PM00120946
Sequencing primer: 50- CGTTCAGCCGCTTCGG -30
Annealing temperature: 56C Targets 3 CpG sites
Intron 7 Assay:
FKBP5 Intron 7 CpG 3 sequencing primer: 50-
2.8. Reverse transcription&real-time PCR
FKBP5 mRNA expression levels were assessed in participants
with available total RNA (N ¼ 71). Total RNA was reverse tran-scribed into cDNA following the manufacturer's protocol using the High Capacity Reverse Transcription Kit purchased from Applied BioSystems (Foster City, CA). Ready-made Taqman GE assays (Applied Biosystems) were used to measure relative transcript levels of the target geneFKBP5(Hs015610061_m1) and the control gene TATA Binding Protein,TBP(Hs00427621_m1) run in separate wells. Reactions were performed in triplicate for each participant. Each reaction was 20
m
l and contained 10 ng of participant cDNA for both the test and control genes. Reactions were run on the HT7500 Fast Real-Time PCR machine (Applied BioSystems, Foster City, CA) following the manufacturer's recommended protocol.2.9. Pyrosequencing data analysis
5mC levels were averaged across CpG sites within each of the four tested loci (upstream promoter, downstream promoter, intron 2, and intron 7). This step was performed based on the assumption that CpG sites within a functional region, such as the promoter region, a TFBS, or a GRE are correlated, based on previous empirical
evidence (Jones, 2012). Additionally, the composition of CpG sites within intron 2 and 7 that were averaged correspond to the CpGs included in the bins as reported by (Klengel et al., 2013). The dis-tribution of averaged 5mC data obtained for each region was evaluated using boxplots, histograms, and tested for normality using the Shapiro-Wilk test of normality in IBM SPSS Statistics for Windows, version 23.0 (IBM Corp., Armonk, NY).
2.9.1. Demographic statistics
Independent samples t-tests were used to test for bivariate as-sociations between CM exposure and demographic covariates, as well as depression and demographic covariates. Chi-square tests were used to test for associations between CM exposure and the demographic variables of sex, race, and genotype. Similarly, Chi-square tests were used to test for the association between depression history and sex, race, and genotype. All statistical tests were two-tailed and results were considered significant when p<0.05. Tests were conducted using SPSS version 23.0.
2.9.2. Mediation analyses
5mC, CM, and depSS information for each participant was used to carry out mediation analyses using linear regressions (Fig. 2). The analysis was performed using SPSS version 23.0, following criteria outlined in (Baron and Kenny, 1986). Specifically, we assessed whether: (a) CM is associated with depSS after controlling for confounders (i.e. age, sex, race, PBMC count, and antidepressant medication use); (b) CM is associated withFKBP55mC levels, after Fig. 1.Schematic showing the four regions examined within the study indicated by shading upstream promoter (CHR6:35,656,797e35,656,920), downstream promoter
(CHR6:35,655,829e35,655,843), and introns 2 (CHR6:35,558,310e35,558,785) and 7 (CHR6:35,607,754e35,608,049). All coordinates provided are from the UCSC Genome Browser
Build 2009/hg19. The CpG sites examined within this study are indicated in uppercase, bold font, and green text. Lower case letters indicate intronic regions. Region of transcription factor binding is indicated by underlined sequence. (For interpretation of the references to colour in thisfigure legend, the reader is referred to the web version of this article.)
controlling for confounders; (c) if FKBP5 5mC is a predictor of depSS, after controlling for confounders; and lastly, if a, b and c were significant, we tested (a’), i.e. if the effect of CM on depSS at
FKBP5regions is attenuated after controlling for 5 mC at those
regions, as well as other confounders. All regression models included age, sex, self-reported race, PBMC count, and antide-pressant medication information as covariates. A secondary anal-ysis tested the potential interaction between CM andFKBP5SNP rs1360780 within intron 7, as previously reported in (Klengel et al., 2013; Tyrka et al., 2015), in a subset of individuals with available genotype data (n¼100). For the model testing for an interaction, the main effect model was runfirst, followed by the interaction model. To address the concern of multiple hypothesis testing and potential Type I errors, the false discovery rate (FDR) was calculated as outlined in (Benjamini et al., 2001) such that results were accepted as significant when FDR0.006. Adjusted p-values are indicated by“FDR”and unadjusted p-values are indicated by“p”.
2.9.3. Gene expression
Cycle threshold (CT) values for each sample were averaged across replicates to obtain a mean CT value for each participant used in our analysis. All data was examined for outliers, and any replicates with a standard deviation greater than 0.25 were removed (n¼ 5), and the mean CT was re-calculated from the remaining data points (Biosystems, 2016). GE data were analyzed using the comparative CT method (Schmittgen and Livak, 2008), normalizing FKBP5GE against the control gene TBP. Normalized data were analyzed using the student's t-test to compare expres-sion levels according to exposure to CM and depresexpres-sion history. In this secondary analysis, results were accepted as significant if p<0.05.
2.9.4. Correlation analysis
Pearson correlations were used to further explore the potential relationship betweenFKBP5GE and 5 mC at each of the four re-gions examined individually. Correlations were considered signif-icant when p<0.05. Tests were conducted using SPSS version 23.0.
3. Results
General descriptive statistics of the study sample are included in Table 1. Examination of the 5mC data revealed no extreme outliers. Participants with exposure to CM were not significantly different from those without CM exposure in terms of age, sex, self-reported race, genotype (rs1360780), PBMC count, or percent methylation (Table 1). There was a significant difference in CM score and depSS for participants with a history of CM exposure compared to those without such exposure (Table 1). Similarly, those with a history of depression had significantly different CM score and depSS compared to those with no reported history of depression (Table 1). A subset of the study participants (N¼100) had available genotype information; of these, 16 participants were homozygous for the T risk allele (i.e. TT), 41 participants were heterozygous CT, and 43 were homozygous CC. Participant genotypes were in Hardy-Weinberg equilibrium (p¼0.248). For SNP rs1360780, the major allele is C and the minor allele is T. The minor allele frequency ac-cording to the 1000 genomes project for rs1360780 is 0.3273 (Genomes Project et al., 2015), while in this dataset the imputed minor allele frequency among participants is 0.365.
3.1. Mediation analysis
3.1.1. Upstream promoter
All analyses of the promoter regions, both upstream and downstream, used the subsetted population of participants (N¼72,
36 CM cases). In the upstream promoter analyses, wefirst tested whether CM predicts depSS. CM was the sole significant predictor of depSS in this model (
b
¼4.78 SE 1.11 p<0.001 FDR¼0.005; Table S1a). The next linear regression model tested the relationship between CM and 5mC; neither our primary predictor (i.e. CM) nor any of the covariates were significantly associated with 5mC within this locus of the FKBP5 promoter region (Table S1b). The next regression model tested whether 5mC predicted depSS; no signif-icant predictors or covariates were identified in this model (Table S1c). These results are summarized inFig. 3A.3.1.2. Downstream promoter
As with the upstream promoter region results, CM was the sole significant predictor of depSS in this model CM (
b
¼4.78 SE 1.11 p<0.001 FDR¼0.005;Table S2a). Similarly, there was no signifi -cant relationship between CM or any of the covariates with 5mC; and, no significant predictors were observed in the model exam-ining whether 5mC predicted depSS (Tables S2bec). These results are summarized inFig. 3b.3.1.3. Intron 2
All analyses of the intronic regions, both introns 2 and 7, drew on the full sample population (N¼112, 56 CM cases). In thefirst model, CM (
b
¼4.47 SE 1.44 p¼0.002 FDR¼0.006) significantly predicted depSS (Table S3a). In the next models, CM was not a significant predictor ofFKBP5Intron 2 5mC (Table S3b), nor didFKBP5intron 2 5mC predict depSS (Table S3c). These results are
summarized inFig. 3C.
3.1.4. Intron 7
CM significantly predicted depSS (
b
¼4.47 SE 1.44 p¼0.002 FDR¼0.006;Table S4a). Similar to intron 2, CM was not a signifi -cant predictor of FKBP5 Intron 7 5mC (Table S4b). In the next regression model, intron 7 5mC and other covariates did not significantly predict depSS (Table S4c). Participant genotype was available for a subset of participants (N¼100, 50 CM cases); in-clusion of participant genotype (rs1360780) as an interactor with CM (as previously shown (Klengel et al., 2013)), did not alter the reported non-significantfindings (Fig. 3d;Supplementary Table 4).3.2. Gene expression of peripheral leukocytes
FKBP5GE was examined separately for CM and lifetime MDD to
discern the potential impact of each exposure. No significant (p>0.05) differences in relative GE levels were observed between the CM exposed cases compared to the non-exposed controls. However, when comparing MDD cases and controls, we observed a significant increase in relative GE level among those with MDD vs. controls (p<0.001) (Fig. 4).
3.3. Correlation of gene expression and DNA methylation
The relationship betweenFKBP5GE and 5 mC at each of the four regions was examined to further elucidate the relationship. No significant (p>0.05) correlation betweenFKBP5GE and 5mC was observed at any of the four loci examined: upstream promoter re-gion r¼0.036, p¼0.812; downstream promoter region r¼0.046, p ¼0.759; intron 2 r ¼ 0.063, p ¼0.634; intron 7 r¼0.091, p¼0.475.
4. Discussion
levels within HPA axis genes. Motivated by this work, we sought to test whether 5mC mediates the relationship between CM and depSS in an adult population. We examined four loci withinFKBP5
(upstream promoter, downstream promoter, intron 2, and intron 7); the latter two loci have previously shown CM-associated 5mC differences. Our results suggest 5mC does not mediate the rela-tionship between CM and depSS at any of the four FKBP5 loci
examined. However, and confirming a large body of previous research in this area (Harkness and Monroe, 2002; Kessler et al., 1997; MacMillan et al., 2001; Molnar et al., 2001; Wanklyn et al., 2012), a significant effect of exposure to CM on depSS was observed. These results highlight the complex relationship be-tween CM and depression onset, suggesting multiple factors may contribute to disease onset following exposure to CM.
Table 1
Demographic, genetic, and survey data of the study participants. Values indicate the counts or mean±standard deviation. Bold values indicate a significant (p<0.05) dif-ference between groups.
Measures Full Study Sample CM- CMþ p value*,
t-test or X2 MDD- MDDþ p value *, t-test or X2
Total N¼112
Age 50.74±12.96 50.11±13.14 50.14±12.80 0.988 51.50±13.32 47.65±11.91 0.131
Sex X21 X20.257
Male 50 25 25 30 20
Female 62 31 31 42 20
Race X20.697 X20.971
European American 18 8 10 12 6
African American 86 43 43 55 31
Other 8 5 3 5 3
rs1360780 X20.782 X20.385
T Homozygous 16 9 7 12 4
CT Heterozygous 41 19 22 23 18
CC Homozygous 43 22 21 28 15
Depression Symptom Severity 8.28±7.82 6.13±7.31 10.47±7.78 0.003 3.72±4.98 16.38±4.80 <0.001
PBMC count (million cells) 4.55±1.49 4.50±1.31 4.60±1.68 0.719 4.46±1.42 4.70±1.61 0.432 CM Score 6.12±5.43 1.57±1.44 10.66±3.93 <0.001 5.15±4.79 7.85±6.11 0.011
Percent DNA Methylation
Average Intron 2 76.40±6.19 76.23±5.94 76.61±6.50 0.764 76.48±6.95 76.30±4.45 0.877 Average Intron 7 90.24±3.02 89.98±3.14 90.49±2.92 0.397 90.01±2.76 90.62±3.42 0.326
N¼72
Percent DNA Methylation
Average Upstream Promoter 4.64±1.67 4.30±1.45 4.75±1.87 0.248 Average Downstream Promoter 2.80±0.93 2.69±0.91 2.90±0.95 0.353 Depression Symptom Severity 3.72±4.98 1.44±2.2 6.06±5.91 <0.001
CM Score 5.15±4.79 0.75±0.77 9.56±2.48 <0.001
* Indicated p-values are derived from t-tests, unless denoted by X2, indicating it was derived by chi square test.
Further examination of the individual regression analyses of the larger mediation model revealed several surprisingfindings, the first of which is that we did not detect a significant effect of CM on
FKBP55mC within intron 7 that has been reported in other studies
(Klengel et al., 2013; Tyrka et al., 2015). However, similar to our findings for the promoter region, one previous study reported no significant effect of CM on FKBP5promoter region 5mC (Klengel et al., 2013). The second surprisingfinding is thatFKBP55 mC at any of the 4 loci were not significant predictors of depSS. Several studies have shown altered 5mC levels associated with depressive mood (Kahl et al., 2016; Nantharat et al., 2015; Oberlander et al., 2008; Tyrka et al., 2016). In addition, although the non-significant interaction between CM and genotype (rs1360780) at intron 7 in our data stands in contrast to previous work in adults (Klengel et al., 2013), this finding is consistent with a study in children (Tyrka et al., 2015). Further investigation is needed to elucidate the un-derlying mechanism between CM andFKBP55mC.
As a secondary analysis, we examined the potential significant functional effect of exposure to CM and lifetime MDD onFKBP5GE levels. No effect of CM exposure was observed onFKBP5GE levels. Thisfinding is consistent with previous work that examined the biological correlates of PTSD in a longitudinal military cohort on
FKBP5GE and included CM as a covariate (van Zuiden et al., 2012).
Examination ofFKBP5GE levels in relation to lifetime MDD, how-ever, revealed a significant increase in expression between those with vs. without a history of the disorder. These findings are consistent with previous studies examining rodent GE ofFkbp5in relation to chronic stress (Guidotti et al., 2013) or corticosterone exposure (Lee et al., 2010). One human study that comparedFKBP5
GE in pre- and post-antidepressant treatment in healthy controls and depressed patients reported increased levels ofFKBP5GE at baseline for the depressed patients compared to the healthy con-trols (Cattaneo et al., 2013). Potential factors that may contribute to the increase ofFKBP5 GE associated with lifetime MDD include cortisol, which may contribute to the observed association between
FKBP5 GE and MDD history. Cortisol is released into the
blood-stream from the adrenal glands when the HPA axis is activated during stressful events, actual or perceived. Cortisol, when bound to the GR increases transcription of FKBP5 via the ultra-short intracellular feedback loop. High cortisol levels and aberrant HPA axis regulation have been previously implicated in meta-analyses and multiple studies (Belvederi Murri et al., 2014; Dienes et al.,
2013; Stetler and Miller, 2011; Vreeburg et al., 2009), therefore, it is plausible that our study participants with lifetime MDD have altered cortisol sensitivity or HPA axis dysregulation, which con-tributes to the association betweenFKBP5GE and lifetime MDD. Another potential mechanism contributing to this relationship is non-coding RNAs, which can modulate GE (Kaikkonen et al., 2011; Mattick and Makunin, 2006). Although ourfindings do not directly assess these possibilities, our results do provide additional evi-dence for the potential functional effect of depression onFKBP5GE. The potential functional effect of increased GE levels associated with lifetime MDD may result in decreased sensitivity to cortisol, possibly conferring higher GR resistance (Lopez-Duran et al., 2015; Wei et al., 2015). In contrast, the non-significant effect of CM on 5 mC at any of the four loci suggests there is no apparent functional effect ofFKBP55 mC at these loci onFKBP5GE levels, at least within the DNHS study population, as evidenced by the correlation ana-lyses. In the present study we report no significant association between CM and 5mC inFKBP5, despite previous reports of an as-sociation between these two factors.
One potential reason for our findings, which do not replicate previous work, may pertain to the structure of our study. The popu-lation used in this study is drawn from a community-based, popula-tion-representative cohort, while the Klengel and Tyrka studies were predominantly comprised of participants from lower socioeconomic status. As such the level and types of trauma and/or contextual stressors experienced by both cases and controls may differ from our own population and impact results. Additionally, it is important to note the average participant age within each study. Similar to our study participants, the Klengel study is comprised of adults, whereas the Tyrka study is comprised of pre-school aged children. Within this study, the average age of DNHS participants was 50.74 years with maltreatment assessed prior to the ages of 11 and 18, resulting in an average of 32 years between exposure to CM and assessment of 5mC. The Klengel study also used the CTQ to assess maltreatment prior to the age of 18, however their population was on average younger than our DNHS participants, 41.46 years, resulting in an average of 22 years between exposure to CM and assessment of 5mC. The Tyrka study, in contrast, included pre-school aged children and relied on child wel-fare records, rather than self-report, to assess CM. Given this infor-mation, the Klengel study is the most comparable to the current study in terms of CM assessment and age at 5mC assessment.
Another potential reason for non-replication may pertain to the difference in the definition of what constituted CM. Selection of CM cases within the Klengel study required histories of both sexual and physical abuse, whereas within this study, selection was based off of exposure levels defined by quartile, with no requirement regarding the type or number of maltreatment types. The Klengel study also reports a significant interaction of childhood trauma and
FKBP5 SNP in predicting lifetime PTSD status and modified PTS
symptom severity. Additionally, few studies have examined the impact of PTSD on 5mC inFKBP5(Yehuda et al., 2013) and other HPA axis genes (Labonte et al., 2014; Yehuda et al., 2015b), therefore it is possible that co-morbid lifetime or current PTSD may be driving some of the reported significant findings in the earlier work. As a result, careful interpretation and comparison is required for our ownfindings as well as those reported by others.
There are study limitations that should be noted. First, the CM variable used in our study is a retrospective self-reported measure of abuses occurring before age 18. Early life experiences have been shown to be long lasting, with effects detected into adulthood, however self-reported measures may introduce recall bias. Previ-ously, retrospective self-reports of CM from adults with docu-mented cases were associated with underreporting of physical and sexual abuse (Widom and Morris, 1997; Widom and Shepard, 1996). Therefore, our measure of CM may well be an underestimate of Fig. 4.FKBP5gene expression levels among individuals with (n¼35) vs. without
previous abuse. Second, the use of self-reported measures may include heterogeneity and variability within the reported partici-pant results for both measures of CM and depression, which may contribute to our reported nullfindings. Despite this possibility, the CM measure and a similar measure derived from the PHQ-9 for MDD were adequate to detect significant associations in our own previous work (Bustamante et al., 2016). Third, it is possible that our study was underpowered to detect the associations being explored within this work. Nevertheless, we do not believe this to be a likely explanation: the sample size used in this study, N¼112, is between the reported samples sizes for Klengel (N¼76) and Tyrka (N¼174) which both reported significant findings forFKBP5. Moreover, a post-hoc power calculation shows that the sample is adequately powered (86.5%) to detect medium effects sizes as determined by G*Power (Faul et al., 2009). Fourth, we were unable to control for white blood cell subset within our study; however, we were able to include PBMC counts in each regression model. Notably, there was no significant difference in PBMC counts between participants with vs. without exposure to CM or with vs. without a history of depression. Lastly, we were unable to assess whether ourfindings were associated with differences in participant cortisol level, as cortisol was not collected within the parent study, the DNHS. Recent work suggests there is a genotype-dependent cortisol response to stress associated with FKBP5 SNP rs1360780 (Buchmann et al., 2014; Fujii et al., 2014; Hohne et al., 2015).
The DNHS is a non-clinical, community-based cohort of adults Detroit, Michigan residents. As such, this study provides us the opportunity to generalize ourfindings to the larger Detroit popu-lation. Second, our study is unique because antidepressant medi-cation use is a covariate in our analyses; inclusion of this variable allows us to adjust for the potential effect of antidepressant medication on 5mC levels as previously reported (Melas et al., 2012; Perisic et al., 2010). Third, this study adds to the literature by examining the relationship among CM, 5mC, depSS, and GE, with additional analyses examining FKBP5genotype and its po-tential interaction with CM. Lastly, we measured 5mC and GE in a subset of the same study participants, which allowed us to infer the potential impact of altered 5mC downstream onFKBP5GE.
In conclusion, we found that 5mC in multiple genomic regions
ofFKBP5, a regulator of GR sensitivity, does not mediate the
rela-tionship between CM and depSS. We also found a significant in-crease inFKBP5GE levels associated with lifetime MDD. We did not however, observe any significant difference in relative GE levels related to exposure to CM. Taken together, these results suggest other, additional factors beyond 5mC likely mediate the relation-ship between CM and depression as detectable in blood. Future studies would benefit from the examination of participant cortisol levels to further assess the implications of alteredFKBP5GE within individuals with a history of MDD. Additionally, examination of 5mC within other regulatory regions ofFKBP5is critical to further understanding the role ofFKBP5in the context of CM and MDD.
Conflicts of interest
None.
Acknowlegements
This work was funded by NIH grants R01DA022720, R01DA022720-S1, and RC1MH088283.
Appendix A. Supplementary data
Supplementary data related to this article can be found at https://doi.org/10.1016/j.jpsychires.2017.09.016.
References
Afifi, T.O., Enns, M.W., Cox, B.J., Asmundson, G.J., Stein, M.B., Sareen, J., 2008. Pop-ulation attributable fractions of psychiatric disorders and suicide ideation and attempts associated with adverse childhood experiences. Am. J. public health 98 (5), 946e952.
American Psychiatric, A, 1994. Diagnostic and Statistical Manual of Mental Disor-ders, fourth ed. American Psychiatric Association, Washintgon, DC.
Appel, K., Schwahn, C., Mahler, J., Schulz, A., Spitzer, C., Fenske, K., Stender, J., Barnow, S., John, U., Teumer, A., Biffar, R., Nauck, M., Volzke, H., Freyberger, H.J., Grabe, H.J., 2011. Moderation of adult depression by a polymorphism in the FKBP5 gene and childhood physical abuse in the general population. Neuro-psychopharmacol. official Publ. Am. Coll. Neuropsychopharmacol. 36 (10), 1982e1991.
Baron, R.M., Kenny, D.A., 1986. The moderator-mediator variable distinction in so-cial psychological research: conceptual, strategic, and statistical considerations. J. personality Soc. Psychol. 51 (6), 1173e1182.
Belvederi Murri, M., Pariante, C., Mondelli, V., Masotti, M., Atti, A.R., Mellacqua, Z., Antonioli, M., Ghio, L., Menchetti, M., Zanetidou, S., Innamorati, M., Amore, M., 2014. HPA axis and aging in depression: systematic review and meta-analysis. Psychoneuroendocrinology 41, 46e62.
Benjamini, Y., Drai, D., Elmer, G., Kafkafi, N., Golani, I., 2001. Controlling the false discovery rate in behavior genetics research. Behav. Brain Res. 125 (1e2),
279e284.
Bernstein, Ahluvalia, Pogge, Handelsman, 1997. Validity of the childhood trauma Questionnaire in an adolescent psychiatric population. J. Am. Acad. Child. Adolesc. Psychiatry 36 (3), 340e348.
Binder, E.B., 2009. The role of FKBP5, a co-chaperone of the glucocorticoid receptor in the pathogenesis and therapy of affective and anxiety disorders. Psycho-neuroendocrinology 34 (Suppl. 1), S186eS195.
Binder, E.B., Bradley, R.G., Liu, W., Epstein, M.P., Deveau, T.C., Mercer, K.B., Tang, Y., Gillespie, C.F., Heim, C.M., Nemeroff, C.B., Schwartz, A.C., Cubells, J.F., Ressler, K.J., 2008. Association of FKBP5 polymorphisms and childhood abuse with risk of posttraumatic stress disorder symptoms in adults. JAMA J. Am. Med. Assoc. 299 (11), 1291e1305.
Biosystems, A., 2016. Real-time PCR: Understanding Ct.
Buchmann, A.F., Holz, N., Boecker, R., Blomeyer, D., Rietschel, M., Witt, S.H., Schmidt, M.H., Esser, G., Banaschewski, T., Brandeis, D., Zimmermann, U.S., Laucht, M., 2014. Moderating role of FKBP5 genotype in the impact of childhood adversity on cortisol stress response during adulthood. Eur. Neuro-psychopharmacol. J. Eur. Coll. NeuroNeuro-psychopharmacol. 24 (6), 837e845.
Bustamante, A.C., Aiello, A.E., Galea, S., Ratanatharathorn, A., Noronha, C., Wildman, D.E., Uddin, M., 2016. Glucocorticoid receptor DNA methylation, childhood maltreatment and major depression. J. Affect. Disord. 206, 181e188.
Cattaneo, A., Gennarelli, M., Uher, R., Breen, G., Farmer, A., Aitchison, K.J., Craig, I.W., Anacker, C., Zunsztain, P.A., McGuffin, P., Pariante, C.M., 2013. Candidate genes expression profile associated with antidepressants response in the GENDEP study: differentiating between baseline 'predictors' and longitudinal 'targets'. Neuropsychopharmacol. official Publ. Am. Coll. Neuropsychopharmacol. 38 (3), 377e385.
Ceulemans, S., De Zutter, S., Heyrman, L., Norrback, K.F., Nordin, A., Nilsson, L.G., Adolfsson, R., Del-Favero, J., Claes, S., 2011. Evidence for the involvement of the glucocorticoid receptor gene in bipolar disorder in an isolated northern Swedish population. Bipolar Disord. 13 (7e8), 614e623.
Davies, T.H., Ning, Y.M., Sanchez, E.R., 2002. A newfirst step in activation of steroid receptors: hormone-induced switching of FKBP51 and FKBP52 immunophilins. J. Biol. Chem. 277 (7), 4597e4600.
Dienes, K.A., Hazel, N.A., Hammen, C.L., 2013. Cortisol secretion in depressed, and at-risk adults. Psychoneuroendocrinology 38 (6), 927e940.
Espejo, E.P., Hammen, C.L., Connolly, N.P., Brennan, P.A., Najman, J.M., Bor, W., 2007. Stress sensitization and adolescent depressive severity as a function of child-hood adversity: a link to anxiety disorders. J. Abnorm. child Psychol. 35 (2), 287e299.
Faul, F., Erdfelder, E., Buchner, A., Lang, A.G., 2009. Statistical power analyses using G*Power 3.1: tests for correlation and regression analyses. Behav. Res. methods 41 (4), 1149e1160.
Fleige, S., Pfaffl, M.W., 2006. RNA integrity and the effect on the real-time qRT-PCR performance. Mol. Asp. Med. 27 (2e3), 126e139.
Fleige, S., Walf, V., Huch, S., Prgomet, C., Sehm, J., Pfaffl, M.W., 2006. Comparison of relative mRNA quantification models and the impact of RNA integrity in quantitative real-time RT-PCR. Biotechnol. Lett. 28 (19), 1601e1613.
Fujii, T., Hori, H., Ota, M., Hattori, K., Teraishi, T., Sasayama, D., Yamamoto, N., Higuchi, T., Kunugi, H., 2014. Effect of the common functional FKBP5 variant (rs1360780) on the hypothalamic-pituitary-adrenal axis and peripheral blood gene expression. Psychoneuroendocrinology 42, 89e97.
Genomes Project, C., Auton, A., Brooks, L.D., Durbin, R.M., Garrison, E.P., Kang, H.M., Korbel, J.O., Marchini, J.L., McCarthy, S., McVean, G.A., Abecasis, G.R., 2015. A global reference for human genetic variation. Nature 526 (7571), 68e74.
Goldmann, E., Aiello, A., Uddin, M., Delva, J., Koenen, K., Gant, L.M., Galea, S., 2011. Pervasive exposure to violence and posttraumatic stress disorder in a pre-dominantly african american urban community: the Detroit neighborhood health study. J. Trauma. stress 24 (6), 747e751.
Guidotti, G., Calabrese, F., Anacker, C., Racagni, G., Pariante, C.M., Riva, M.A., 2013. Glucocorticoid receptor and FKBP5 expression is altered following exposure to chronic stress: modulation by antidepressant treatment. Neuro-psychopharmacol. official Publ. Am. Coll. Neuropsychopharmacol. 38 (4), 616e627.
Harkness, K.L., Monroe, S.M., 2002. Childhood adversity and the endogenous versus nonendogenous distinction in women with major depression. Am. J. psychiatry 159 (3), 387e393.
Hohne, N., Poidinger, M., Merz, F., Pfister, H., Bruckl, T., Zimmermann, P., Uhr, M., Holsboer, F., Ising, M., 2015. FKBP5 genotype-dependent DNA methylation and mRNA regulation after psychosocial stress in remitted depression and healthy controls. Int. J. Neuropsychopharmacol./official Sci. J. Coll. Int. Neuro-psychopharmacol. 18 (4).
Hussey, J.M., Chang, J.J., Kotch, J.B., 2006. Child maltreatment in the United States: prevalence, risk factors, and adolescent health consequences. Pediatrics 118 (3), 933e942.
Jones, P.A., 2012. Functions of DNA methylation: islands, start sites, gene bodies and beyond. Nature reviews. Genetics 13 (7), 484e492.
Kahl, K.G., Georgi, K., Bleich, S., Muschler, M., Hillemacher, T., Hilfiker-Kleinert, D., Schweiger, U., Ding, X., Kotsiari, A., Frieling, H., 2016. Altered DNA methylation of glucose transporter 1 and glucose transporter 4 in patients with major depressive disorder. J. psychiatric Res. 76, 66e73.
Kaikkonen, M.U., Lam, M.T., Glass, C.K., 2011. Non-coding RNAs as regulators of gene expression and epigenetics. Cardiovasc. Res. 90 (3), 430e440.
Kessler, R.C., Davis, C.G., Kendler, K.S., 1997. Childhood adversity and adult psychi-atric disorder in the US National Comorbidity Survey. Psychol. Med. 27 (5), 1101e1119.
Keyes, K.M., McLaughlin, K.A., Koenen, K.C., Goldmann, E., Uddin, M., Galea, S., 2012. Child maltreatment increases sensitivity to adverse social contexts: neighbor-hood physical disorder and incident binge drinking in Detroit. Drug alcohol dependence 122 (1e2), 77e85.
Klengel, T., Mehta, D., Anacker, C., Rex-Haffner, M., Pruessner, J.C., Pariante, C.M., Pace, T.W.W., Mercer, K.B., Mayberg, H.S., Bradley, B., Nemeroff, C.B., Holsboer, F., Heim, C.M., Ressler, K.J., Rein, T., Binder, E.B., 2013. Allele-specific FKBP5 DNA demethylation mediates gene-childhood trauma interactions. Nat. Neurosci. 16 (1), 33e41.
Kroenke, K., Spitzer, R.L., Williams, J.B., 2001. The PHQ-9: validity of a brief depression severity measure. J. general Intern. Med. 16 (9), 606e613.
Labonte, B., Azoulay, N., Yerko, V., Turecki, G., Brunet, A., 2014. Epigenetic modu-lation of glucocorticoid receptors in posttraumatic stress disorder. Transl. psy-chiatry 4, e368.
Lee, R.S., Tamashiro, K.L., Yang, X., Purcell, R.H., Harvey, A., Willour, V.L., Huo, Y., Rongione, M., Wand, G.S., Potash, J.B., 2010. Chronic corticosterone exposure increases expression and decreases deoxyribonucleic acid methylation of Fkbp5 in mice. Endocrinology 151 (9), 4332e4343.
Lopez-Duran, N.L., McGinnis, E., Kuhlman, K., Geiss, E., Vargas, I., Mayer, S., 2015. HPA-axis stress reactivity in youth depression: evidence of impaired regulatory processes in depressed boys. Stress 18 (5), 545e553.
MacMillan, H.L., Fleming, J.E., Streiner, D.L., Lin, E., Boyle, M.H., Jamieson, E., Duku, E.K., Walsh, C.A., Wong, M.Y., Beardslee, W.R., 2001. Childhood abuse and lifetime psychopathology in a community sample. Am. J. psychiatry 158 (11), 1878e1883.
Martin-Blanco, A., Ferrer, M., Soler, J., Salazar, J., Vega, D., Andion, O., Sanchez-Mora, C., Arranz, M.J., Ribases, M., Feliu-Soler, A., Perez, V., Pascual, J.C., 2014. Association between methylation of the glucocorticoid receptor gene, child-hood maltreatment, and clinical severity in borderline personality disorder. J. psychiatric Res. 57, 34e40.
Mattick, J.S., Makunin, I.V., 2006. Non-coding RNA. Human Molecular Genetics 15 Spec No 1, pp. R17eR29.
McGowan, P.O., Sasaki, A., D'Alessio, A.C., Dymov, S., Labonte, B., Szyf, M., Turecki, G., Meaney, M.J., 2009. Epigenetic regulation of the glucocorticoid receptor in human brain associates with childhood abuse. Nat. Neurosci. 12 (3), 342e348.
Melas, P.A., Rogdaki, M., Lennartsson, A., Bjork, K., Qi, H., Witasp, A., Werme, M., Wegener, G., Mathe, A.A., Svenningsson, P., Lavebratt, C., 2012. Antidepressant treatment is associated with epigenetic alterations in the promoter of P11 in a genetic model of depression. Int. J. Neuropsychopharmacol./official Sci. J. Coll. Int. Neuropsychopharmacol. 15 (5), 669e679.
Molnar, B.E., Buka, S.L., Kessler, R.C., 2001. Child sexual abuse and subsequent psychopathology: results from the National Comorbidity Survey. Am. J. public health 91 (5), 753e760.
Na, K.S., Chang, H.S., Won, E., Han, K.M., Choi, S., Tae, W.S., Yoon, H.K., Kim, Y.K., Joe, S.H., Jung, I.K., Lee, M.S., Ham, B.J., 2014. Association between glucocorticoid receptor methylation and hippocampal subfields in major depressive disorder. PloS one 9 (1), e85425.
Nanni, V., Uher, R., Danese, A., 2012. Childhood maltreatment predicts unfavorable course of illness and treatment outcome in depression: a meta-analysis. Am. J. psychiatry 169 (2), 141e151.
Nantharat, M., Wanitchanon, T., Amesbutr, M., Tammachote, R., Praphanphoj, V., 2015. Glucocorticoid receptor gene (NR3C1) promoter is hypermethylated in Thai females with major depressive disorder. Genet. Mol. Res. GMR 14 (4), 19071e19079.
Nelson, J., Klumparendt, A., Doebler, P., Ehring, T., 2017. Childhood maltreatment and characteristics of adult depression: meta-analysis. Br. J. psychiatry J. Ment. Sci. 210 (2), 96e104.
Nemeroff, C.B., 2004. Neurobiological consequences of childhood trauma. J. Clin.
psychiatry 65 (Suppl. 1), 18e28.
Non, A.L., Hollister, B.M., Humphreys, K.L., Childebayeva, A., Esteves, K., Zeanah, C.H., Fox, N.A., Nelson, C.A., Drury, S.S., 2016. DNA methylation at stress-related genes is associated with exposure to early life institutionalization. Am. J. Phys. Anthropol. 161 (1), 84e93.
Oberlander, T.F., Weinberg, J., Papsdorf, M., Grunau, R., Misri, S., Devlin, A.M., 2008. Prenatal exposure to maternal depression, neonatal methylation of human glucocorticoid receptor gene (NR3C1) and infant cortisol stress responses. Epigenetics official J. DNA Methylation Soc. 3 (2), 97e106.
Perisic, T., Zimmermann, N., Kirmeier, T., Asmus, M., Tuorto, F., Uhr, M., Holsboer, F., Rein, T., Zschocke, J., 2010. Valproate and amitriptyline exert common and divergent influences on global and gene promoter-specific chromatin modifi -cations in rat primary astrocytes. Neuropsychopharmacol. official Publ. Am. Coll. Neuropsychopharmacol. 35 (3), 792e805.
Purcell, S., Neale, B., Todd-Brown, K., Thomas, L., Ferreira, M.A., Bender, D., Maller, J., Sklar, P., de Bakker, P.I., Daly, M.J., Sham, P.C., 2007. PLINK: a tool set for whole-genome association and population-based linkage analyses. Am. J. Hum. Genet. 81 (3), 559e575.
Romens, S.E., McDonald, J., Svaren, J., Pollak, S.D., 2015. Associations between early life stress and gene methylation in children. Child. Dev. 86 (1), 303e309.
Schmittgen, T.D., Livak, K.J., 2008. Analyzing real-time PCR data by the comparative C(T) method. Nat. Protoc. 3 (6), 1101e1108.
Stein, M.B., Walker, J.R., Anderson, G., Hazen, A.L., Ross, C.A., Eldridge, G., Forde, D.R., 1996. Childhood physical and sexual abuse in patients with anxiety disorders and in a community sample. Am. J. psychiatry 153 (2), 275e277.
Stetler, C., Miller, G.E., 2011. Depression and hypothalamic-pituitary-adrenal acti-vation: a quantitative summary of four decades of research. Psychosom. Med. 73 (2), 114e126.
Straus, M.A., 1979. Measuring intrafamily conflict and violence: the Conflict tac-tics(ct) scales. J. Marriage Fam. 41, 75e78.
Tyrka, A.R., Parade, S.H., Welch, E.S., Ridout, K.K., Price, L.H., Marsit, C., Philip, N.S., Carpenter, L.L., 2016. Methylation of the leukocyte glucocorticoid receptor gene promoter in adults: associations with early adversity and depressive, anxiety and substance-use disorders. Transl. psychiatry 6 (7), e848.
Tyrka, A.R., Price, L.H., Marsit, C., Walters, O.C., Carpenter, L.L., 2012. Childhood adversity and epigenetic modulation of the leukocyte glucocorticoid receptor: preliminaryfindings in healthy adults. PloS One 7 (1) e30148.
Tyrka, A.R., Ridout, K.K., Parade, S.H., Paquette, A., Marsit, C.J., Seifer, R., 2015. Childhood maltreatment and methylation of FK506 binding protein 5 gene (FKBP5). Dev. Psychopathol. 27 (4 Pt 2), 1637e1645.
Uddin, M., Aiello, A.E., Wildman, D.E., Koenen, K.C., Pawelec, G., de Los Santos, R., Goldmann, E., Galea, S., 2010. Epigenetic and immune function profiles asso-ciated with posttraumatic stress disorder. Proc. Natl. Acad. Sci. U. S. A. 107 (20), 9470e9475.
Uddin, M., Chang, S.C., Zhang, C., Ressler, K., Mercer, K.B., Galea, S., Keyes, K.M., McLaughlin, K.A., Wildman, D.E., Aiello, A.E., Koenen, K.C., 2013. Adcyap1r1 genotype, posttraumatic stress disorder, and depression among women exposed to childhood maltreatment. Depress. anxiety 30 (3), 251e258.
Uddin, M., Koenen, K.C., Aiello, A.E., Wildman, D.E., de los Santos, R., Galea, S., 2011. Epigenetic and inflammatory marker profiles associated with depression in a community-based epidemiologic sample. Psychol. Med. 41 (5), 997e1007.
van der Knaap, L.J., Riese, H., Hudziak, J.J., Verbiest, M.M., Verhulst, F.C., Oldehinkel, A.J., van Oort, F.V., 2014. Glucocorticoid receptor gene (NR3C1) methylation following stressful events between birth and adolescence. The TRAILS study. Transl. psychiatry 4, e381.
Van Voorhees, E., Scarpa, A., 2004. The effects of child maltreatment on the hypothalamic-pituitary-adrenal axis. Trauma Violence Abuse 5 (4), 333e352.
van Zuiden, M., Geuze, E., Willemen, H.L., Vermetten, E., Maas, M., Amarouchi, K., Kavelaars, A., Heijnen, C.J., 2012. Glucocorticoid receptor pathway components predict posttraumatic stress disorder symptom development: a prospective study. Biol. psychiatry 71 (4), 309e316.
Vreeburg, S.A., Hoogendijk, W.J., van Pelt, J., Derijk, R.H., Verhagen, J.C., van Dyck, R., Smit, J.H., Zitman, F.G., Penninx, B.W., 2009. Major depressive disorder and hypothalamic-pituitary-adrenal axis activity: results from a large cohort study. Archives general psychiatry 66 (6), 617e626.
Wanklyn, S.G., Day, D.M., Hart, T.A., Girard, T.A., 2012. Cumulative childhood maltreatment and depression among incarcerated youth: impulsivity and hopelessness as potential intervening variables. Child. Maltreat 17 (4), 306e317.
Weder, N., Zhang, H., Jensen, K., Yang, B.Z., Simen, A., Jackowski, A., Lipschitz, D., Douglas-Palumberi, H., Ge, M., Perepletchikova, F., O'Loughlin, K., Hudziak, J.J., Gelernter, J., Kaufman, J., 2014. Child abuse, depression, and methylation in genes involved with stress, neural plasticity, and brain circuitry. J. Am. Acad. Child Adolesc. Psychiatry 53 (4), 417e424 e415.
Wei, J., Sun, G., Zhao, L., Yang, X., Liu, X., Lin, D., Li, T., Ma, X., 2015. Analysis of hair cortisol level infirst-episodic and recurrent female patients with depression compared to healthy controls. J. Affect. Disord. 175, 299e302.
Widom, C.S., Morris, S., 1997. Accuracy of adult recollections of childhood victimi-zation: part 2. Childhood sexual abuse. Psychol. Assess. 9, 34e46.
Widom, C.S., Shepard, R.L., 1996. Accuracy of adult recollections of childhood victimization: part 1. Childhood physical abuse. Psychol. Assess. 8, 412e421.
Yang, X., Ewald, E.R., Huo, Y., Tamashiro, K.L., Salvatori, R., Sawa, A., Wand, G.S., Lee, R.S., 2012. Glucocorticoid-induced loss of DNA methylation in non-neuronal cells and potential involvement of DNMT1 in epigenetic regulation of Fkbp5. Biochem. biophysical Res. Commun. 420 (3), 570e575.
Binder, E.B., 2015a. Holocaust exposure induced intergenerational effects on FKBP5 methylation. Biol. psychiatry 80 (5), 372e380.
Yehuda, R., Daskalakis, N.P., Desarnaud, F., Makotkine, I., Lehrner, A.L., Koch, E., Flory, J.D., Buxbaum, J.D., Meaney, M.J., Bierer, L.M., 2013. Epigenetic biomarkers as predictors and correlates of symptom improvement following psychotherapy
in combat veterans with PTSD. Front. psychiatry 4, 118.