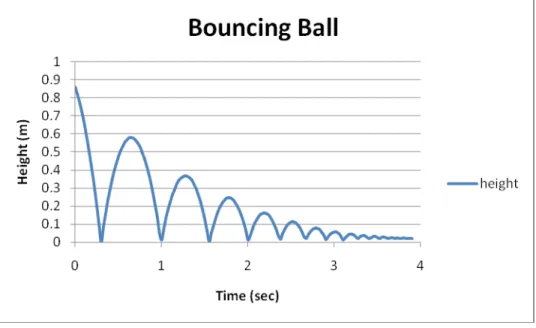
Today we are going to look at the motion of a bouncing ball.
1. Before we get started, sketch a graph of how you think the height of a dropped ball will change with time for five bounces.
2. How does your graph compare with your neighbor’s graph?
3. What features of your graph did you look at when comparing the two graphs?
What you can see from this graph is that the maximum height the ball reaches after each bounce is less than its previous maximum height. What we want to determine is if there is a relationship between the bounce number and the maximum height the ball reaches after the bounce (i.e., if you knew the ball had bounced three times, is there an equation that would predict how high the ball would go after the third bounce?).
To do this you need to find the peak heights of the ball after each bounce. The notation we will use is to let:
h0 = initial ball height
h1 = maximum height after the first bounce
h2 = maximum height after the second bounce, etc.
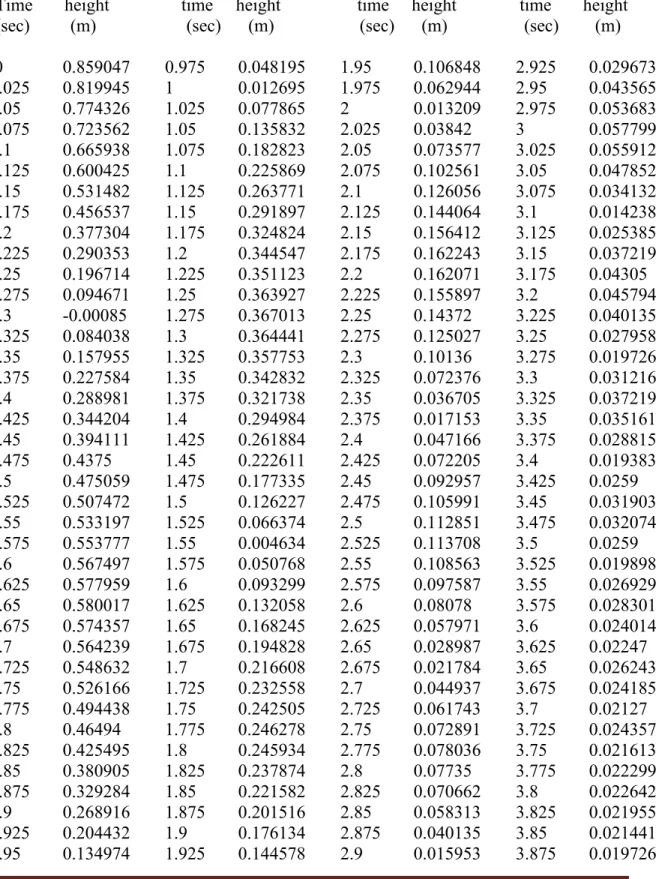
4. Table II lists the ball’s height in meters every 0.025 seconds. From this data, find the peak ball heights for the first seven bounces and record the values below:
Table I. Peak Ball Heights
Bounce number, n h (meters) h0 =
1 h1 =
2 h2 =
3 h3 =
4 h4 =
5 h5 =
6 h6 =
Table II. Bouncing Ball Data
Time height time height time height time height (sec) (m) (sec) (m) (sec) (m) (sec) (m)
3.9 0.018697
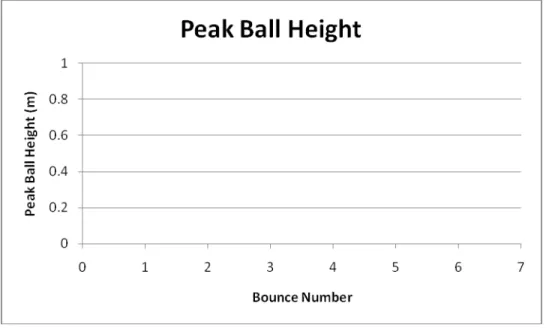
5. Sketch a graph of the peak ball height versus the bounce number.
6. Does it look like a straight line would go through your data?
If a linear equation can be used to model the peak ball height as a function of bounce number, then the difference between successive peak heights should be constant.
7. Calculate the difference between each successive peak height (i.e., h1 – h0, h2 – h1, etc.)
and enter these values Table III.
Table III. Difference between Peak Heights
Bounce number, n h
h0 = 0.859
1 h1 = 0.580
2 h2 = 0.367
3 h3 = 0.246
4 h4 = 0.162
5 h5 = 0.114
6 h6 = 0.078
7 h7= 0.058
9. Do you think this data can be represented by a linear function?
10. Another way to look at the data is to look at the ratio of successive peak heights to see if the ratio is constant. Find the ratio of h1/h0, h2/h1, h3/h2, etc.
Table IV. Ratio of Peak Heights
Bounce number, n h h0 = 0.859
1 h1 = 0.580
2 h2 = 0.367
3 h3 = 0.246
4 h4 = 0.162
5 h5 = 0.114
6 h6 = 0.078
7 h7= 0.058
11. Are these ratios approximately constant?
12. What is the average value of these ratios?
We will call the average ratio, r, and with h0 = the initial ball height,
h1= the maximum ball height after the first bounce,
h2 = the maximum ball height after the second bounce, etc.,
13. Write an equation for h1, h2, and h3 using just r and h0.
14. Does there appear to be a pattern in the way each successive peak height is calculated?
15. What is a general equation that can be used to predict the bounce height, hn, given the
initial height, h0, the bounce number, n and the peak height ratio, r?
Instructor Notes:
Learning Outcomes:
Upon completion of this module the students should be able to:
Describe the difference between a linear and an exponential function, Create a graph from a table of data, and
Find an exponential equation that fits experimental data.
Equipment: ball and tape measure
3. Curve of graph should be parabolic with each successive peak height being lower than the previous one.
6. It may look like a straight line depending on how accurately the graph was drawn.
8. no
9. no
Combined Tables I, III and IV
Bounce number, n h
h0 = 0.859
1 h1 = 0.580 -0.279 0.675
2 h2 = 0.367 -0.213 0.632
3 h3 = 0.246 -0.121 0.670
4 h4 = 0.162 -0.084 0.659
5 h5 = 0.114 -0.048 0.704
6 h6 = 0.078 -0.036 0.684
7 h7= 0.058 -0.020 0.744
11. yes
12. average value, ravg = 0.681
14. yes, each peak height is reduced by a factor of r.
15.