Chp. 12
Factors Affecting Human Pop. Size
Equation for population change
Demography
• The study of the size, composition, &
distribution of human pops, & the causes & consequences of changes in these
Demographers use:
Crude birth rate = # of live births/ 1000 people / year
• Average crude
and birth rates for various groupings of countries in
Rate of annual pop change expressed in %
70’s Rule
Doubling Time = 70
% growth rate
Good news
• Rate of increase for world’s population from 1963 – 2008 dropped from 2.2% to 1.22%
Bad news
Differences in developed & developing countries
Developed 0.1% Expected to change very little in next
50years
Developing 1.5%
Will rise from 5.2 billion (2004)
to 8 billion (2050)
Nations experiencing most growth:
FACTORS AFFECTING HUMAN
POPULATION SIZE
• The world’s 10 most populous
Declining Fertility Rates:
Fewer Babies per Women
• The average number of children that a woman bears has dropped sharply.
• Decline not low enough to stabilize the world’s population in near future.
– Replacement-level fertility: number of children
a couple must bear to replace themselves.
– Total fertility rate (TFR): average number of
Declining Fertility Rates:
Fewer Babies per Women
• The replacement level to sustain a population is 2.0 children.
• In 2008, the average global Total Fertility Rate was 2.6 children per woman.
– 1.6 in developed countries (down from 2.5 in 1950).
US Birth rate fell between 1910 -
1930
1. Industrialization/urbanization
2. Women educated/worked outside home Demographic transition –shift from high
birth rate to low birth rate
• 1956-1972 began to drop off
more women worked outside home, desired family size dropped
• 1977-2000 Echo boom – when baby boomers begin to have children
Case Study: Fertility and Birth
Rates in the United States
• Nearly 2.9 million people were added to the U.S. in 2006:
– 59% occurred because of births outnumbering deaths.
Factors affecting fertility and birth rates 1. Children as labor force
2. Cost of raising and educating children
3. Availability of pension systems 4. Urbanization
5. Education/employment opportunities for women
6. Infant mortality rate
7. Average age at marriage
8. Availability of legal abortions 9. Reliable birth control methods
Factors affecting death rates
1. Increased food supply and distribution 2. Better nutrition
3. Advances in medicine such as vaccines and antibiotics
Indicators of overall health
1. Life expectancy – average # of yrs a newborn can expect to live
Good news
• Global life expectancy – 48 (1955) to 68 (2008) in developed countries to 77
in developing countries to 67
Bad News
Infant mortality
• Best single measure of a society’s quality of life
• High infant mortality usually means under nutrition, malnutrition, high incidence of infectious diseases (usually from
Good news
1965-2008 world’s infant mortality dropped from 20 per 1,000 births to 6.3 in developed countries
and 118 to 59 in developing countries
Bad News
At least 4 million infants die of preventable disease during 1st year of life – most in developing
US Infant Mortality Rate
• Dropped from 165 in 1900 to 6.6 in 2008. • >40 countries (Cuba, Taiwan, most of
Europe) have lower infant mortality than US.
• Why?
1. Inadequate health care for mother/baby 2. Drug addiction in pregnant women
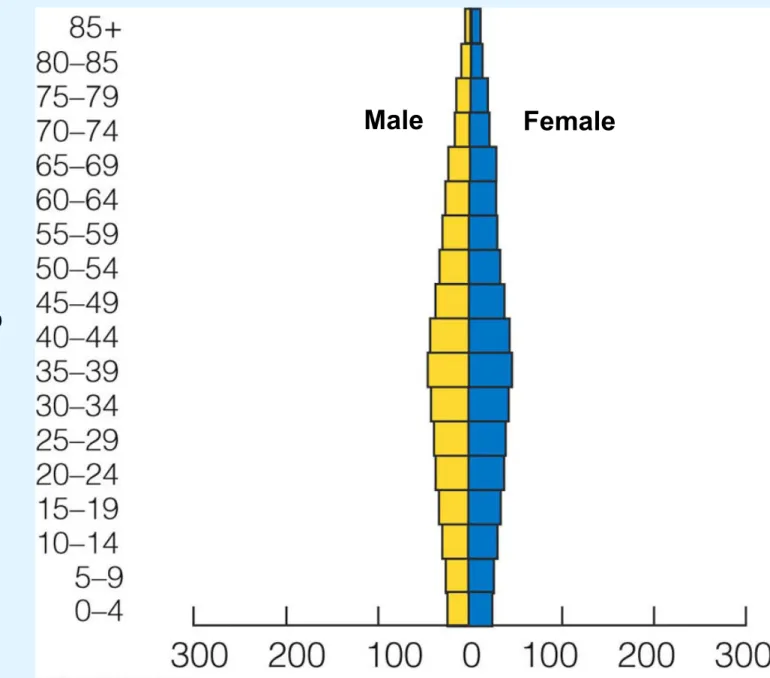
Population Age Structure
• Distribution of males and females in each age group – determines how fast a
POPULATION AGE STRUCTURE
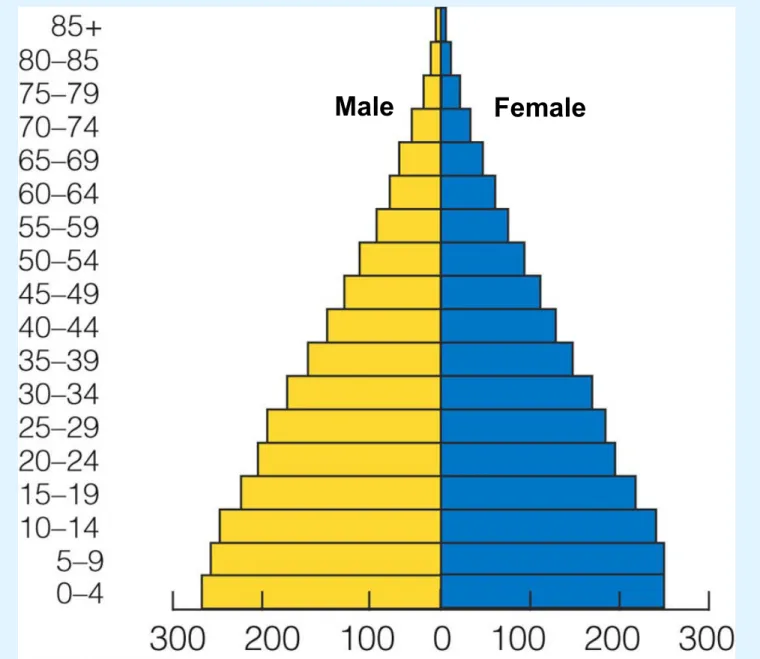
• Populations with a large proportion of its people in the prereproductive ages 1-14 have a large
Why?
People under age of 15 will move into reproductive years and begin to
Important Statistic
• 28% of people on planet were under 15 in 2008.
Fig. 9-10a, p. 179
Female
A
g
e
Population (millions) Developed Countries
Fig. 9-10b, p. 179
Female
A
g
e
Population (millions) Developing Countries
Expanding Rapidly Guatemala Nigeria Saudi Arabia Expanding Slowly United States Australia Canada Stable Spain Portugal Greece Declining Germany Bulgaria Italy
Prereproductive ages 0–14 Reproductive ages 15– 44
Postreproductive ages 45–85+ Female
POPULATION AGE STRUCTURE
Effects of Pop decline from reduced fertility
1. Labor shortages
2. Older people use a larger share of medical care
Effects from rise in death rates:
• Hunger/malnutrition kills mostly infants/children • AIDS epidemic has killed many young adults • Harmful effects include:
1. Drop in life expectancy
2. Loss of country’s most productive young adult workers
3. Increase in number of orphans
Possible solutions
• Developed countries can help by:
Reducing spread of AIDS through improved health care/education
Influencing Pop. Size:
Should we limit population growth?
• Yes: increasing pop means more enviro stress – infectious disease, biodiversity losses, fisheries
depletion, water scarcity, pollution, climate change
• No: world can
support more people, people are valuable resource for solving problems, violation of religious belief,
• Demographic Transition: As countries become economically developed, their birth and death rates tend to decline.
– Preindustrial stage: little population growth
due to high infant mortality.
– Transitional stage: industrialization begins,
death rates drops and birth rates remain high.
– Industrial stage: birth rate drops and
approaches death rate.
– Post Industrial stage: birth rate declines
Animation: Demographic Transition
Model
PLAY ANIMATION
Transition stage bottleneck
• Concern that some developing countries may get stuck in transition state.
• Shortage of skilled workers
• Lack of financial capital/other resources • Large amount of debt
How family planning helps
• Provides programs on birth spacing, birth control, health care for mothers/infants
Good news:
Responsible for at least 55% of drop in TFRs in developing countries
Reduced # of illegal and legal abortions Cut risk of maternal/fetal death from
Bad news:
• 42% of all pregnancies in developing countries are unwanted
• Many couples want to limit number of
Programs to remedy lack of family
planning
• Expanding family planning to teens and unmarried women
• Urging pro-choice and pro-life groups to join forces
• Educating men about the importance of having fewer children and taking more responsibility for raising them
Women have fewer/healthier
babies when:
• Have access to education • Paying jobs
Empowering women through
gender equality by:
• Giving full equal rights, giving access to education and paying jobs
will
Using rewards/penalties
• China: 1 child policy
China’s Family Planning Program
• Currently, China’s TFR is 1.6 children per women.
• China has moved 300 million people out of poverty.
• Problems:
– Strong male preference leads to gender imbalance. – Average population age is increasing.
Cutting global pop growth
• The best way to slow population growth is a combination of:
– Investing in family planning. – Reducing poverty.
1994 Conference on Pop &
Development Goals
1. Universal access to family planning
2. Improve health care for infants, women, children 3. Develop/implement national pop control policies 4. Improve status of women
5. Increase involvement of men in child rearing/family planning
6. Reduce poverty
HUMAN ASPECTS ON
NATURAL SYSTEMS
• Excluding Antarctica, human
activities
have affected about 83% of the earths
Animation: Resources Depletion
and Degradation
PLAY ANIMATION
US: A nation of immigrants
• Currently legal and illegal immigration account for 40% of the country’s annual pop growth.
• Since 1960 53% Latin America, Asia 25%, Europe 14%
Case Study: U.S. Immigration
• Since 1820, the U.S. has
admitted almost twice as many immigrants and refugees as all other countries combined.
Figure 9-8
Arguments: Legal/illegal
• For: diminishes role of US as place of
opportunity,
immigrants take low-paying menial jobs,
start new businesses, add cultural vitality, help US succeed in global economy
Study by UN Pop. Division
• If US wants to maintain its current ratio of workers to retirees, will need to absorb
>13 times the current immigration rate through 2050.