Performance Analysis of Mobility Impact on
IEEE 802.11ah Standard with Traffic Pattern
Scheme
Riski Muktiarto N.A
1; Doan Perdana
2; and Ridha Muldina Negara
31,2,3
School of Electrical Engineering, Telkom University Jl. Telekomunikasi No 1 Terusan Buah Batu 40257, Bandung, Indonesia
Abstract: Internet of Things (IOT) offers a new dimension of technology and information where connectivity is available anywhere, anytime, and for any purpose. IEEE 802.11 Wireless Local Area Network group is a standard that developed to answer the needs of wireless communication technology (WI-Fi). Recently, IEEE 802.11 working group released the 802.11ah technology or Wi-Fi HaLow as a Wi-fi standard. This standard works on the 1 GHz frequency band with a broader coverage area, massive device and the energy efficiency issues. This research addresses, the influence of Random Walk, Gauss-Markov, and Random Waypoint mobility model on 802.11ah with different traffic pattern scheme are analyzed. The design of the simulation system is done by changing of node density. Based on the result, it can be concluded that the overall performance of the network with all of the parameter scenarios is decreasing along with increasing the Stations. In the node density scenario, the Random Waypoint mobility model has the best performance with an average delay is about 0.65805 s, throughput is about 0.53811Mbps, PDR is about 96.75%, and energy consumption is about 5.2530 Joule.
Keywords: Restricted Access Window (RAW), IEEE 802.11ah, Traffic pattern, Random Waypoint, Random Walk, Gauss-Markov, Network Simulator 3.
1.
Introduction
Nowadays, Internet of Thing (IoT) offers a new dimension in the world of technology and information where connectivity is available wherever, whenever, and for anything. The current global trend of Internet of Thing is very rapidly evolving from the needs of users that want the efficiency of devices in various aspects in order to facilitate the user's own activities [1]. The number of connected devices being the main point of problems in IoT technology itself related to energy efficiency or energy consumption.
The IEEE 802.11 Wireless Local Area Network standard working group operating at 2.4 GHz and 5 Ghz band frequencies is a standard that developed to address the needs for wireless (Wi-Fi) communication technology problems that have a high data rate, easy to develop and lower value in cost aspect, such as Wireless Sensor Network (WSN) and Machine to Machine (M2M) communication that used in application of military, commercial, health care, monitoring of traffic, and also controlling the inventory [2][3]. In its development, the IEEE 802.11 working group released 802.11ah or Wi-fi HaLow technology as the new Wi-fi standard. This standard works on a 1 GHz band frequency with broader area coverage, more effective in cost value with an energy efficiency improvement [4]. 802.11ah provides a
shortest MAC header, segmented traffic indication map (TIM), restricted access window (RAW), and target wake time (TWT) that support the efficiency and quantity of energy used by stations (STAs). [5]
In its application, 802.11ah technology can accommodate devices or stations in large numbers and every station has their movement pattern such as static or mobile user characteristics. The movement of stations or mobility can affect the performance of the 802.11ah itself. The most commonly used mobility model according to the literature is the Random Waypoint (RMW) model [6]. Firstly, each station will go to the random destination with random speed, move towards the destination, pause on several times, then moving again towards the coordinates of the destination. Other similar mobility models such as Random Direction model, the Random Walk model, Manhattan and the Gauss-Markov mobility model are also often used in experimental simulations to obtain data that represent real condition network in the world [7].
In this research we discuss about the impact of mobility model such as Random Walk, Gauss-Markov, and Random Waypoint mobility model with the changing of traffic patterns schemes on IEEE 802.11ah standard network performances. Each of mobility model is tested with two different traffic pattern schemes, which are homogeneous traffic pattern and heterogeneous traffic pattern. In homogeneous traffic pattern, the station will send packet every X seconds, the amount of X is depending on the number of stations, the size of payload, and the total traffic load that used in the simulation. For the heterogeneous traffic pattern, the station will send data every X seconds, but X is not the same for each station. So, the stations will have two different characteristic of traffic pattern and also different movement or mobility pattern [8]. Adding the number of RAW station will make the network have some stations that access the channel via RAW mechanism and also the stations that connected to single access point. This scenario aims to analyse the performance of mobility impact in 802.11ah and knowing the best mobility model that have a best performance in every condition. Furthermore, the performance of network is measured using simulation result from Network Simulator 3. The measured output are throughput, delay, PDR, and energy consumption.
2.
Related Works
Some researches about the evaluation and improvement of IEEE 802.11ah standard have been conducted in its PHY layer and also in the MAC layer. In [5], Le-Tian with the team, have been conducted some research to implement and validate an IEEE 802.11ah module for ns-3, and in [9] research about an IEEE 802.11ah simulation module for NS-3 which tell us about the basic setting of 802.11ah standard on NS-3. In [8], they also research about evaluation on IEEE 802.11ah RAW for dense IoT network about homogeneous and heterogeneous traffic pattern. The simulation done by changing station number, traffic load and RAW mechanism. The result shows that RAW mechanism is not only increase the latency and throughput but also decrease the network’s power consumption. In [10] Qutab-ud-din and team analyse about IoT-enabling of IEEE 802.11ah Technology and the RAW mechanism with different holding schemes in non-cross slot boundary mechanism. He proposes a new holding schemes and new schemes of grouping for restricted access window or RAW mechanism based on back-off states of the stations in order to improve the throughput and also the energy efficiency saturation of the network through extensive simulation.
Yanru Wang has done the simulation about RAW mechanism feature of 802.11ah by applying probability theory and Markov Chain on it [11]. He focused on energy efficiency analysis in 802.11ah. The scope of his research is to optimizing RAW problem for IEEE 802.11ah based on the uplink communication network. He presents a scheme of novel retransmission to utilize the next empty slot to retransmit for collided devices, derive the energy efficiency of the uplink transmission, and propose an energy-aware window control algorithm to optimize the energy efficiency. Bellekens and the team evaluate seven kinds of path loss models, based on campaign of a large scale sub-urban measurement, with macro line-of sight or LoS, pico LoS, and also non-LoS by equal and also different deployments of antenna's height. they proved that the most accurate model is used and determined in combination with parameters of radio transceiver from 802.11ah station hardware to get the throughput and packet loss of MAC-Layer as a distance function [12]. In [13] investigate the 802.11ah operability as a backhaul link in order to connect devices in a long range. the compared previous IEEE 802.11 amendments (i.e. IEEE 802.11ac and 802.11n) in throughput terms by utilized the scheme of robust modulation. The result shows a good improvement on the performance of IEEE 802.11ah network in the terms of power received at long range while different packet error rates happened.
Jeongin Kim and Ikjun Yeom proposed the new of algorithm that can improve the network performance of 802.11ah. The first one is a method that can reduce the maximum delay by allocate the nodes which cannot access the channel to the preferentially reserved slot. The second one is an algorithm to change the reservation of slot duration for nodes that cannot access 802.11ah channel by collision frequency detection. It’s done using NS-3 simulator and show improvement in reducing the value of maximum delay[14]. In [15], Jain and Taneeru evaluating the network performances of 802.11ah by an analytical model using Markov chain to calculate the throughput saturation,
efficiency of energy, and average delay in the scheme of DCF. The simulation is done using MATLAB 2013.a. In Markov chain model, the basic access and RTS/CTS mechanism of retransmission counts are different. The value of throughput increasing along with retransmission counts. when the number of nodes increased, the throughput exponentially falls. They noticed that by increasing the number of nodes, the value of energy and delay in 802.11ah also increasing.
Doan Perdana has done the simulation about two ray ground propagation channel that caused by AWGN on IEEE 1609.4 standard on Gauss Markov mobility model and Random Way point mobility model, they proved that the random way mobility model has a better performance than Gauss Markov model in low density of nodes [16]. From [17] they proposed a new novel method that consist of a regrouping and a signalling process algorithm. The regrouping algorithm is proposed to minimizing the potential transmission collisions that caused by hidden node problems. The access point will acquire knowledge about the traffic requirement and potential hidden node pairs of the STAs in the network. After that the access point will regroup the STAs into several group of contention according to either an iterative updating manner decentralized or algorithm that Viterbi-like centralised. From the simulation, the proposed techniques show a good improvement to reduce the collision, and also this technique can be used in other contention based wireless network where the MAC protocol support grouping mechanism.
3.
Scenario and System Design
The simulations on this research were performed on Network Simulator 3 release 3.23 with 802.11ah module which has been modified according to [18].
The node density scenario aims to analyse the mobility model impact on 802.11ah with different traffic pattern. Simulations were performed on 50 until 300 nodes with an increase in the number of RAW stations by 20% of the total number of nodes in the simulation.
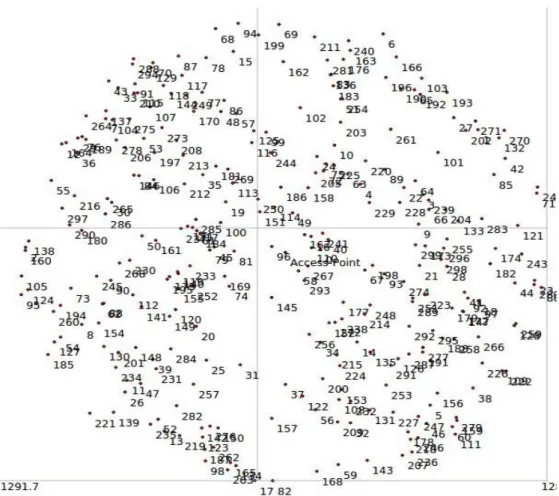
In the simulation topology, it was placed one Access Point and 50 until 300 nodes of STA around it that illustrated in Fig 1. This research focuses on RAW mechanism in MAC layer of 802.11ah standard. The other features such as TIM segmentation and TwT were not implemented in the simulation.
simulation are shown in table 1 and the flowchart system is presented in figure 3.
Table 1. Simulation Parameters
Parameters Value
Physical Layer WLAN/ IEEE 802.11
Transport Layer UDP
Payload Size 256 Bytes
Rho 300
Number of STA 50 - 300
Number of AP 1
MCS
MCS 5 (1 Mhz bandwidth and 2400
Kbps data rate)
RAW Group 2
RAW Slot 1
Index of randomness (α) 0.85
Figure 1. Flowchart System
4.
Result and Evaluation
The output from the simulation is QoS parameters such as delay, throughput and PDR and energy consumption for node density scenario in IEEE 802.11ah standard with mobility model and different traffic pattern schemes which are shown in figure 4 – figure 11. Figure 4. shows the effect of increasing the number of stations to the delay that obtained from simulations on 3 types of mobility model with a homogeneous traffic pattern scheme. From the graph above, it can be seen that generally the value of delay that obtained from Random Walk mobility model is greater than the other
types of mobility model with an average delay is about 0.88039 s. In 200 stations condition, there is an increasing on delay value up to 37.84% for Random Walk mobility model, and up to 41.06% for Random Waypoint mobility model from its lowest condition.
Figure 4. Delay value on homogeneous traffic pattern
As for Gauss-Markov mobility model achieves the highest delay value when the number of station at 300 stations, there is an increasing on delay value up to 40.92% from its lowest condition. In this scheme, as we can see from the result in the terms of average delay, that the Random Waypoint mobility model has the best stability rate than the other mobility with the lowest average delay value than the others mobility model is about 0.84983 s.
Figure 5. Delay value on heterogeneous traffic pattern
As we can see from the figure 5, the Gauss-Markov mobility model has the highest delay value compared to the other mobility models. Based on the graph above, the trend of increasing delay value is clearly shown when the network has 200 until 300 of total stations in heterogeneous scheme. At that time of the simulation, the highest delay value is obtained when the network condition reach 300 stations. There is an increasing on delay value up to 99.94% for Random Waypoint mobility model, 99.944% for Random Walk mobility model, and 99.80% for Gauss-Markov from its lowest point. The largest of average delay is owned by Gauss-Markov mobility model which is about 0.50048 s. As we can see from this scheme, that the Random Walk mobility model is the most stable mobility model among the other mobility model when its analysed from the delay parameters, with 0.43255 s of the average delay value.
generated randomly and not as dense as the homogeneous traffic pattern scheme, so the delivery process runs more smoothly and has a smaller delay value than the homogeneous traffic pattern.
From the three types of mobility model that simulated on the heterogeneous and homogeneous traffic pattern schemes, with delay value as the test parameters, it was found that the Random Waypoint mobility model has better performance compared to the other mobility model. This is shown by the average delay value from Random Waypoint mobility model on the both schemes about 0.65805 s. As for the largest average delay in both schemes is owned by Gauss-Markov mobility model, with delay value is about 0.67889 s. This condition happens because the Random Waypoint mobility model has a pause time parameter that makes the station stay still in a few moments before moving again. At the moment of pause time, the communication between the access point and the station will become more smoothly, so the information delivery process becomes much better than when its moving. And also because of the Gauss-Markov mobility model has an alpha parameter as a tuning-point in their movement so the movement pattern is more dynamically than other mobility model and interrupt the data transmission process.
Figure 6. Throughput value on homogeneous traffic pattern
From the figure 6, when the simulations are performed, the Gauss-Markov mobility model has the lowest throughput value compared to other types of mobility model. For Random Waypoint mobility model, and Random Walk model has the smallest throughput value that obtained from the network when has 300 amounts of stations. In that condition the value of delay is decreasing until 17.39% for Random Waypoint mobility model, and 17.36% for Random Walk mobility model from their lowest condition. Based on the simulation results, the largest throughput value is obtained when the network has 50 amounts of stations, with the largest throughput value owned by Random Waypoint mobility model about 0.61761 Mbps, followed by Random Walk model about 0.61615 Mbps, and Gauss-Markov mobility model about 0.41840 Mbps. In this scheme as we can see in terms of average throughput, the Random Waypoint mobility model has the best stability level compared with other mobility model, with the highest average throughput value is about 0.574189 s.
Figure 7 shows the influence of mobility model against throughput value that obtained based on the changing the number station up to 300 nodes. It can be seen that the Random Walk mobility model has the greatest throughput value compared to other mobility types. The largest increase in throughput value occurs when the network has 250 stations, where the value is increasing up to 75.82% for
Random Waypoint model, and 78.00% for Random Walk mobility model from their lowest condition.
Figure 7. Throughput value on heterogeneous traffic pattern
As for the Gauss-Markov mobility model, the greatest increase occurs when the network conditions have 200 stations. There was an increase of throughput value up to 72.63% from its lowest condition. Based on the simulation results, the lowest throughput value is obtained when network conditions have 50 stations, with the lowest throughput value owned by the Gauss-Markov mobility model of 0.165069 Mbps. In this scheme, from the average throughput, we can see that Random Waypoint mobility model has the best stability level compared with the other mobility model with the average of throughput value is about 0,502042 Mbps.
The decrease of throughput value in the homogeneous traffic pattern scheme occurs as a result of the increasing number of stations, the more stations accommodated in a single access point accessed simultaneously resulting in full access channels, and reduced performance of network throughput, as well as because of the packet delivery interval continues to send packets during the simulation that running on the homogeneous traffic pattern scheme, thus minimizing the throughput value obtained. So, the greater the number of nodes being used the smaller the throughput will also be obtained. This is contrast to the heterogeneous traffic pattern scheme that obtained from the simulation, the value of throughput obtained increases, although it has the same station scale as the heterogeneous scheme, the delivery intervals given at each station are not as dense as the homogeneous scheme so the throughput value remains good when the number of stations increases.
Out of the three types of mobility tested on heterogeneous and homogeneous traffic pattern schemes, with throughput as test parameters, it was found that Random Waypoint mobility model has better stability compared to other types of mobility, this is proved by the average mobility throughput in both schemes of 0.5381158 Mbps. As for the lowest average throughput value in both schemes is owned by Gauss-Markov mobility model, with a value of 0.467256 Mbps. This is because the Gauss-Markov mobility model has an alpha parameter that becomes the tuning-point in the movement so that the movement pattern is more dynamic than the other mobility and interrupt the data transmission process so that the throughput value will decrease.
point in the value of PDR occurs when network conditions have a total 300 stations, with the largest decrease of PDR is owned by Random Waypoint mobility model of 7.07% from its largest condition.
Figure 8. PDR value on homogeneous traffic pattern
While the lowest PDR value is owned by Gauss-Markov mobility model by 91%, with average decrease of 4.21% from the best condition. It is followed by Random Waypoint model of 92% with an average decrease of PDR of 7.07%, and Random Walk mobility model of 93% with an average decrease of 5.10% from their best conditions. In this scheme it can be seen from the aspect of PDR, that Random Waypoint mobility model has the best stability level compared to other mobility with the biggest average PDR value from the other type of mobility model is about 95.33%.
Figure 9. PDR value on heterogeneous traffic pattern
From figure 9, the PDR value for all mobility models has decreased the network performance. This happens due to the increasing number of stations used, the more stations try to access the channel, which causes the possibility of collision becomes larger, so that it can causing the packet to be a lot of loss. The number of packet loss is what causes the value of PDR to decline.
Out of the three types of mobility tested on the heterogeneous and homogeneous traffic pattern schemes, with PDR as the test parameters, it was found that the Random Waypoint mobility model has a better stability rate compared to other mobility models. This is proved by the average PDR of mobility in both schemes up to 96.75%. As for the lowest average PDR value in both schemes are owned by the Gauss-Markov mobility model, with an average PDR value is about 95.08%. This is caused by the Gauss-Markov mobility model has an alpha parameter that becomes the tuning point of the movement so that the movement pattern is more dynamic than the other mobility and interrupt the data transmission process.
Figure 10. shows the effect of increasing the number of stations on the value of energy consumption obtained and performed on 3 types of mobility model with a homogeneous traffic pattern scheme. In general, it can be seen that there is an increase in energy consumption value when the network condition is given the addition of station number. Based on the graph above, the largest increase in energy consumption occurs when network conditions have a total of 300 stations, with the largest energy consumption value owned by Gauss-Markov model of 7,875 Joule with an increase in energy consumption by 31.39% of its lowest value. It is followed by a Random Waypoint model of 5.78 Joule with an increase in energy consumption of 1.43%, and a Random Walk model of 5.64 Joule with an increase in energy consumption of 3.52% of the lowest conditions.
Figure 10. Energy consumption on heterogeneous traffic pattern
In this scheme, it can be seen from the aspect of energy consumption that the type of Random Walk mobility model has the best stability level when compared with other mobility with the average value of the lowest energy consumption value of other types of mobility of 5.67253 Joule.
Figure 11. Energy consumption on homogeneous traffic pattern
conditions. In this scheme, it can be seen in terms of magnitude of energy consumption that the type of Random Waypoint mobility model has the best stability level compared with other mobility with the average value of the lowest energy consumption value when compared with other types of mobility of 4,821 Joule.
This increase occurs because along with the increasing number of stations accessing access points, the much dense access channels are used, and the reduced number of idle channels so that communication will continue and the consumption of energy used is increasing. Out of the three types of mobility tested on heterogeneous and homogeneous traffic pattern schemes, with energy consumption as the test parameters, it was found that the Random Waypoint mobility model has better stability compared to other types of mobility, as evidenced by the average energy consumption mobility in both schemes is 5.25302 Joule. As for the average value of the largest energy consumption in both schemes is owned by Gauss-Markov mobility model, with a value of 5.77026 Joule. This is caused by the Random Waypoint mobility model has a pause time parameter that causes the station to stop for a while before moving back, so the data transmission process will be more smoothly when station condition is paused, while in Gauss-Markov mobility model has alpha parameter which become tuning point on the movement so that the movement pattern is more dynamic than other mobility and interrupt the data transmission process and result in increased energy consumption required.
5.
Conclusions
In the node density change scenario, the network performance value will decrease along with the increasing number of station, this is because the much number of stations that served by one access point, the busier channel access that being used. The most stable mobility model during the simulation in the first scenario is the Random Waypoint mobility model with the average delay in the both proposed scheme is about 0.65805 s, the average throughput is about 0.53811 Mbps, the average PDR is about 96.75%, and the energy consumption is about 5.25302 Joule.
The use of various types of mobility in the 802.11ah standard with heterogeneous and homogeneous traffic patterns has its own influence in network performance. It can be concluded that the best mobility model in the proposed scheme is Random Walk mobility model while the Gauss-Markov mobility is showing the lowest performances compared to the other models. This is because the Random Waypoint mobility itself has pause time parameters that make the station stay still in a few moments before moving again, at that pause time, so the communication between access point and station will become more smoothly so the process of sending information becomes better than when it’s on moving condition, while at Gauss-Markov mobility has an alpha as a tuning parameter that makes the movement of Gauss-Markov mobility model’s stations more dynamic than the others.
References
[1] I. Khan, “Performance Analysis of 5G Cooperative-NOMA for IoT-Intermittent Communication,” Int. J. Commun. Networks Inf. Secur. 314, vol. 9, no. 3, pp. 314– 322, 2017.
[2] E. Aljarrah, “Deployment of multi-fuzzy model based routing in RPL to support efficient IoT,” Int. J. Commun. Networks Inf. Secur., vol. 9, no. 3, pp. 457–465, 2017. [3] D. Perdana, F. Dewanta, I. Prasetya, and D. Wibawa,
“Extending Monitoring Area of Production Plant Using Synchronized Relay Node Message Scheduling,” Int. J. Commun. Networks Inf. Secur., vol. 9, no. 1, pp. 111–116, 2017.
[4] W. Sun, M. Choi, and S. Choi, “IEEE 802.11ah: A Long Range 802.11 WLAN at Sub 1 GHz,” J. ICT Stand., vol. 2, no. 2, pp. 83–108, 2014.
[5] O. Raeesi, J. Pirskanen, A. Hazmi, T. Levanen, and M. Valkama, “Performance evaluation of IEEE 802.11ah and its restricted access window mechanism,” 2014 IEEE Int. Conf. Commun. Work. ICC 2014, no. September, pp. 460– 466, 2014.
[6] K. Rupinder and S. Gurpreet, “Survey of Various Mobility Models in VANETs,” Int. J. Eng. Comput. Sci., vol. 3, no. 3, pp. 4073–4080, 2014.
[7] R. F. S. Doan Perdana, Muhammad Nanda, Revient Ode, “Performance evaluation of PUMA routing protocol for Manhattan mobility model on vehicular ad-hoc network,”
22nd Int. Conf. Telecommun. (ICT 2015), no. Ict, pp. 80– 84, 2015.
[8] L. Tian, J. Famaey, and S. Latr, “Evaluation of the IEEE 802 . 11ah Restricted Access Window Mechanism for dense IoT networks,” Conf. Int. Symp. a World Wireless, Mob. Multimed. Networks, vol. 17, no. May, 2016. [9] T. Report and S. Latr, “An IEEE 802 . 11ah simulation
module for NS-3,” Affil. Univ. Antwerp, no. January, pp. 1–5, 2016.
[10] M. Qutab-Ud-Din, A. Hazmi, B. Badihi, A. Larmo, J. Torsner, and M. Valkama, “Performance analysis of IoT-enabling IEEE 802.11ah technology and its RAW mechanism with non-cross slot boundary holding schemes,” Proc. WoWMoM 2015 A World Wirel. Mob. Multimed. Networks, 2015.
[11] Y. Wang, Y. Li, K. K. Chai, Y. Chen, and J. Schormans, “Energy-Aware adaptive restricted access window for IEEE 802.11ah based smart grid networks,” 2015 IEEE Int. Conf. Smart Grid Commun. SmartGridComm 2015, pp. 581–586, 2016.
[12] B. Bellekens, L. Tian, P. Boer, M. Weyn, and J. Famaey, “Outdoor IEEE 802 . 11ah Range Characterization,”
GLOBECOM 2017 - 2017 IEEE Glob. Commun. Conf., vol. 4–8 Dec., 2017.
[13] V. Banos, M. S. Afaqui, E. Lopez, and E. Garcia, “Throughput and Range Characterization of IEEE 802.11ah,” IEEE Lat. Am. Trans., vol. 15, no. 9, pp. 1621– 1628, 2017.
[14] J. Kim and I. Yeom, “QoS enhanced channel access in IEEE 802.11ah networks,” 2017 17th Int. Symp. Commun. Inf. Technol., pp. 1–6, 2017.
[15] P. C. Jain and S. Taneeru, “Performance Evaluation of IEEE 802.11ah Protocol in Wireless Area Network,” 2016 Int. Conf. Micro-Electronics Telecommun. Eng., pp. 578– 583, 2016.
[16] D. Perdana and R. F. Sari, “Performance evaluation of corrupted signal caused by random way point and Gauss Markov mobility model on IEEE 1609.4 standards,” 4th Int. Symp. Next-Generation Electron. IEEE ISNE 2015, 2015.
[17] Z. Zhu, Z. Fan, and F. Zhong, “A station regrouping method for contention based IEEE 802.11ah wireless LAN,” 2017 IEEE 13th Int. Conf. Wirel. Mob. Comput. Netw. Commun., 2017.
no. January, pp. 49–56, 2016.
[19] C. Olariu, “Quality of Service Support for Voice over IP in Wireless Access Networks,” Waterford Institute of Technology, 2013.
[20] M. Elkotob and K. Andersson, “Analysis and measurement of session setup delay and jitter in vowlan using composite metrics,” MUM’08 - Proc. 7th Int. Conf. Mob. Ubiquitous Multimed., no. July, pp. 190–197, 2008.
α = 0 α = 0.2
α = 0.4 α = 0.5
α = 0.6 α = 0.85
α = 0.95 α = 1