http://www.sciencepublishinggroup.com/j/eas doi: 10.11648/j.eas.20190402.13
ISSN: 2575-2022 (Print); ISSN: 2575-1468 (Online)
Integration and Evaluation of the Impact of Distributed
Generation on the Protection System of Distribution
Network with DG Using Etap
Modu Abba Gana
1, *, Usman Otaru Aliyu
2, Ganiyu Ayinde Bakare
21Department of Electrical & Electronics Engineering, University of Maiduguri, Maiduguri, Nigeria 2
Department of Electrical & Electronics Engineering, ATB University, Bauchi, Nigeria
Email address:
*
Corresponding author
To cite this article:
Modu Abba Gana, Usman Otaru Aliyu, Ganiyu Ayinde Bakare. Integration and Evaluation of the Impact of Distributed Generation on the Protection System of Distribution Network with DG Using Etap. Engineering and Applied Sciences. Vol. 4, No. 2, 2019, pp. 44-51. doi: 10.11648/j.eas.20190402.13
Received: February 28, 2019; Accepted: May 9, 2019; Published: June 12, 2019
Abstract:
Distributed Generation (DG) has been growing rapidly in deregulated power systems due to their potential solutions to meeting localized demands at distribution level and to mitigate limited transmission capacities from centralized power stations. Penetration of DG into an existing distribution system has so many impacts on the system. Despite the benefits a DG will provide; it has a negative impact on the power system protection, thus affecting both reliability and stability of the system. This paper evaluates the impact of DG on the power protection systems with DG integrated in the systems. IEEE 33 Bus system was modelled in full operational details using ETAP. Protection coordination was carried out using Modified PSO. To investigate the impact of DG on the protection systems, different fault scenario have been simulated with and without DG installed. The fault current level, false tripping, unintentional islanding, and behavior of the existing protection system were investigated considering two scenarios. Case one was the integration of single DG while case two was the integration of two DGs. The type of DG integrated was solar photovoltaic. Simulation results revealed that the fault current level for a 3 phase fault at bus 27 for the system increases by 2.5% for case one and 24% for case two. There was unitentational islanding and false tripping as a result of the current contribution from the DG. The sequence of operation of the protective devices clearly showed that there was mis coordination of the protective devices.Keywords: Distributed Generation, Protection System, Modified Particle Swarm Optimization, ETAP
1. Introduction
Distributed Generation (DG) has been growing rapidly in deregulated power systems due to their potential solutions to meeting localized demands at distribution level and to mitigate limited transmission capacities from centralized power stations. Penetration of DG into an existing distribution system has so many impacts on the system especially the protection system.
In power systems, protection system can be defined as an art of determining fault in the system with a view to isolate it to ensure continuous operation of the healthy section. Typical distribution systems were designed to operate with radial configuration in which power flows from the source towards
the connected customers, so the protection coordination of the radial system is very simple in nature. [1]. The distribution system contains protective devices such as fuses, reclosers, relays and circuit breakers. These protective devices are coordinated in such a way to interrupt the unidirectional flow of the fault current from the source end towards the fault point. Integration of DG within the distribution system. Integration of the DG within a distribution system changed the configuration of power flow for a conventional network from a unidirectional to multidirectional system giving rise issues related with the protection system [2].
network was used for the study. The optimal placement and sizing of DG was done using Modified Particle swarm optimization and ETAP software was used for the modelling and evaluation of the impact.
2. Problem Formulation for DG
Placement
In this paper the objective of the placement technique for the DG is to minimize the real power loss and to improve the voltage profile at the distribution level. The real power loss reduction in a distribution system is required for efficient power system operation.
The loss in the system can be calculated using (1) [3], called the ‘exact loss formula’ given the system operating conditions.
The objective of the placement technique is to minimize the total real power loss and improved voltage profile. Mathematically, the objective function can be written as:
= ∑ | | (1) Subject to power balance constraints.
∑ = ∑ + (2) : | |! "≤| |≤| |!#$ (3)
% & : ' ('' ('!#$ (4) Where i is the number of bus, N is the total number of Buses, is the real power loss in the system, is the real power generation of DG at bus i, is the power demand at bus i, ( is the current between buses i and j and is the resistance. The current is determined from the load flow using Hybrid load flow studies Method called Backward – Forward and Newton Raphson. For single source network all the power is supplied by the source but with DG that are optimally placed there is going to be reduction in power loss [4]. This reduction in power loss is determined as the difference of the power loss with DG and without DG. Thus, the new power loss in the network with DG is:
)"*+= ∑ | "*+| (5)
) "*+= ∑ -2- - - (6)
Where j=1for a feeder with DG or else j = 0 Hence, the power loss reduction value for bus i with DG is obtained by subtracting (5) from (6) as;
PLR = ) "*+ - (7)
PLRi = - ∑ (2- + - ) (8)
The bus that gives the highest value of PLR is selected as the optimal location of DG. The emphasis is to place the DG at a location that will give maximum loss reduction. To obtain the DG current that will give maximum loss reduction, equation (8) is differentiated with respect to IDG and equated
to zero, hence the current is given by equation (9) below [5]
IDG1= −∑ 12343
5 367
∑536743 (9)
The procedure is repeated for all the buses in order to obtain the highest power loss reduction value as the DG units are singly located. Assuming there is no significant changes in the voltage as DG units are connected, the power that can be generated is;
= (10)
Where V is the voltage magnitude of the bus i and the optimum DG size is obtained from equation (10). The optimal location of the DG is bus i for maximum power loss reduction.
2.1. Protection System Coordination Using MPSO
Protection of power system is typically tuned in such a way that only the faulted part of the system gets removed when a fault occurs. This tuning is called protection coordination and this becomes worse when DGs are connected because they can negatively affect the system coordination. [6]
The coordination of OCRs could be achieved by determining two setting values: the pickup current (Ip) and the time dial setting (TDS). The pickup current is the minimum current value for which the relay begins to operate. The TDS adjusts the inverse characteristics of overcurrent device, and hence controls the time delay before relay operates if the fault current reaches a value equal or greater than the pickup current. [7].
The coordination of the relay time settings was done using the following formulae as given in [8] before the integration of DG.
89= :;< =(?@>
?A)B) + CD
(11)
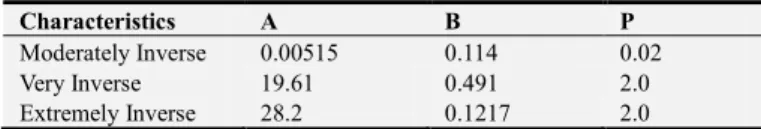
Where 89 is the relay operating time in sec, :;< is the time dial setting of the relay, E is the fault current at the point of corresponding relay breaker location, F is the pickup current setting for the relay. A, B and p are the standard constants defined [9] based on relay characteristics as follows.
Table 1. Relay Characteristics (IEEE Standard 1366, 2012).
Characteristics A B P
Moderately Inverse 0.00515 0.114 0.02
Very Inverse 19.61 0.491 2.0
Extremely Inverse 28.2 0.1217 2.0
∑ ("I 89. H) (12)
Where n is the number of relays in the system and ( 89.k) is the operating time of the relay J
The objective function is subjected to the following set of constraints.
The requirement of selectivity dictates that when a fault occurs, only the primary relay should operate to trip the fault. If the main relay fails to extinct the fault, the backup relay should clear the fault after a pre specified delay time. It is normally set between 0.2 and 0.5s. [11] In order to satisfy such requirement, the following constraint must be added.
:K#LJM9 - :!# "≤ : (13) Where :!# " and :K#LJM9are the main and backup relays operation time respectively.
The coordination time interval CTI is the minimum time gap in operation between the primary and backup relays. [12] There is always a range for each relay setting, from which feasible solutions are encountered. Therefore other constraint should be considered on the limits of relay parameters including TDS and Ip settings that can be expressed as follows.
:;<! " ≤ :;< ≤:;<!#O (14) P! " ≤ P ≤ P!#O (15)
Where :;< ! " and :;< !#$, and P! " and P!#O are minimum and maximum limits of the time dial settings and pickup current respectively. The minimum pickup current setting of the relay usually depends on the maximum load current passing through it, while the maximum pickup current setting can be chosen based on the minimum fault current passing inside the coil of the relay.
2.2. Modified PSO (MPSO)
Standard PSO uses both current global best and the local best, represented by !,"RS8K#S K*TU and !,"S8L#S K*TUrespectively to update the position and velocity. The purpose of local best is to increase the diversity in the quality solution. However, this same diversity can be simulated with some randomness. There is no need to use individual best until and unless the optimization problem of interest is highly non-linear. In a simplified version of PSO, the global best can accelerate the convergence of an optimization algorithm. [13] Hence the velocity vector at k+1 iteration can be generated by the following equation (16).
!,""*+ = !,"8SV + W× Y (H) + Z × ( !,"RS8K#S K*TU − !,"8SV) (16)
Where W Y Z are the acceleration constants and randn is random variable with values from 0 to 1.
The update of the position at new iteration is simply by
!,""*+ = !,"8SV + !,""*+ (17)
Where m = 1, 2…y and n = 1, 2…. z
In order to increase the convergence even further, we can write the update of position in single step as
!,""*+ = (1− Z) !,"8SV + Z !,"RS8K#S + W randn (k) (18)
The values of W is from 0.1 to 0.5 and the value of Z is from 0.1 to 0.7.
2.3. MPSO Implementation
Optimal DG placement and sizing to reduce the power loss in distribution system using MPSO based method takes the following steps.
Step 1. Read the input data including bus data and branch data, base voltage, base MVA, desired accuracy (1× 10) ]) of system.
Step 2. Calculate the power loss of each branch and voltage of each node using forward backward load flow.
Step 3. Set the number of iteration, number of particles, W Y Z values.
Step 4. Generate the initial population randomly for velocity ^ and position P.
Step 5. Calculate total power loss for each particle using forward backward load flow.
Step 6. Check out the system constraints.
Step 7. Compare the objective function from individual
best for each particle.
Step 8. Select the particle associated with lowest individual pbest and set this value as gbest.
Step 9. Update the particle's velocity. Step 10. Update the particle's position.
Step 11. Check the number of iteration reaches to the final value, if it so then go to next step otherwise go step 6 for k = k+1. Step 12. Print the optimal solution. This will be the best solution for optimal placement and sizing of DG in radial distribution system.
3. Evaluation of Impact of Distributed
Generation
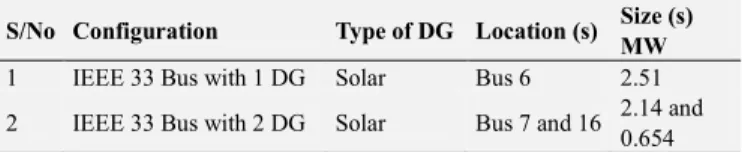
3.1. Optimal Location and Size of DG
Table 2. Optimal location and sizes of DGs.
S/No Configuration Type of DG Location (s) Size (s) MW
1 IEEE 33 Bus with 1 DG Solar Bus 6 2.51
2 IEEE 33 Bus with 2 DG Solar Bus 7 and 16 2.14 and
0.654
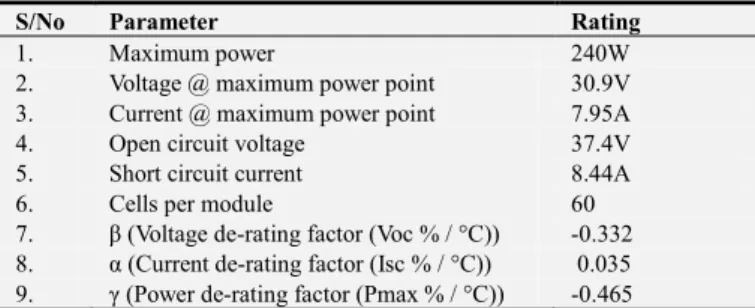
3.2. Solar Photovoltaic Design
mass. Basic features of the used modules are presented in Table 2 [14]
V (T) =V@25 C (1 + β × ∆T)
Where Z is the temperature de-rating factor shown in table 2.
Table 2. Basic features of the PV modules.
S/No Parameter Rating
1. Maximum power 240W
2. Voltage @ maximum power point 30.9V
3. Current @ maximum power point 7.95A
4. Open circuit voltage 37.4V
5. Short circuit current 8.44A
6. Cells per module 60
7. β (Voltage de-rating factor (Voc % / °C)) -0.332 8. α (Current de-rating factor (Isc % / °C)) 0.035 9. γ (Power de-rating factor (Pmax % / °C)) -0.465
Table 3. Features of the ABB 1 MW central inverter.
S/No Parameter Rating
1. Rated power 1000 Kw
2. Maximum power 1200 kW
3. DC voltage range (MPPT) 600-850 V
4. Maximum DC voltage 1100 V
5. Maximum DC current 1710 A
S/No Parameter Rating
6. DC inputs 8-20 A
7. Nominal AC voltage 400 V
8. Nominal AC current 1445 A
3.3. Modelling IEEE 33 Bus Distribution Network
IEEE test system has 33 bus and 32 sections with the total load of 3.72 MW and 2.3 MVAR. Base MVA 100, conductor type is All Aluminum Alloy Conductor (AAAC), Base voltage 11kV, Resistance of 0.55per km and reactance of 0.35ohm per km. [6] In ETAP IEEE 33 Bus Model was created in edit mode with the configuration status set to normal. ETAP’s electrical system diagram is a one line representation of balanced three phase system. [15]. It was constructed graphically by connecting the buses, branches, transformers and protective devices from the one line diagram edit toolbar. Elements were graphically connected to the buses by using info page of the device property editor. The property editor was opened by double clicking on the element. The engineering properties of the element such as ratings, settings, loading, connection etc. were assigned using the editor. The DG (solar PV) were designed and placed at the optimal location as suggested by the MPSO. The ETAP Model of the system is shown in Figure 1.
Figure 1. ETAP Model of IEEE 33 Bus test system with protective devices and switches.
4. Results for Evaluation of Impact of Distributed Generation
4.1. Short Circuit Current Level Simulation Results
Table 3. Fault current level with 1 DG and without DG.
Distribution
Network DG Location Fault At
Fault current (kA) With out DG Fault current (kA) With 1 DG
3LLL 2LLG 2LL 1LG 3LLL 2LLG 2LL 1LG
IEEE 33 Bus System Bus 28 Bus 27 3.554 3.481 3.078 2.470 3.614 4.037 3.130 3.682
IEEE 33 Bus System Bus 28 Bus 29 3.120 3.025 2.702 2.096 3.186 3.624 2.759 3.448
Table 4. Fault current level with 2 DG and without DG.
Distribution
System DG Location (s) Fault At
Fault current (kA) With out DG Fault current (kA) With 2 DG
3LLL 2LLG 2LL 1LG 3LLL 2LLG 2LL 1LG
IEEE 33 Bus
System Bus 18 & 33 Bus 17 2.024 1.933 1.768 1.251 4.177 5.358 3.618 5.312
IEEE 33 Bus
System Bus 18 & 33 Bus 32 2.963 2.856 2.566 1.917 3.667 5.741 3.176 5.297
(a)
(b)
(a)
(b)
Figure 3. (a) Fault Current for IEEE 33 Bus with 2 DG at Buses 18 & 33 and fault at Bus 17 (b) fault at Bus 32.
4.2. Coordination Simulation Result
To investigate the impact of DG on protection coordination, the networks was modelled and simulated using ETAP software. The sequence of operation of the protective devices are shown in Table 5 for a three phase to ground fault.
Table 5. Sequence of Operation of Protective Devices.
Power system DG Location (s) Faulted Bus
Actual tripping Correct Tripping
Primary Backup Primary Backup
IEEE 33 Bus with 1 DG Bus 28 Bus 29 Fuse A3 DG1 Relay, Main Relay Fuse A3 Main Relay
IEEE 33 Bus with 2 DG Bus 18 & 33 Bus 19 Fuse A4 Lateral Fuse 1, Main Relay Fuse A4 Recloser 1, Main Relay
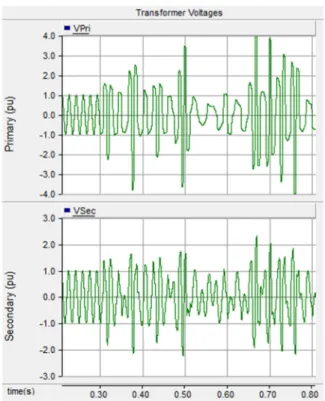
4.3. Ferro Resonance Result
To verify the existence of Ferro resonance in the distribution network when there is circuit breaker or fuse failure, we simulated part of the network using PSCAD. At the 33/11 kV injection substation with 7.5 MVA power transformer, switch was opened on phase B at the time of 0.1s and closed at 0.5s. The bus voltage and the Transformer primary and secondary voltages were plotted in Figures 4 and 5.
Figure 4. Transformer Bus Voltage.
Figure 5. Transformer Primary and Secondary Voltage 5. Discussions.
5. Discussions
5.1. Fault Current Level
In this research, effort has been to study the impact of distributed Generation on power protection system of a distribution network with distributed energy resources. From the analysis it is clear that DG negatively affects the distribution system by the changing the radial nature of the
network and the fault current. As the number of DG increases the fault current also increases since the fault current is sum of the current contribution from all the sources. However, in a situation where the DG is placed at the extreme of the feeder it reduces the reach of the relays. This is due to the fact that DGs that are placed at the extreme of the feeder increase the equivalent impedance of the feeder which decreases the fault current.
5.2. Coordination
As a result of the change in the fault current, issues like mis coordination, improper sequence of operation, islanding and false tripping of the protective devices has been observed as reported in Table 5. The initial settings of the protective devices can no longer hold as the Time dial setting, pick up current and the operating time of the devices are function of the fault current.
5.3. Ferro Resonance
There was also an instance of Ferro resonance when the malfunction of protective device was studied. When a fuse that protects a transformer in the three phases do not trigger simultaneously or a breaker malfunction, it happens that a transformer is connected only via two phases for a short time. Then, the capacitance of the cable is in series with the transformer inductance what could cause distorted / high voltages and currents due to resonance conditions which may lead to damage to customer equipment or transformer.
6. Conclusions
This work investigates the protection issues that can arise when DG is integrated in to distribution network using ETAP software. Firstly, solar DGs with optimal size were integrated in to a model of IEEE 33 Bus test system in ETAP. Secondly, different fault scenarios with and without DG were simulated. The result showed that DG integration can change the fault current level and, consequently, coordination of protective devices. Unintentional Islanding, sympathetic tripping and Ferro resonance can also occur.
References
[1] Adefarati, T., & Bansal, R. C. (2016). Integration of renewable distributed generators into the distribution system: a review. IET Renewable Power Generation, 10 (7), pp. 873-884.
[2] MCV Suresh and Belwin Edward J (2017)” Optimal placement of distributed generation in Distribution systems by using shuffled frog leaping algorithm” ARPN Journal of Engineering and Applied Sciences Volume. 12, No. 3. [3] Moravej Z. (2012) optimal coordination of distance and
overcurrent relays in series compensated systems based on MAPSO. Energy conversion and Management. Vol 56 pp 140–151.
Bus Voltages
time(s) 0.5700 0.5750 0.5800 0.5850 0.5900 0.5950 0.6000 0.6050 0.6100 -1.25
-1.00 -0.75 -0.50 -0.25 0.00 0.25 0.50 0.75 1.00 1.25
(
p
u
)
[4] Sadeh, J. M. B. (2010). Effect of Distributed Generation Capacity on the Coordination of Protection System of Distribution Network. Azad University, IEEE, Iran.
[5] Silva J. A., H. B. Funmilayo, K. L. Butler-Purry, (2007), “Impact of Distributed Generation on the IEEE 34 Node Radial Test Feeder with Overcurrent Protection”, 39th North American Power Symposium, 49-57.
[6] Osabohien R. W and Uhunmwangho R. (2018) Reducing the impact of DG on distribution networks protection with reverse power relay. Nigrerian Journal of Technology. Volume 30 (1) pp. 209–215.
[7] Semih C. I. and Aysen B. A. (2017) Effects of Distributed Generation on Overcurrent Relay Coordination and an Adaptive Protection Scheme. IOP Conference Series: Earth and Environmental Science, Volume 73.
[8] Alberts, J. A., & de Kock, J. A. (2017). “Impact on power factor by small scale renewable energy generation”. In Domestic Use of Energy (DUE), International Conference on power systems and control. pp. 146-151.
[9] Kumar D S, Radhakrishnan B M, Srinivasan D and Reindl T (2015) IEEE International Conference on Fuzzy Systems (Turkey: Istanbul) pp. 1-6.
[10] Saha D, Datta A and Das P (2016) Optimal coordination of directional overcurrent relays in power systems using symbiotic organism search optimization technique IET Generation., Transmission. & Distribution. Voluem10 pp. 2681-88.