EFFECTIVE APPROACH FOR DYNAMIC TEST CASE
GENERATION FOR LOAD TESTING OF HTTP WEB
SERVER
Shweta Ahuja M.Tech. Research Scholar Computer Science and Engineering Guru Nanak Institute of Technology
Mullana, Haryana, India
Shalini Kapoor Assistant Professor
Computer Science and Engineering Guru Nanak Institute of Technology
Mullana, Haryana, India
ABSTRACT
Test case generation is one of the prominent domain and key component in the software testing. The test cases are utmost important as the performance of module or entire system can be evaluated with unbiased test cases. A number of approaches are developed so far for the test case generation still this area is under research because of multiple services and applications which are processed by the software. In this research work, a new approach name Monte Carlo Simulation based test case generation is used. Using this methodology, a unique and any number of test cases can be generated and then processed for the actual performance evaluation of the web server.
Keywords –Software Testing, Test Case Generation, Monte Carlo Based Test Case Generation
INTRODUCTION
Test Case Generation is one of the critical errands in programming building that is having a situated of conditions under which a tester will figure out if an application, programming framework or one of its components is functioning as it was initially settled for it to do. The instrument for figuring out if a product project or framework has breezed through or fizzled such a test is known as a test prophet. In a few settings, a prophet could be a necessity or utilization case, while in others it could be a heuristic. This process take numerous test cases to verify that a product project or framework is considered adequately investigated to be discharged.
Test cases are regularly alluded to as test scripts, especially when composed - when they are normally gathered into test suites. Monte Carlo systems (or Monte Carlo examinations) are an expansive class of computational calculations that depend on rehashed irregular inspecting to get numerical results. They are regularly utilized as a part of physical and scientific issues and are most helpful when it is troublesome or difficult to utilize other numerical techniques.
Monte Carlo systems are primarily utilized as a part of three particular issue classes: streamlining, numerical joining, and creating draws from a likelihood conveyance. In the proposed work, we will create a grouping of test cases to assess the execution and uprightness of web application so that the simultaneous and high load applications can be executed with no overhead.
Programming testing is an examination led to furnish partners with data about the nature of the item or administration under test. Programming testing can likewise give a target, free perspective of the product to permit the business to acknowledge and comprehend the dangers of programming execution. Test methods incorporate the procedure of executing a
system or application with the purpose of discovering programming bugs (lapses or different imperfections).
PROBLEM FORMULATION AND PROPOSED WORK
A program is evaluated based on number of test cases. The program is having multiple elements in terms of modules, functions, variables, constants and many others. A new version of program P1 can be generated by the modifications in base program P. Now, the base work attempts to find out the similarity of Test Cases of P1 and P. Using this base approach, the work emphasize on the execution of a function that performs the fault detection in the program.
The work focus on the prioritization of test cases by which the faults can be reduced in the program. The proposed work is using Monte Carlo Method for generation of dynamic random files which are processed as test cases. Each test case (randomly generated file) is processed by the HTTP Apache Web Server and the process time is evaluated in terms of microseconds. The work focus on finding the Upper Bound Lower Bound and Mean Limit by which the number of files (test cases) and the file size (weights of the test cases) can be fixed. By using the proposed approach of setting bounds, the front-end can be set so that the limited traffic/files can be entered and processed.
As the domain of Software Testing and Test Case Generation is much diversified, there is lots of scope of research for the scholars and practitioners.
The main objectives of this research are to develop and deploy a web based simulator to generate the sequence of test cases. These test cases shall have different priorities based on fuzzy random values. The effect and overall performance of the web based software application shall be investigated based on the priority and fuzzy random values. The test cases shall be generated using monte carlo simulation that is one of the prominent method to generate the inputs and expected outcome. In base paper, there is no measurement of
execution time and overhead issues. to calculate the execution time and complexity of the existing algorithm in the base paper. This work propose a new algorithm that will be better than in the base work using greedy method in terms of enhanced test case generation.
SIMULATION SCENARIOS AND RESULTS
For implementation and simulation, a web based simulator is developed. Using the simulator, any number of test cases can be generated and tested on the HTTP Web Server.
Tools Technologies Used for Simulation • PHP
• MySQL Database Engine • AJAX
• JQuery
• JPGraph Library
• Dia - The Diagram Editor
Figure 2 – Generation of Dynamic Test Cases using Simulator
Number of files Average File Size (In Bytes)
Average execution time
1 90 0.132084846 1 90 0.144667149 1 122 0.129695892 1 130 0.154615879 2 33 0.284078836 2 59 0.653749943 2 60 0.211390972 2 46 0.271922112 2 136 0.272706032 2 98 0.328162909 2 131 0.273870945 2 108 0.326394081 2 124 0.231347799 2 114 0.247904062 2 92 0.254753113 2 125 0.285777092 2 121 0.26686883 2 108 0.365943909 3 51.33333333 0.247397184 3 149.3333333 0.396366119 3 98.66666667 0.371848106 4 110.5 0.365255117 4 53 0.017513037 4 45.5 0.016750813
5 80.8 0.40917182 5 81.8 0.379914999 5 106.4 0.368839025 5 102.8 0.430104017 5 93.6 1.132224083 6 81.66666667 0.509562016 6 151.1666667 0.485296965 7 110.2857143 0.658923149 8 88.25 0.674484015 9 117 0.738033056 9 119.1111111 0.854396105 10 96.2 0.88614893 11 119.6363636 1.158645868 11 84.18181818 0.025059938 12 95.5 0.959079027 12 108.5 1.051032066 12 103.3333333 1.01554203 12 93.66666667 1.070648909 14 107.7142857 0.032500982 15 114.9333333 1.135213852 15 99.33333333 1.159090042 17 120 1.418420076 19 91.57894737 1.410146952 24 101.9166667 2.064305067 48 89.33333333 5.975867033
X Values 1 1 1 1 2 2 2 2 2 2 2 2 2 2 2 2 2 2 3 3 Y Values 0.132084846 0.144667149 0.129695892 0.154615879 0.284078836 0.653749943 0.211390972 0.271922112 0.272706032 0.328162909 0.273870945 0.326394081 0.231347799 0.247904062 0.254753113 0.285777092 0.26686883 0.365943909 0.247397184 0.396366119 X - Mx -6.245 -6.245 -6.245 -6.245 -5.245 -5.245 -5.245 -5.245 -5.245 -5.245 -5.245 -5.245 -5.245 -5.245 -5.245 -5.245 -5.245 -5.245 -4.245 -4.245 Y - My -0.526 -0.514 -0.529 -0.504 -0.374 -0.004 -0.447 -0.386 -0.386 -0.330 -0.384 -0.332 -0.427 -0.410 -0.403 -0.372 -0.391 -0.292 -0.411 -0.262 (X - Mx)2 38.999 38.999 38.999 38.999 27.509 27.509 27.509 27.509 27.509 27.509 27.509 27.509 27.509 27.509 27.509 27.509 27.509 27.509 18.019 18.019 (Y - My)2 0.277 0.264 0.279 0.254 0.140 0.000 0.200 0.149 0.149 0.109 0.148 0.110 0.182 0.168 0.163 0.139 0.153 0.085 0.169 0.069 (X - Mx)(Y - My) 3.286 3.207 3.301 3.145 1.962 0.024 2.344 2.026 2.022 1.731 2.016 1.740 2.239 2.152 2.116 1.954 2.053 1.533 1.744 1.112
Result Details & Calculation
X Values ∑ = 355 Mean = 7.245 ∑(X - Mx)2 = SSx = 3129.061 Y Values ∑ = 32.254 Mean = 0.658 ∑(Y - My)2 = SSy = 38.306 X and Y Combined N = 49 ∑(X - Mx)(Y - My) = 317.19
R Calculation
r = ∑((X - My)(Y - Mx)) / √((SSx)(SSy)) r = 317.19 / √((3129.061)(38.306)) = 0.9162
Meta Numerics (cross-check) r = 0.9162 Key X: X Values Y: Y Values Mx: Mean of X Values My: Mean of Y Values
X - Mx & Y - My: Deviation scores
(X - Mx)2 & (Y - My)2: Deviation Squared
(X - Mx)(Y - My): Product of Deviation Scores
The value of R is 0.9162. This is a strong positive correlation, which means that high X variable scores go with high Y variable scores (and vice versa).
The value of R2, the coefficient of determination, is 0.8394.
CORRELATION ANALYSIS -> AVERAGE FILE SIZE VS. EXECUTION TIME X Values Y Values X - Mx Y - My (X - Mx)2 (Y - My)2 (X - Mx)(Y
90 90 122 130 33 59 60 46 136 98 131 108 124 114 92 125 121 108 51.33333333 149.3333333 0.132084846 0.144667149 0.129695892 0.154615879 0.284078836 0.653749943 0.211390972 0.271922112 0.272706032 0.328162909 0.273870945 0.326394081 0.231347799 0.247904062 0.254753113 0.285777092 0.26686883 0.365943909 0.247397184 0.396366119 -9.062 -9.062 22.938 30.938 -66.062 -40.062 -39.062 -53.062 36.938 -1.062 31.938 8.938 24.938 14.938 -7.062 25.938 21.938 8.938 -47.729 50.271 -0.526 -0.514 -0.529 -0.504 -0.374 -0.004 -0.447 -0.386 -0.386 -0.330 -0.384 -0.332 -0.427 -0.410 -0.403 -0.372 -0.391 -0.292 -0.411 -0.262 82.121 82.121 526.148 957.155 4364.197 1604.970 1525.846 2815.584 1364.410 1.128 1020.031 79.887 621.900 223.142 49.873 672.776 481.273 79.887 2278.033 2527.200 0.277 0.264 0.279 0.254 0.140 0.000 0.200 0.149 0.149 0.109 0.148 0.110 0.182 0.168 0.163 0.139 0.153 0.085 0.169 0.069 4.768 4.654 -12.124 -15.581 24.718 0.180 17.455 20.499 -14.241 0.351 -12.276 -2.966 -10.646 -6.130 2.849 -9.661 -8.586 -2.613 19.609 -13.165
Result Details & Calculation
X Values ∑ = 4854.042 Mean = 99.062 ∑(X - Mx)2 = SSx = 32918.555 Y Values ∑ = 32.254 Mean = 0.658 ∑(Y - My)2 = SSy = 38.306 X and Y Combined N = 49 ∑(X - Mx)(Y - My) = 36.153
R Calculation
r = ∑((X - My)(Y - Mx)) / √((SSx)(SSy)) r = 36.153 / √((32918.555)(38.306)) = 0.0322 Meta Numerics (cross-check)
r = 0.0322 Key X: X Values Y: Y Values Mx: Mean of X Values My: Mean of Y Values
X - Mx & Y - My: Deviation scores
(X - Mx)2 & (Y - My)2: Deviation Squared
(X - Mx)(Y - My): Product of Deviation Scores
The value of R is 0.0322. Although technically a positive correlation, the relationship between your variables is weak (nb. the nearer the value is to zero, the weaker the relationship). The value of R2, the coefficient of determination, is 0.001.
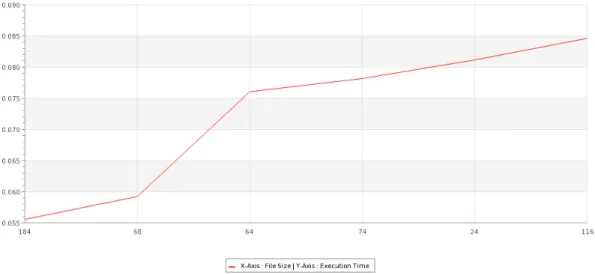
Following is the results of simulation in terms of files in different slots of sizes. Number of files Average File
Size (In Bytes)
Average execution time
2 33 0.284078836
2 46 0.271922112
2 59 0.653749943
2 60 0.211390972
2 98 0.328162909 2 108 0.326394081 2 108 0.365943909 2 114 0.247904062 2 121 0.26686883 2 124 0.231347799 2 125 0.285777092 2 131 0.273870945 2 136 0.272706032
Figure 4 – Consistency Analysis of Web Server in terms of Execution Time
From the above graph, the performance of web server is almost consistent in terms of execution time. If number of files are 2, the average execution time of the test cases are increasing in Linear Distribution. By this aspect, the performance of server is moderate and acceptable because the web server is not behaving in abnormal way and the linear growth of output is followed.
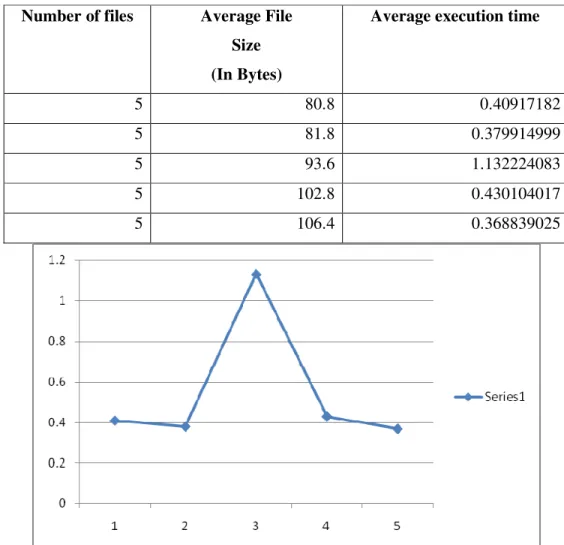
Number of files Average File Size (In Bytes)
Average execution time
5 80.8 0.40917182
5 81.8 0.379914999
5 93.6 1.132224083
5 102.8 0.430104017
5 106.4 0.368839025
Figure 5 – Performance Evaluation of Web Server in terms of Execution Time with Number of Simulation Attempts
Here it is evident that performance of web server is steady in most of the cases. The server is not behaving and processing the results in abnormal way.
Following is the results of simulation in terms of variations in files size.
Number of files Average File Size
(In Bytes) 6 81.66666667 0.509562016 6 151.1666667 0.485296965 7 110.2857143 0.658923149 8 88.25 0.674484015 9 117 0.738033056 9 119.1111111 0.854396105 10 96.2 0.88614893 11 119.6363636 1.158645868 11 84.18181818 0.025059938 12 95.5 0.959079027 12 108.5 1.051032066 12 103.3333333 1.01554203 12 93.66666667 1.070648909 14 107.7142857 0.032500982 15 114.9333333 1.135213852 15 99.33333333 1.159090042 17 120 1.418420076 19 91.57894737 1.410146952 24 101.9166667 2.064305067 48 89.33333333 5.975867033
Figure 6 – Performance Evaluation with File Size and Execution Time
Now, it is clear the results are abnormal attempt 20 where the number of files is 48 and average file size is 89. In this case, the execution time is 5.97 ms which is very high as compared to the other values. It is evident from the results that the web server is having huge
overhead in case of increasing number of files rather than single file with more size. The web server is able to handle less number of files in more effective way as compared to more files with lesser size.
CONCLUSION
This research work is focused on the dynamic generation of test cases so that that performance of web server can be analyzed. In this research work, a new approach using Monte Carlo Simulation is used for the generation of dynamic files of different size so that the biasing can be avoided and actual load test of the server can be implemented. It is found that that the web server is performing in consistent approach in terms of different parameters including execution time, cost and performance.
REFERENCES
[1] Beizer, B. (2003). Software testing techniques. Dreamtech Press.
[2] Weyuker, E. J. (1998). Testing component-based software: A cautionary tale.IEEE software, (5), 54-59.
[3] El‐Far, I. K., & Whittaker, J. A. (2001). Model‐Based Software Testing.Encyclopedia of Software Engineering.
[4] Kaner, C., Bach, J., & Pettichord, B. (2008). Lessons learned in software testing. John Wiley & Sons.
[5] Memon, A. M., Pollack, M. E., & Soffa, M. L. (2001). Hierarchical GUI test case generation using automated planning. Software Engineering, IEEE Transactions on, 27(2), 144-155.
[6] Tung, Y. W., & Aldiwan, W. S. (2000). Automating test case generation for the new generation mission software system. In Aerospace Conference Proceedings, 2000 IEEE (Vol. 1, pp. 431-437). IEEE.
[7] Bai, X., Dong, W., Tsai, W. T., & Chen, Y. (2005, October). WSDL-based automatic test case generation for web services testing. In Service-Oriented System Engineering, 2005. SOSE 2005. IEEE International Workshop (pp. 207-212). IEEE.
[8] Ali, S., Briand, L. C., Hemmati, H., & Panesar-Walawege, R. K. (2010). A systematic review of the application and empirical investigation of search-based test case generation. Software Engineering, IEEE Transactions on,36(6), 742-762.
[9] Fröhlich, P., & Link, J. (2000). Automated test case generation from dynamic models. In ECOOP 2000—Object-Oriented Programming (pp. 472-491). Springer Berlin Heidelberg.
[10] Mingsong, C., Xiaokang, Q., & Xuandong, L. (2006, May). Automatic test case generation for UML activity diagrams. In Proceedings of the 2006 international workshop on Automation of software test (pp. 2-8). ACM.
[11] Perrouin, G., Sen, S., Klein, J., Baudry, B., & Le Traon, Y. (2010, April). Automated and scalable t-wise test case generation strategies for software product lines. In Software Testing, Verification and Validation (ICST), 2010 Third International Conference on (pp. 459-468). IEEE.