Cover
Audit Report
Report Number
MS-AR-15-001
Window Retail
Customer
Service
January 29, 2015
A
ppendices
R
ecommenda
tions
Findings
Ta
ble of
Contents
Background
In fiscal year (FY) 2013, the U.S. Postal Service’s retail network of about 32,000 facilities handled 1.7 billion transactions,
a reduction of about 5.2 percent from FY 2012. These transactions typically included the sale of stamps, shipping supplies or services, and money orders. A positive customer experience during retail counter transactions enhances the Postal Service’s brand and increases loyalty and revenue. Over the course of FYs 2012–2013, the Postal Service had an 8.9 percent increase in negative customer feedback regarding retail counter experiences. The Postal Service uses several tools to measure and improve overall customer satisfaction, including observations by retail managers, mystery shoppers, and customer surveys.
Our objective was to evaluate customer service at retail counters. During our review, we identified issues related to customer surveys, which we communicated to management in a separate management alert.
What the OIG Found
Between FYs 2012 and 2013, an increasing number of customers expressed dissatisfaction with the service they receive at retail facilities. While the Postal Service’s goal is 90 percent customer satisfaction, in FY 2013 more than 20 percent of customers who responded to surveys stated they had been treated “worse than other retailers” at Postal Service retail counters.
Dissatisfied customers exist, in part, because procedures for improving customer service are not functioning as intended. Although management communicates with sales associates periodically via service briefings known as “stand-up” talks and provides video instructions, there is a lack of continual, formal customer service training. Further, sales associates are selected based on seniority rules, rather than suitability for the position, as suggested by best practices. In addition, the Postal Service does not have a mandatory process to ensure managers regularly observe sales associates and provide feedback. Regular observation would help sales associates recognize where they need to improve their performance.
Highlights
Retail Operations managers
use several tools to measure
and improve customer service
at the retail counter. However,
they do not consistently conduct
observations of their
sales associates.
A
ppendices
R
ecommenda
tions
Findings
Ta
ble of
Contents
Highlights
Retail Operations managers use several tools to measure and improve customer service at the retail counter. However, they do not consistently conduct observations of their sales associates. Additionally, supervisors have not made decisions based on Point of Service (POS) survey results, primarily due to the lack of communication of these results.
We estimated the Postal Service risks losing $288.5 million in FY 2015 due to less than satisfactory treatment of customers during retail transactions.
What the OIG Recommended
We recommended the Postal Service provide continual, formal customer service refresher training to sales associates to improve customer service; create a mandatory process for observing, tracking, and providing feedback on performance; and develop a plan to leverage POS customer survey results to improve customer service at retail counters.
A
ppendices
R
ecommenda
tions
Findings
Ta
ble of
Contents
Transmittal Letter
January 29, 2015
MEMORANDUM FOR: KELLY M. SIGMON
VICE PRESIDENT, RETAIL AND CUSTOMER SERVICE OPERATIONS
JAMES A. NEMEC
VICE PRESIDENT, CONSUMER AND INDUSTRY AFFAIRS
E-Signed by Janet Sorensen VERIFY authenticity with eSign Desktop
FROM: Janet M. Sorensen
Deputy Assistant Inspector General for Revenue and Resources
SUBJECT: Audit Report – Window Retail Customer Service (Report Number MS-AR-15-001)
This report presents the results of our audit of the U.S. Postal Service’s Window Retail Customer Service (Project Number 14RG019MS000).
We appreciate the cooperation and courtesies provided by your staff. If you have any questions or need additional information, please contact Joseph Wolski, director, Retail, Sales, and International, or me at 703-248-2100.
Attachment
cc: Corporate Audit and Response Management
A
ppendices
R
ecommenda
tions
Findings
Ta
ble of
Contents
Table of Contents
Cover
Highlights ...1
Background ...1
What the OIG Found ...1
What the OIG Recommended ...2
Transmittal Letter ...3
Table of Contents...4
Findings ...5
Introduction ...5
Conclusion ...
6
Retail Customer Service ...
6
Sales and Services Associate Selection and Training ...10
Sales and Services Associate Performance Observations
and Feedback ...12
Point-of-Service Survey Results ...13
Recommendations...14
Management’s Comments ...14
Evaluation of Management’s Comments ...15
Appendices ...17
Appendix A: Additional Information ...18
Background ...18
Objective, Scope, and Methodology ...19
Prior Audit Coverage ...21
Appendix B: Management’s Comments ...22
Contact Information ...26
A
ppendices
R
ecommenda
tions
Findings
Ta
ble of
Contents
Introduction
This report presents the results of our audit of the U.S. Postal Service’s Window Retail Customer Service (Project Number 14RG019MS000). The objective of this self-initiated audit was to evaluate customer service at retail counters. See Appendix A
for additional information about this audit.
In fiscal year (FY) 2013, the retail network handled 1.7 billion transactions, a reduction of about 5.2 percent from FY 2012.
Positive customer experiences during retail counter transactions enhance the Postal Service brand and increase loyalty, revenue, and customer satisfaction. Over the course of FYs 2012–2013, the Postal Service experienced an 8.9 percent increase in negative customer feedback regarding the retail counter experience.
The Postal Service uses several tools1 to measure overall customer satisfaction at retail counters, including:
■ Postal Service (PS) Form 4000-B, Employee Observation, used by local retail managers to evaluate postal sales and service
associate (sales associate) performance.
■ The Retail Customer Experience (RCE) Program, which is conducted through independently contracted customers, or mystery
shoppers, at larger retail locations.
■ Point-of-Service (POS) survey information collected when customers visit a uniform resource locator printed at the bottom of
the customer receipt. The POS survey is meant to be an exclusive conduit for feedback from customers who use Post Office retail counters.
According to the National Performance Review (NPR),2 courtesy and associated behaviors such as eye contact and clear
communication are critical customer satisfaction elements. The NPR report noted3 that organizations should not tolerate
discourteous service. The report concluded that, of the three most important elements of customer service – timeliness, quality, and courtesy – lack of courtesy has the highest probability of causing customers to choose alternatives, regardless of the timeliness or quality of service provided.
The NPR reported that, while intentional lack of courtesy is rare, behavior customers perceive as discourteous is more prevalent – and perception is reality. For every customer who complains directly to management, there are at least 10 more who complain to their friends and associates. The NPR also contends that courtesy is measurable and all the successful organizations the
NPR interviewed had systems for measuring courtesy within the context of their customer service initiatives.
1 The RCE Program is administered by the Postal Service Customer Services Operations and Retail; and the POS survey is administered by Customer Engagement & Strategic Alignment (CE&SA), with the results available on the Customer Insights Measurement website.
2 Executive Order 12862 dated September 11, 1993, directs the NPR and President’s Management Council to instruct government agencies on smarter and better ways of doing business.
3 World-Class Courtesy: A Best Practice Report, NPR, led by Vice President Al Gore. The purpose of this report was to identify courtesy best practices in “best-in-class” organizations.
Findings
A
ppendices
R
ecommenda
tions
Findings
Ta
ble of
Contents
Conclusion
Between FYs 2012 and 2013, an increasing number of customers expressed dissatisfaction with the service they receive at retail facilities. While the Postal Service’s goal is 90 percent customer satisfaction, we found that more than 20 percent of its customers in FY 2013 responded to the POS survey4 that they have been treated “worse than other retailers” when visiting Postal Service
retail counters. Dissatisfied customers exist, in part, because procedures for improving customer service are not functioning as intended. Although management communicates with sales associates periodically via service briefings known as “stand-up” talks and provides video instructions, there is no formal, in-class refresher customer service training. Further, sales associates’ positions are based on seniority rather than suitability, as suggested by best practices. Also, follow-up customer service training is informal and there is no mandatory process for ensuring that managers regularly observe sales associates and provide feedback. Although Retail Operations managers use several tools to improve customer service at the retail counter, they do not consistently conduct observations of their sales associates. Additionally, supervisors have not made decisions based on POS survey results, primarily due to the lack of communication of these results. We estimate the Postal Service could risk $288.5 million in FY 2015 by failing to improve customer experiences at postal retail counters.5
Retail Customer Service
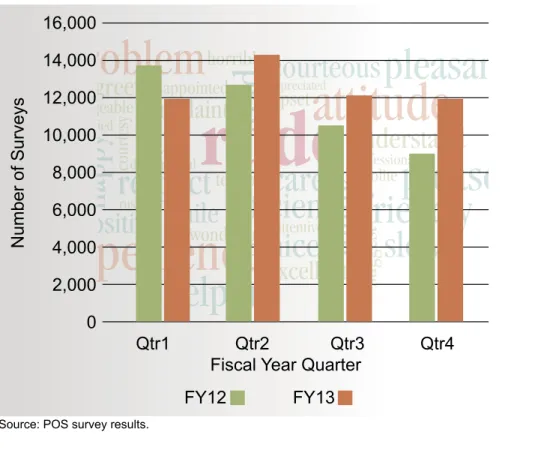
About 20 percent of postal customers who responded to the POS survey in FY 2013 indicated the Postal Service was “worse than other retailers” in its customer service at retail counters. This represents an 8.9 percent increase in negative feedback over FY 2012 survey results. In FY 2013, the negative customer response rate increase climbed from 11.8 percent during Quarter (Q) 2 to 27.7 percent in Q4 (see Figure 1).
Figure 1. Negative Customer Service Feedback Comparison
Source: POS survey results.
4 In FY 2013, about 1.7 billion retail transactions took place at postal retail counters and about 51,000 customers responded to the POS survey. 5 Inclusive of those who described their Postal Service experience as “worse than other retailers.”
About 20 percent of postal
customers who responded
to the POS survey in FY 2013
indicated the Postal Service was
“worse than other retailers”
in its customer service
at retail counters.
understand
excellent
complaint
greet
horrible
suggest
terrible
wonderful
politeupset
courtesy knowledgeable disappointed attentive professional rushed satisfied disrespectful appreciatedpositive
smile
courteous
slow
happy
efficient
nice
bad
care
pleasant
respect
please
thank
late
friendly
helpful
experience
attitude
problem
rude
Number of Surveys
Fiscal Year Quarter FY12 FY13 16,000 14,000 12,000 10,000 8,000 6,000 4,000 2,000 0
Qtr1 Qtr2 Qtr3 Qtr4
A
ppendices
R
ecommenda
tions
Findings
Ta
ble of
Contents
Highlights
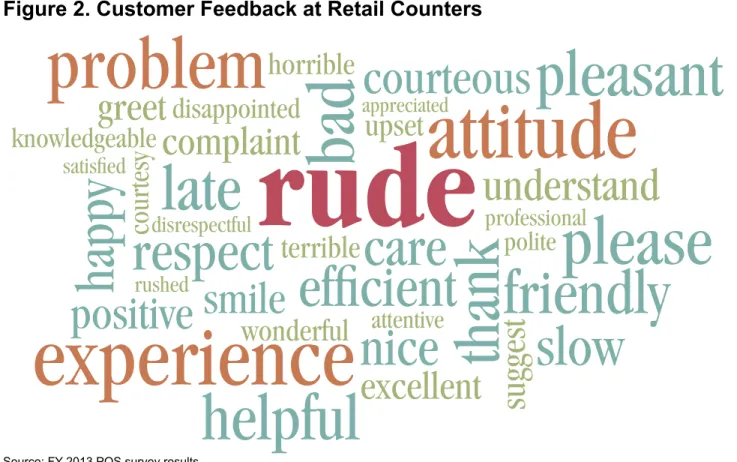
Despite all the measures to improve the customer experience, the Postal Service’s retail network experienced an 8.9 percent6
increase in the amount of negative customer feedback from FY 2012 to FY 2013. Figure 2, generated from POS survey information, shows words frequently associated with customer service used in survey comments. The size and density of the font is
proportional to the number of times the word appears.
Figure 2. Customer Feedback at Retail Counters
Source: FY 2013 POS survey results.
The POS survey underwent major changes in December 2013. The Postal Service made these changes to the POS survey partially as a result of a report conducted by the Boston Consulting Group (BCG) to review the usefulness of POS survey data. BCG concluded that the Postal Service had been collecting too much “noise” and non-actionable data. As a result, the Postal Service focused on the utilization of Wait Time in Line data from the RCE Program to improve customer service at the retail counter in FY 2012 and 2013. For FY 2014, the Postal Service shortened the survey from more than 50 questions to six questions. It also made modifications to the scale used to answer the questions on the survey and enabled the use of
Quick Response codes that allow more immediate participation by customers. The changes to the survey resulted in a significant increase in the number of customer responses received. Postal Service management is pleased with the quality of data they are receiving and acknowledge that the new POS survey reveals the need for further improvements to customer service at the retail counter. We will consider evaluating these changes in the future.
6 The number of negative responses to the POS survey increased in FY 2013 (51,467) from FY 2012 (47,275) by 8.9 percent.
understand
excellent
complaint
greet
horrible
suggest
terrible
wonderful
polite
upset
courtesy
knowledgeable
disappointed
attentive
professional
rushed
satisfied
disrespectful
appreciated
positive
smile
courteous
slow
happy
efficient
nice
bad
care
pleasant
respect
please
thank
late
friendly
helpful
experience
attitude
problem
rude
A
ppendices
R
ecommenda
tions
Findings
Ta
ble of
Contents
Highlights
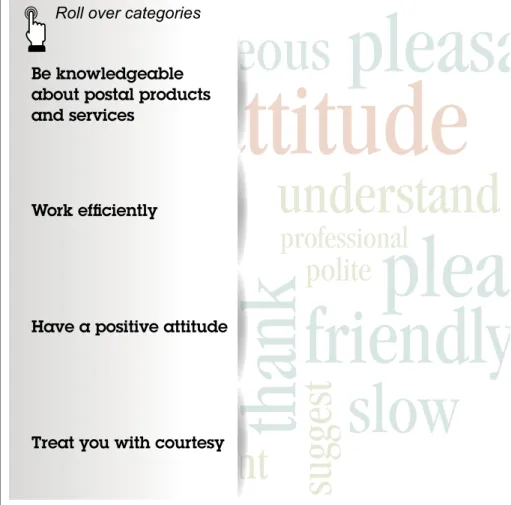
FY 2014 POS surveys ask customers which of four issues is most important regarding the sales associates during their visits (see Figure 3).
Figure 3. Issues Most Important to Customers Interacting with Sales Associates
Source: FY 2014 POS survey results.
Note: This data is limited to December 2013-September 2014.
understand
excellent
complaint
greet
horrible
suggest
terrible
wonderful
polite
upset
courtesy
knowledgeable
disappointed
attentive
professional
rushed
satisfied
disrespectful
appreciated
positive
smile
courteous
slow
happy
efficient
nice
bad
care
pleasant
respect
please
thank
late
friendly
helpful
experience
attitude
problem
Roll over categoriesA
ppendices
R
ecommenda
tions
Findings
Ta
ble of
Contents
Highlights
Treat you with courtesy Be knowledgeable about postal products and services
Work efficiently
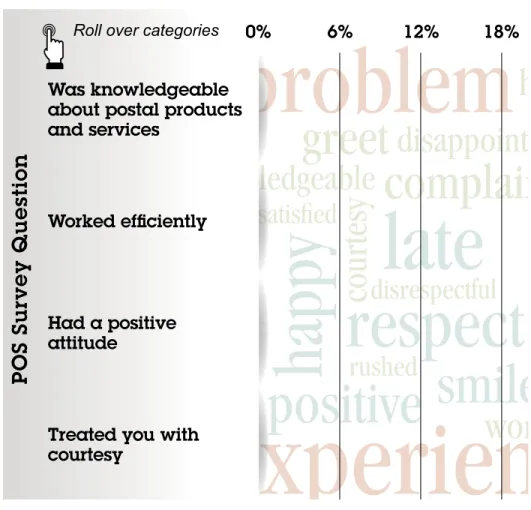
The customers were then asked how satisfied they were during their recent experience with the sales associate based on the issue most important to them. Being treated with courtesy had the highest negative response rate at 16.3 percent (see Figure 4).
Figure 4. Negative Customer Service Feedback
Source: FY 2014 POS survey results.
Note: This data is limited to December 2013-September 2014.
The Postal Service established Delivering Results, Innovation, Value, and Efficiency (DRIVE) Initiative 25 to understand and measure the customer experience across all channels and to complete extensive customer experience assessments. NPR research established that the damage done to an organization by discourteous behavior is severe and lasting. The NPR report notes that lack of courtesy endangers an organization’s reputation and, ultimately, its survival; it causes an organization to lose business even if it provides services customers cannot easily obtain elsewhere.
The Postal Service, in response to a recently issued management alert, Retail Customer Service Management (Report Number MS-MA-15-002, dated October 17, 2014), will be taking corrective actions to improve customer service by promoting consistent instructions on using and sharing POS survey information. Until recently, its focus was on increasing feedback by streamlining and shortening the survey questionnaire. As a result of this improvement in FY 2014, the Postal Service will be able to more accurately analyze its customer service metrics and take the appropriate corrective actions.
The NPR report notes that
lack of courtesy endangers an
organization’s reputation and,
ultimately, its survival;
it causes an organization to
lose business even if it provides
services customers cannot
easily obtain elsewhere.
understand
excellent
complaint
greet
horrible
suggest
terrible
wonderful
polite
upset
courtesy
knowledgeable
disappointed
attentive
professional
rushed
satisfied
disrespectful
appreciated
positive
smile
courteous
slow
happy
efficient
nice
bad
care
pleasant
respect
please
thank
late
friendly
helpful
experience
attitude
problem
0% 6% 12% 18%Roll over categories
POS Survey Question
A
ppendices
R
ecommenda
tions
Findings
Ta
ble of
Contents
Highlights
Worked efficientlyHad a positive attitude
Treated you with courtesy
Was knowledgeable about postal products and services
We also determined that current procedures7 for improving customer service are not functioning as intended. This may be
impacting customer service and contributing to the decrease in customer satisfaction. Specifically, there is no continual, formal customer service training for sales associates. Further, sales associates’ positions are based on seniority rather than suitability, as suggested by best practices. In addition, follow-up customer service training is informal and ad-hoc and there is no mandatory process to ensure that managers are regularly observing sales associates and providing feedback. Additionally, Retail Operations managers do not consistently use all the tools at their disposal, such as observations by retail managers, to improve customer service at retail counters.
Sales and Services Associate Selection and Training
Sales associates’ positions are based on a seniority bidding process established in an agreement with the American Postal Workers Union8 rather than on customer service skills. Once an employee becomes a sales associate, resolving serious issues
related to that employee, such as persistent discourteous behavior, can be difficult and time-consuming.
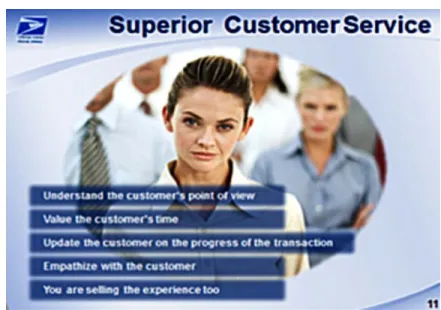
According to customer service best practices, successful organizations assure that frontline employees are suited to working with customers before placing them in positions that involve face-to-face customer interaction. Postal Service management recognizes the importance of superior customer service and noted that employees who work directly with customers should understand and empathize with them, as depicted in Figure 5.
Figure 5. Sales Associate Training Materials
Source: Postal Service.
The agreement between the Postal Service and the union representing sales associates dictates that the Postal Service must select most sales associates through a seniority-based bidding process. Because the Postal Service is bound by this agreement, management has limited flexibility in staffing sales associate positions. However, it can build the desired customer service skills and behavior through continual, formal training.
7 PS Form 4000-B, which local retail managers use to evaluate sales associates’ performance.
8 Collective Bargaining Agreement between the American Postal Workers Union, AFL-CIO, and Postal Service, covering the period from November 21, 2010, to May 20, 2015.
A
ppendices
R
ecommenda
tions
Findings
Ta
ble of
Contents
While the Postal Service provides new sales associates with detailed training, it does not, as a rule, provide follow-up training on the importance of courteous service. Any subsequent training is informal and ad-hoc and, as a result, it is possible for a sales associate to spend a career at the retail counter without any formal refresher training.
According to management, sales associates must have about 40 hours of training prior to working at retail counters, with the majority of this time spent in the classroom. Historically, once the initial training is completed, management provides formal, interactive refresher training to units only in specific instances, such as a retail channel operations training for all sales associates. But it does not use refresher training to address individual needs.
The NPR’s World-Class Courtesy report offers insight into how world-class companies and federal agencies, such as FedEx
and United Services Automobile Association, use courtesy to improve customer satisfaction and their own bottom lines.
Each of the organizations studied in the report exhibited a commitment to:
■ Meeting and exceeding customer expectations.
■ Empowering employees to meet the needs of their customers. ■ Providing specific and ongoing training in courtesy.
■ Screening for and hiring employees who are exceptionally courteous. ■ Providing seamless customer service from the customer’s perspective. ■ Having zero tolerance for discourteous service.
The NPR states that the organizations it visited used a number of innovative training approaches to ensure that employees are prepared to be exceptionally courteous to their customers. All of the organizations studied expressed the importance of continual training and see a trained employee as their best asset. Some of the organizations the NPR studied dedicate 80 percent of their training budgets to continually improving courteous behavior towards customers.
Sales associates working at Premier Post Offices9 must take formal refresher training on providing courteous customer
service, both online and in the classroom. When asked why only these select sales associates receive this formal refresher training, management stated that their priority for this training has been those offices with the highest revenue, namely
Premier Post Offices. Currently, the Postal Service does not have an official plan in place to expand these training opportunities to all of the remaining 28,900 non-Premier Post offices. The NPR found that world-class organizations do not see training as an unnecessary expense but as an investment. In addition, the research indicates that employees who are highly valued and well-trained provide a higher level of service to their customers.
9 The intent of the Premier Post Office Program is to focus the Postal Service’s limited resources on the vital few post offices that have high customer traffic; 3,100 sites have been selected to provide geographic coverage throughout the country.
A
ppendices
R
ecommenda
tions
Findings
Ta
ble of
Contents
Sales and Services Associate Performance Observations and Feedback
The Postal Service does not have a mandatory process to ensure that managers are regularly observing their retail sales associates and providing feedback. To standardize this process for managers, the Postal Service created PS Form 4000-B, which is designed to help managers observe and record the level of customer service skills and product knowledge of each sales associate. These observations and records serve as a communication/coaching tool between management and the
sales associate. However, current Postal Service guidance, (including Form 4000-B10 and an agency publication11) only suggests
that at least once a month unit managers, or their designees, should observe each retail sales associate. Since completing PS Form 4000-B is not mandatory, there is no accountability for performing this oversight function.
We interviewed retail managers and sales associates at eight post offices in four of the seven Postal Service areas. Based on our interviews with area and district managers, and our visits, we determined that most managers at the unit level were not
consistently conducting employee performance evaluations, nor providing sales associates with feedback. Best practices suggest that employees do what is measured, incented, and celebrated.12
Although most managers stated that they or their supervisors performed retail sales associate observations anywhere from twice a week to once a month, managers were unable to provide documentation of completed observations. PS Form 4000-B instructs unit managers to provide a copy of the completed form to their district retail manager. But none of the district retail managers were able to produce any documentation showing that unit managers at the eight post offices were regularly observing and providing feedback to their sales associates.
During interviews with the district managers we were consistently told that the district did not track whether unit managers performed regular observations and provided feedback to sales associates; as a result, the districts did not require any of their units to submit a PS Form 4000-B or other documentation showing that observations were completed. Consequently, there is no record of what, or even if, these managers regularly observed their sales associates or provided feedback. This limited our ability to compare an individual sales associate’s performance over multiple observations to determine if managers were congratulating sales associates who achieved their customer service skills goals, or coaching sales associates who were not meeting expectations.
10 The observation should include interaction with five consecutive customers. Units not meeting targets should conduct more frequent observations. The manager should also review the results with the employee within 24 hours, then file and retain the observation for 2 years.
11 Handbook PO-209, Retail Operations Handbook, October 2012.
12 The Five I’s of Employee Engagement, page 10, The Temkin Group, November 2012.
A
ppendices
R
ecommenda
tions
Findings
Ta
ble of
Contents
Most sales associates we interviewed stated that when managers or supervisors observed them, the managers discussed the results with employees within 24 hours. Other cases were inconsistent:
■ At one location, the manager stated that he did not know whether the supervisor performed the observations and used
Form 4000-B. The two sales associates from the same location stated that it had been 1 year since the supervisor used the form to perform his retail sales associate observations.
■ At a second location, the manager stated that he had performed the observations but stopped. He recently started the
observations again due to increased emphasis by the Postal Service. The postmaster told the manager to perform the observations weekly, but he could not show documentation of the completed forms.
Best practices13 suggest that proper monitoring of employees creates an environment that encourages employees to exhibit good
customer service and professionalism. Regular monitoring would likely improve customer service by allowing sales associates to more easily recognize areas that need improvement.
Point-of-Service Survey Results
Retail Operations managers do not consistently use all tools at their disposal to improve customer service at retail counters, such as POS survey results. POS survey information is “owned” by the Postal Service’s Consumer and Industry Affairs component, based out of headquarters, and is available on its web page, which is accessible to anyone with rights to the Postal Service’s intranet. We learned during interviews with retail unit managers that POS survey information is not directly communicated to them and they are not aware that their units’ results are available. This occurs due to a lack of consistent guidance from headquarters to the areas and districts about the use and communication of POS survey information.
As a result of these inconsistencies, the Postal Service is not fully leveraging the value of the POS survey information to improve customer service at retail counters. Best practices suggest14 that, while sharing internal information with employees is important,
exposing employees to customer feedback can be even more impactful.
The Postal Service has made considerable improvements to the survey and we recognize that participation has increased significantly as depicted in Figure 6. Due to the critical nature of our recommendations related to the POS survey, we issued a management alert to notify management of our concerns so they could take quick action to improve the customer experience at retail counters.
During the course of our audit work, management took steps to track POS survey customer participation and is reaching out to those offices with 0 percent participation. To improve customer participation, management has conducted stand-up talks and made videos to encourage sales associates to promote the survey. The impact of their efforts was demonstrated by increased survey responses in FY 2014.
13 The Five I’s of Employee Engagement, page 10, The Temkin Group, November 2012. 14 The Five I’s of Employee Engagement, page 4, The Temkin Group, November 2012.
The Postal Service is not fully
leveraging the value of the
POS survey information to
improve customer service at
retail counters. Best practices
suggest that, while sharing
internal information with
employees is important,
exposing employees to
customer feedback can be
even more impactful.
A
ppendices
R
ecommenda
tions
Findings
Ta
ble of
Contents
We recommend the vice president, Retail and Customer Service Operations:
1. Provide continual, formal customer service refresher training to sales associates that focuses on improving customer service. 2. Create a mandatory process for observing, tracking, and providing managerial feedback concerning individual sales associates’
customer service performance.
We recommend the vice president, Retail and Customer Service Operations, in cooperation with the vice president, Consumer and Industry Affairs:
3. Develop a plan to leverage Point-of-Service survey information to improve customer service at the retail counters.
Management’s Comments
Management disagreed with the findings and recommendations 1 and 3, and agreed with recommendation 2. Management also disagreed with the revenue at risk.
Management stated the data findings are irrelevant since all of the analysis is based on a previous POS survey, noting that the new survey is less lengthy, asks only the most salient customer service questions, and has increased participation.
Regarding recommendation 1, management did not agree that no continuous training is provided to sales service associates and observed that, in FY 2013 and FY 2014, several courses were offered to and completed by retail employees. Management has scheduled training for FY 2015.
Regarding recommendation 2, management agreed and stated they will modify the existing policy for monitoring sales associates’ customer service performance. Management noted that they will base the new policy on POS survey and Retail Customer
Experience (RCE) results to determine which units warrant additional observation. The target implementation date is September 30, 2015.
Regarding recommendation 3, management disagreed and stated that they had identified opportunities to improve customer service using POS survey results and noted that participation in the survey had increased. Both prior to and during this audit management took specific actions to improve the POS survey, including:
■ Publishing POS survey data on the Customer Insights website on a weekly basis (implemented in December 2013). ■ Weekly “push” reports to field for district POS sites with zero surveys received (implemented in August 2014).
■ Weekly “push” reports to area managers with the percentage of satisfied/dissatisfied customers and the number of completed
surveys (implemented in August 2014).
■ Regular internal newsletters and video messaging explaining to managers and sales associates the importance of customers
responding to POS survey.
Recommendations
We recommend management
provide continual, formal
customer service refresher
training and create a mandatory
process for observing, tracking,
and providing managerial
feedback. We also recommend
management develop a plan to
leverage Point-of-Service
survey information to improve
customer service.
A
ppendices
R
ecommenda
tions
Findings
Ta
ble of
Contents
Management disagreed with the calculation of the total retail revenue at risk and stated that the OIG overstated the number of customers who would choose a competitor as a result of poor customer service. Specifically, they stated that the OIG failed to provide empirical data that validates all these customers would, in fact, defect.
See Appendix B for management’s comments, in their entirety.
Evaluation of Management’s Comments
The OIG considers management comments partially responsive to the recommendations and corrective actions should resolve the issues identified in the report.
Regarding management’s disagreement with our findings, as discussed during our audit, the analysis of FY 2013 data was the most complete data available. Rather than mix results of a complete year for one survey and a partial year for another, we opted to consider the 2013 survey results. We appreciate that, since that time, management has updated and streamlined the POS survey and realize that this could increase customer participation and insight. We will consider evaluating the updated POS survey information more fully in future reviews when more comprehensive data are available.
Regarding recommendation 1, we recognize the efforts the Postal Service has taken to improve employees’ customer service skills. Our report does not state that “no continuous training” is provided to sales associates. Rather, it states that, while the Postal Service provides new sales associates with detailed training, it does not, as a rule, provide follow-up training on the importance of courteous service. Any subsequent training is informal and ad-hoc and, as a result, it is possible for a sales associate to spend a career at the retail counter without any formal refresher training. Based on our research into industry standards, we are concerned that informal and ad-hoc training may not be sufficient to ensure that all sales associates are continually refreshing and enhancing their customer service skills.
Our finding reflects the spirit of the Postal Service’s Retail Operations Handbook (PO-209) when it states that:
“[the] failure to provide formal, informal, or ongoing training could result in poor employee productivity, higher operational costs, and loss of revenue by the Postal Service.”
As far as we were able to establish, only some sales associates, such as those working at premier post offices, are mandated to receive regular formal training. We based our recommendation on the idea that all, not just some, sales associates could benefit from regular formal training in addition to the informal and ad-hoc training they are already provided. We believe the training planned in 2015 is sufficient to correct the issues noted in our report; therefore the OIG does not plan to formally pursue audit resolution. This significant recommendation will be closed with the issuance of this report; however, we will continue to evaluate opportunities for formal training to improve customer service for all sales associates.
Regarding recommendation 3, during the course of our audit, we learned of actions management took to publicize the POS
survey; however, our finding is primarily concerned with how management uses the survey information rather than how they collect it and make it available. The report credits management with greatly improving the POS survey customer response rate over the last year but found that areas, districts, and units vary on how, or even if, they should use survey data to improve retail counter operations. As a result of these inconsistencies, some of the areas and districts may not be fully leveraging the value of the POS survey information to improve customer service at retail counters. We based our recommendation on the idea that providing
A
ppendices
R
ecommenda
tions
Findings
Ta
ble of
Contents
detailed guidance to areas, districts, and units on how to communicate and use POS survey information to improve operations would maximize the information’s potential impact on improving retail operations across the Postal Service. Given the measures
management has taken during the course of our audit, the OIG does not plan to formally pursue audit resolution. We will, instead, communicate informally with management about steps they pursue related to this recommendation in the future. This significant recommendation will be closed with the issuance of this report. We will continue to evaluate opportunities to fully leverage the POS survey results to improve customer service.
Regarding the revenue at risk of $288,543,330, we based our risk analysis on POS survey data – notably that 20.5 percent of customers feel they are not treated with courtesy. The choice of another provider describes risk – risk in itself is subjective (rather than objective) and does not lend itself to empirical data. In this instance, the empirical data we used (POS survey results) is based on customer responses which are, by their very nature, subjective. We carefully considered this when weighing the risk of poor customer service on customer retention.
We consider all the recommendations significant, and therefore require our concurrence before closure. All recommendations should be entered into the Postal Service’s follow-up tracking system. Recommendations 1 and 3 can be closed with the issuance of this report. However, we request written confirmation from management when corrective action is completed for recommendation 2. This recommendation should not be closed in the Postal Service’s follow-up tracking system until we provide written confirmation that the recommendation can be closed.
A
ppendices
R
ecommenda
tions
Findings
Ta
ble of
Contents
Appendices
Appendix A: Additional Information ...18
Background ...18
Objective, Scope, and Methodology ...19
Prior Audit Coverage ...21
Appendix B: Management’s Comments ...22
Click on the appendix title
to the right to navigate to
the section content.
A
ppendices
R
ecommenda
tions
Findings
Ta
ble of
Contents
Background
The Postal Service has a substantial retail network of about 32,000 facilities, including post offices, stations, and branches.15
In FY 2013, the retail network handled 1.7 billion transactions, a decrease of 5.2 percent from FY 2012.
About 20.5 percent of postal customers in FY 2013 who responded to POS surveys replied that they have been treated “worse than other retailers” when visiting Postal Service retail counters (see Table 1).
Table 1. Retail Counter Survey – Customer Treated “Worse Than Other Retailers”
FY 2012 FY 2013
Survey Question % of answers = worse than other retailers % of answers = worse than other retailers 3a. Greeting you in a friendly manner 18.4% 20.0%
3b. Being pleasant 19.6% 21.5%
3g. Treating you with courtesy 18.8% 20.5% 3o. Treating you as a valued customer 22.7% 24.9% 3q. Treating you with respect 18.7% 20.3%
Sources: POS survey and OIG calculations.
Positive experiences at these retail counters are critical to customer satisfaction. The Postal Service uses the following tools to measure and improve overall customer satisfaction at retail counters and across all channels:
■ The RCE Program,16 conducted through independently contracted customers, evaluates the experiences of its customers
and provides an objective view of the Postal Service’s larger retail locations. It evaluates experiences through a standardized questionnaire for the following categories: (1) Wait Time in Line, (2) Hazardous Materials, (3) Sales Skills and Product Offerings and Product Knowledge and Product Explanations, (4) Promotion and Merchandising, and (5) Image. The Postal Service uses the evaluation results to improve employees’ customer service skills and the Postal Service’s image, which should contribute to a better experience for customers when they visit Postal Service retail locations.
■ PS Forms 4000-B, which are completed by local retail managers to evaluate sales associates’ performance at retail counters. The
Postal Service’s tools are intended to help improve employees’ skills and improve customers’ experience at its retail counters.
■ DRIVE Initiative 25, which seeks to understand and measure the customer experience across all channels and to complete
extensive customer experience assessments. Implementation of DRIVE 25 will help the Postal Service retain and grow retail customer revenue, thus fostering an environment for the future growth of the organization.
15 In this document, we refer collectively to retail facilities as post offices. 16 Previously called the Mystery Shopper Program.
Appendix A:
Additional Information
A
ppendices
R
ecommenda
tions
Findings
Ta
ble of
Contents
According to the vice president of the U.S.’ NPR, changing organizational behaviors in the federal sector is not only possible, but essential. The difference between organizations that succeed and those that fail often comes down to how they treat their customers.
FY 2014 Point-of-Service Survey Responses
In a recent effort to improve POS survey response numbers, the Consumer & Industry Affairs17 group has provided videos
explaining the importance of the survey and encouraging retail employees to promote it to customers. The number of surveys received significantly increased beginning in July of FY 2014 totaling 173,290, compared to 47,278 completed in FY 2013, indicating increased customer participation (see Figure 6). The Consumer & Industry Affairs group’s goal is to have 270 surveys completed within each district for each quarter to establish a statistical confidence level. The group plans to achieve this goal through a series of service talks to the field. The minimum goals18 are established to obtain statistically significant results within a
reasonable industry-accepted confidence interval.
Figure 6. New POS Surveys Received In FY 2014
Source: POS survey results.
Note: This data is limited to December 2013-September 2014.
Objective, Scope, and Methodology
Our objective was to evaluate customer service at the retail counters. To accomplish our objective, we:
■ Reviewed Postal Service manuals, guidelines, training materials, and databases to determine the criteria for providing
customer service at the retail counters.
17 Consumer and Industry Affairs is responsible for all Postal Service customer interaction and support, from small businesses to individual consumers, to large corporations and commercial mailers; including overseeing the office of the Consumer Advocate as a vital part of customer service.
18 The CE&SA group stated that its vendor used Exxon Corporation as a comparison to find a similar response rate (.01 percent) for a receipt survey with no tangible gift/coupon incentive.
A
ppendices
R
ecommenda
tions
Findings
Ta
ble of
Contents
■ Compared how often retail sales associates received formal training to how often they should receive training. We also
identified customer service-related training (both in person and online), including “service talks” from managers.
■ Reviewed the Temkin Group’s research papers to identify best practices suitable for potential implementation in the
Postal Service’s retail post offices.
■ Consulted with the Marketing & Sales Data Analytics manager and OIG Operations research analyst to finalize site selection
methodology for fieldwork visits.
■ Conducted site visits at selected post offices and met with postmasters and retail sales associates for in-depth discussions of
their knowledge and usage of the available customer service tools, including POS survey information and PS Form 4000-B. We visited post offices in the Northeast, Great Lakes, Eastern, and Capital Metro areas.
■ Met with the Postal Service’s CE&SA analysts to discuss how they use the POS survey information to gain insight on
customers’ experiences.
■ Met with the industry engagement specialist who was acting as manager, Retail & Post Office Operations, to discuss how the
group uses POS survey information to improve customer experience at the retail counters.
■ Met with Postal Service union management to identify any issues or concerns they have regarding customer service.
■ Created word cloud analysis using POS survey information for FY 2013 that consisted of all comments received. The audit
team judgmentally selected 39 key words relevant to customer service. Using a script, all occurrences of those 39 key words were extracted from the survey results file into a separate output text file. We used the resulting output file to create the word cloud.
Our scope included POS survey information from FYs 2012-2013, the most complete annual information as of the time of our audit. We also evaluated available FY 2014 POS survey information (from December 2013 to September 2014) to determine issues most important to customers, other customer service feedback and changes in survey participation. At the time our audit commenced there was only four months of information available. Due to the significant modifications to the FY 2014 POS survey, including changes to the phrasing of the questions and scale used, we were not able to compare this data with past fiscal years.
A
ppendices
R
ecommenda
tions
Findings
Ta
ble of
Contents
We conducted this performance audit from April 2014 through January 2015, in accordance with generally accepted government auditing standards and included such tests of internal controls as we considered necessary under the circumstances. Those standards require that we plan and perform the audit to obtain sufficient, appropriateevidence to provide a reasonable basis for our findings and conclusions based on our audit objective. We believe that the evidence obtained provides a reasonable basis for our findings and conclusions based on our audit objective. We discussed our observations and conclusions with management on December 11, 2014, and included their comments where appropriate.
We assessed the reliability of POS information. While we did not assess the reliability of data in the Accounting Data Mart, the OIG tests the financial information as part of its annual financial statement audits. We determined that the data were sufficiently reliable for the purposes of this report.
Prior Audit Coverage
Report Title Report Number Final Report Date Monetary Impact (in millions)
Retail Customer
Experience Program MS-AR-13-010 7/9/2013 $54.4
Report Results: The Postal Service could improve the effectiveness of the RCE Program by emphasizing customer satisfaction and revenue generation variables in its scoring system. The program scoring system focuses mainly on compliance and does not sufficiently factor in customer satisfaction and revenue growth variables. We estimated the Postal Service could generate
$15.4 million in additional revenue in FY 2014 if it placed greater emphasis on revenue generation and customer satisfaction
variables in the scoring system. We recommended the Postal Service place greater emphasis on customer satisfaction and revenue generation. Key considerations should include updating the scoring system to increase emphasis on the personal interaction
between the counter sales associate and customer to improve customer satisfaction and revenue generation, reassessing the 5-minute wait time in line standard, and updating guidance to reflect the objective of the program. Management disagreed with the finding, recommendation, and monetary impact.
Customer Complaint
Resolution Process MS-AR-12-007 9/10/2012
$8.8 in Questioned Cost; $17.6 in Funds Put to
Better Use
Report Results: The Postal Service is not efficiently and effectively resolving customer complaints and is closing complaints before customers consider their cases resolved. We found nearly 6 percent of complaints (180,000 cases) where customers lodged follow-up complaints after the Postal Service “closed” their initial complaint. We estimated the Postal Service could have avoided costs of $8.8 million for the 12-month period ending March 31, 2012, if it handled complaints more efficiently. The Postal Service also did not adequately monitor complaint resolution. We identified similar concerns in a 2009 audit and the Postal Service agreed to take corrective action at that time, but discontinued the action later. Lastly, system performance and data issues have hindered the Postal Service’s ability to efficiently address and resolve complaints. We recommended the Postal Service develop a mechanism to incorporate customer feedback regarding complaint resolution into the system; require current policies and procedures to be followed until planned updates are finalized; identify system deficiencies anddesired enhancements and work to correct them; develop a strategy for reducing repeat complaints; and develop a mechanism for tracking system usage and response wait times and ensuring that ongoing actions related to archiving data and monitoring outages continue. Management agreed with the findings, recommendations, and monetary impact.
A
ppendices
R
ecommenda
tions
Findings
Ta
ble of
Contents
Appendix B:
Management’s Comments
A
ppendices
R
ecommenda
tions
Findings
Ta
ble of
Contents
A
ppendices
R
ecommenda
tions
Findings
Ta
ble of
Contents
A
ppendices
R
ecommenda
tions
Findings
Ta
ble of
Contents
A
ppendices
R
ecommenda
tions
Findings
Ta
ble of
Contents
Contact Information
Contact us via our Hotline and FOIA forms, follow us on social networks, or call our Hotline at 1-888-877-7644 to report fraud, waste
or abuse. Stay informed. 1735 North Lynn Street Arlington, VA 22209-2020
(703) 248-2100