http://espace.library.curtin.edu.au/R?func=dbin-jump-full&local_base=gen01-era02&object_id=20768
Citation:
Preston, Alison and Austen, Siobhan (2001) Women, superannuation and the SGC., Women's Economic Policy Analysis Unit (WEPAU) Discussion Paper: no. 14, Curtin University of Technology, School of Economics and Finance.
Additional Information:
If you wish to contact a Curtin researcher associated with this document, you may obtain an email address from: http://find.curtin.edu.au/staff
Permanent Link:
The attached document may provide the author's accepted version of a published work. See Citation for details of the published work.
Women, Superannuation & The SGC
by
Alison Preston & Siobhan Austen
Women’s Economic Policy Analysis Unit
Curtin University of Technology
Discussion Paper Number 14
July 2001
Women’s Economic Policy Analysis Unit (WEPAU), Curtin Business School, Curtin University of Technology
GPO Box U1987, Perth 6845.
WOMEN, SUPERANNUATION AND THE SGC.# Alison Preston & Siobhan Austen
Department of Economics & Women’s Economic Policy Analysis Unit
Curtin University of Technology ABSTRACT
Superannuation is the Commonwealth Government’s preferred system for the provision of income in retirement. Generous taxation concessions together with legislated
employer compulsory contributions underpin recent growth in the coverage of superannuation. By definition, occupational superannuation benefits those with a strong attachment to the workforce. Employment in a part-time capacity and, or, a low-paid, low status occupation places a significant constraint on the capacity of individuals to accumulate retirement savings. The policy shift towards this form of retirement income system thus has particular adverse consequences for women. Using micro-simulations this paper estimates the final lump-sum that women with a range of different work and other characteristics could expect to save under a Superannuation Guarantee accumulation arrangement. Adequacy assessments suggest that, even under a fully-matured SGC system, a typical woman will remain heavily dependent on the age pension in retirement. The results highlight the need for greater public debate over government policy with respect to the whole retirement income system rather than a narrow focus on superannuation.
1. Introduction
Since the mid 1980s there has been a policy shift to extend private
superannuation coverage to a broad group of labour market participants. Minimum compulsory employer superannuation contributions are now provided for under the Superannuation Guarantee Charge (SGC) Act 1992. Generous taxation concessions have also been used to encourage and promote private contributions to superannuation schemes.i It is widely believed that the
combined effect of these policies will be a reduction in reliance on the government provided, means-tested, age pension.
# The results reported in this paper derive from a larger report (Austen, Jefferson and Preston, 2001) prepared for the West Australian Women’s Policy Office. We would like to thank the WPO for financial support and permission to publish the results in this forum. We also acknowledge the valued comments and suggestions received from WPO and Ms Joan Malpass in particular. The paper was presented at the 2001 National Social Policy Conference, Sydney, 4-6 July.
While the SGC and taxation provisions do offer an opportunity for many retirees to achieve an increased income in retirement, occupational superannuation, by definition, benefits those with a strong labour market attachment. Those outside the labour market or with a weak attachment to the workforce are likely to be most disadvantaged by the arrangements. In this respect the framework underpinning the government’s current retirement income system is gender biased. A woman’s capacity to secure an adequate retirement income within the system is significantly constrained by her traditional role as ‘wife and mother’ which, for many, results in financial dependence on a partner, broken work patterns, and employment in low paying jobs, often of a part-time/casual nature. In the remainder of this paper lifetime micro-simulation models that estimate the superannuation savings of women with typical patterns of involvement in the paid workforce are developed. The models are used to examine the capacity for women to achieve an adequate income in retirement under the current system. The results suggest that, even with significant changes in the current labour market attachment behaviour of women, their ability to achieve a sufficient retirement income under a system based on occupational superannuation will remain significantly constrained.
The paper is organised as follows. Section 2 provides a brief overview of the current retirement income system. Section 3 details the methodology used to construct the micro-simulation models. Simulation results are presented in Section 4 with an assessment of the adequacy of women’s retirement income to meet their basic needs in Section 5. Section 6 concludes the paper.
2.
The Australian Retirement Income System
The Australian retirement income system has three main pillars or strands: the age pension, which is a means tested, flat rate, non-contributory payment funded from government general revenue; private occupational superannuation, which consists of compulsory and voluntary contributions; and other private savings, such as property investments.
The focus of the debate over the future of the retirement income system is on the relative importance attached to the age pension as opposed to occupational superannuation. The age pension was first introduced in Australia in 1909 in response to destitution among the aged. The basic policy objective was to ensure adequate levels of income for those who had reached retirement age (King, Baekgaard and Harding 1999). Unlike many schemes that developed overseas, the age pension in Australia was not based on income-related contributions
made during a person’s working life. Rather, the age-pension was (and is) funded from general taxation revenue. As at September 2000, the maximum weekly pension rate for an individual and a couple was $197.05 and $328.90, respectively. The rates are indexed to inflation and are legislated to equal 25 per cent of male average total weekly earnings (MATWE) (40 per cent in the case of couples).
When first introduced the demand for the age pension was expected to be low. In the early 1900s life expectancy at birth was 55.2 years for men and 58.8 years for women (Beal and McKeown, 2001). Today life expectancy at birth is around 75.9 years for men and 81.5 years for women (ABS 3302.0).Together with falling fertility rates, this demographic change challenges the capacity of governments to fund retirement income needs from general tax revenue. Private occupational superannuation is now actively promoted by the Federal government as an alternative to reliance on the age-pension.
Although occupational superannuation schemes have been in operation within Australia for more than 50 years, prior to the early 1980s they were essentially confined to male professionals, managers and public servants. Significant expansion of the system to other occupational groups occurred during the Accord era of the 1980s when superannuation provisions were incorporated into awards and superannuation was used as a means of granting (deferred) wage increases while, at the same time, avoiding contributing to inflation. Following the introduction of the SGC in 1992, superannuation arrangements were further extended. Under this Act employers have to make a minimum contribution to an approved superannuation scheme.
The initial compulsory contribution rate under the SGC was 3 per cent of gross earnings. Over the 1990s the mandatory contribution grate was gradually raised (currently it is equal to 8 per cent). By 2003 it will equal 9 per cent. No further adjustments are provided for at this stage. A number of individuals are not covered by the SGC legislation. They include individuals who are: paid less than $450 per calendar month; in paid employment and are over 70 years old; and in paid employment, under 18 years old and do not work more than 30 hours per week.ii
Since the introduction of the SGC there has been a significant increase in the coverage of superannuation arrangements. For example, in 1990, 61.5 and 55.7 per cent of men and women employed full-time were covered by a
superannuation scheme. By 1999 the corresponding shares had increased to 96.7 and 97.3 per cent respectively (ABS Cat. 6334.0 and 6310.0).
This growth in superannuation coverage is expected to produce substantial changes in the sources of retirement income relied on by retirees. It is expected that a large proportion of future generations of older Australians will be less reliant on the age pension and more able to partly or fully self-fund their
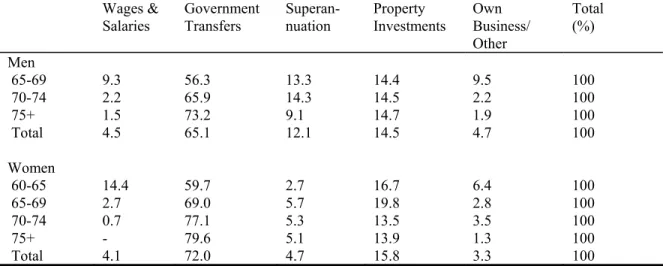
retirement income needs (Department of Family and Community Services, 1999). This change will, however, occur from a base where there is heavy reliance on the age pension. As shown in Table 1, government transfers, such as the age pension, are currently the principal source of income for most retirees. This is especially the case for women. In 1995/96, 72.0 per cent of women of retirement age, as compared to 65.1 per cent of men, relied on government transfers for their principal source of income.
Table 1:Principal source of annual income, 1995/96
Wages & Salaries Government Transfers Superan-nuation Property Investments Own Business/ Other Total (%) Men 65-69 9.3 56.3 13.3 14.4 9.5 100 70-74 2.2 65.9 14.3 14.5 2.2 100 75+ 1.5 73.2 9.1 14.7 1.9 100 Total 4.5 65.1 12.1 14.5 4.7 100 Women 60-65 14.4 59.7 2.7 16.7 6.4 100 65-69 2.7 69.0 5.7 19.8 2.8 100 70-74 0.7 77.1 5.3 13.5 3.5 100 75+ - 79.6 5.1 13.9 1.3 100 Total 4.1 72.0 4.7 15.8 3.3 100
Source: ABS Income Distribution Survey 1996/97
Furthermore, the changes in the retirement income system are occurring in an environment where income levels are low and substantial gender inequities exist. In 1996 approximately one fifth of Australians age over 65 lived in poverty (King, 1999) and almost one third of Australia’s poor were aged over 65 (King, Walker and Harding, 1999). In financial year 1997/98, amongst those aged 65 or more, 56 per cent of single people received less than $200 per week, while 60 per cent of couples received a joint income of less than $400 per week (ABS 6523.0). Low income levels are particularly skewed towards women. Table 2 reports the ratio of average income levels of women relative to men. Women’s constrained access to private sources of income such as superannuation and other savings has contributed to a gender income gap of 35 per cent amongst those aged between 65 and 69.
Table 2: Annual average income of women relative to men (%), Australia, 1995/96.
Age 55-59 Age 60-64 Age 65-69 Age 70-74 Age 75+ Age 55+ Total Gender Income
Ratio 43% 54% 65% 81% 74% 57%
Source: ABS Income Distribution Survey 1996/97.
The key concern for the remainder of this paper is whether the shift towards a retirement income system where the emphasis is on ‘self-funded’ retirement (occupational superannuation) is likely to exacerbate the gender inequities outlined above. In particular, we are interested in understanding (and
demonstrating) why women have a limited capacity to make private provision for retirement, even within the context of a system which provides compulsory employer contributions.
3. Modelling Superannuation Accumulation
An individual’s ability to accumulate a pool of savings for their retirement is heavily dependent on their income level and expenditure needs during their working life. It is well documented that a person who is relatively disadvantaged in the labour market during their working life will remain relatively
disadvantaged in retirement (Thompson, 1999; Rosenman and Wincour, 1994; Knox and Piggott, 1993; and Cox, 1994).
High income translates into both a higher level of compulsory superannuation contribution and a greater ability to engage in voluntary forms of retirement savings (e.g. via personal contributions to superannuation funds). High income also increases an individual’s ability to take advantage of tax concessions for personal superannuation contributions. Indeed, data from the ABS Survey of Employment Arrangements and Superannuation (6361.0) clearly shows that 37.9 per cent of individuals cite cost and affordability as the main reason for not
personally contributing to a superannuation fund; only 0.8 per cent cite inadequate tax concessions.
A key difference between women and men in Australia is their average level of income. The lifetime earnings of women typically fall well below those of men. For example, estimates from Harding (1991) show that the gross lifetime income of women is approximately 63.4 per cent of men’s. This income gap may be attributed to differences in women’s and men’s participation in the paid workforce over their lives; differences in their average hours of work; their different average levels of education; the different rates of pay for work of equal
worth; and occupational differences. The different roles that men and women take on within the family play a large role in explaining a number of the different workforce characteristics of men and women. For example, the role that women take on in parenting young children is critical to their lower levels of workforce participation.
In this section a micro-simulation approach is used to give greater information on the linkages between women’s patterns of paid work and their
superannuation savings under the current set of legislative provisions. The simulation exercise first estimates the probable lifetime earnings of a number of typical women and, second, computes the associated lump-sum and retirement private pension (derived from the purchase of an annuity). Comparisons are drawn between the estimates of the retirement incomes of women with different degrees of attachment to the paid workforce. The different estimates serve to highlight the importance of education, occupation of employment, hours of employment as well as timing and length of exits from the paid workforce, in a retirement income system where the emphasis is on self-funded retirement.
Data and Approach
Estimates of the amount of savings an individual could accumulate under particular occupational superannuation arrangements requires data on: the lifetime earnings of the individual; information on the proportion of their income devoted to superannuation at different stages of their working life; as well as estimates of rates of return on these investments net of taxes, fees etc. As will be shown below, each of these prerequisites raise issues about appropriate sources of data and the use of these data to forecast future outcomes for individuals with different economic, social and demographic characteristics.
Estimates of Lifetime Earnings
Estimation of lifetime earnings for the purposes of this micro simulation exercise basically involves identifying patterns of earnings across the careers of
individuals with different characteristics. Longitudinal data, which traces the experience of individuals over extended periods of time, would be ideal for such a purpose. However, such data are, as yet, unavailable in Australia and, thus, alternative approaches to this part of the estimation problem must be sought. In the absence of such data we derive estimates of lifetime earnings using data from the ABS 1996/97 Income Distribution Survey (IDS96). The procedure involves three steps. First we identify the average annual ‘starting’ salaries of a typical young person (aged 20) who works full-time (35 hours or more per week),
resides in a metropolitan area and was born in Australian.iii In 1996 the average
annual wage for such a person was $20,997. The starting salaries of men are inflated by 10.5 percent to take account of current gender-based wage differences.iv
In the second stage of the estimation process, the IDS96 data set is used to generate a set of separate wage equations for men and women employed full-time. In these models we control for level of education, years of potential labour market experience, birthplace, marital status, presence and age of dependent children. The full details of these models, together with the results, are presented in Appendix A.
The coefficient estimates on labour market experience from these models are used in the third stage of the estimation process to generate a set of age-earning profiles for men and women employed full-time.v We do this by combining the
coefficient estimates on the experience variable from the earnings equations with the information on estimated average starting salaries ($20,997 for women and $23,203 for men). The resultant profiles are summarised in columns 2 and 3 the following table.vi By discounting the projected earnings figures by a factor of
24/38.5 (which represents the common ratio of part - time to full-time hours) we are able to estimate the level of part-time earnings of women at different ages (see column 5 of Table 3).vii
Table 3:Estimated Average Annual Earnings, Disaggregated by Age, Sex and Labour Force Status 1996/97 Men (employed full-time) Women (employed full-time)
Gender Wage Ratio
(full-time) Time Earnings for Estimated Part- Women $ $ % $ aged 20-24 24788 22522 91 14039 aged 25-29 28825 26105 91 16273 aged 30-34 32282 29056 90 18113 aged 35-39 34809 31045 89 19353 aged 40-44 36129 31830 88 19842 aged 45-49 36083 31307 87 19516 aged 50-54 34667 29528 85 18407 aged 55-59 32030 26697 83 16643 aged 60-64 28452 23131 81 14419
Importantly, this estimation procedure can be repeated for particular sub-groups in the population to identify a range of different experience-earnings profiles. For example, the regression analysis can be restricted to individuals with higher
levels of qualifications. The models can also be estimated to identify the earning profiles for, say, migrant women and women who live in rural areas.
We believe this approach to estimating a lifetime earnings profile is the best alternative available and it enables us to maximise the value of the information on the individual characteristics that affect earnings in the IDS96 data set. However, we do acknowledge several limitations still exist with the data and approach. First, using one year’s survey data to estimate lifetime earnings
requires that some assumptions are made about the rate of earnings growth over time. We assume that the real rate of earnings will remain constant at 1996 levels. We also assume the absence of any productivity growth (e.g. associated with growth in overall levels of GDP). Thus, any observed earnings growth over time has been entirely attributed to the effects of enhanced skills and knowledge (as reflected in length of labour market experience). In reality the future pattern of wage growth may be different from this scenario.viii
A second limitation is that our calculations are based on gross wage rates. No allowance has been made for the personal income tax rates that apply to
individuals with different income levels. This feature of the estimation process will tend to overestimate the level of earnings inequality, for example, between men and women. However, as superannuation contributions are based on gross income, the distortion caused to comparisons of superannuation savings will be minimal.
Third, the estimates are based on an assumption that current rates of return to labour market attributes such as experience will remain constant over time. This also may not be realised and, as a result, actual levels of earnings and
superannuation savings may differ from those predicted here.
Estimates of Superannuation Savings
As mentioned above, the amount of superannuation savings that an individual accumulates by the time of their retirement will be a function of their lifetime earnings, the proportion of their income they devote to superannuation over their working life and the rate of return on these savings. Thus, to estimate the level of superannuation savings that an individual with particular characteristics accumulates we combine the above estimates of lifetime earnings with several assumptions about the nature of and returns to the individual’s superannuation savings. These assumptions, which are based on current regulatory
• Contributions to superannuation savings comprise only the minimum amounts mandated by the SGC.ix The SGC will be fully phased in by July
2002, at which time the rate of compulsory contributions will be set at 9 per cent.
• Earnings in the superannuation funds increase at a real rate of interest equal to 3.25 per cent per annum.x
• A 15 per cent tax is levied on contributions. No allowance is made for a superannuation surcharge or other taxes (including taxes on retirement income).
• The preservation age for women and men is 65 years.
• Women re-entering the workforce after a career break commence at the hourly rate they were on prior to leaving employment.
Factors relating to these assumptions are applied to our estimates of earnings to generate predictions about the level of superannuation savings of Australian men and women
Stereotypes to Demonstrate the Effects of Wage Differences and Labour Force Attachment on Superannuation Savings
To simplify the description of the effects of wage rates and working patterns on superannuation savings we define five stereotypical individuals and identify their levels of savings. All the individuals were born in Australia and reside in a metropolitan area. They include:
• John and Tracey: They both enter the workforce at the age of 20 in 2000 and work continuously, on a full-time basis, until they retire at the age of 65 (in 2045). John and Tracey both have average levels of education.
• Sandra: She has the same level of education and age of entry to the labour market as Tracey. However, her workforce history differs in that she
withdraws from the workforce at the age of 27 to have her first child and remains out of the workforce until she is 34 (and her second child is 5 years old). Sandra returns to work on a full-time basis and does not retire until she is 65.
• Valerie: To simplify the comparisons across the individuals, Valerie also has the same level of education and age of entry to the labour market as Tracey. Her distinguishing characteristic is that, although she also spends the years from when she is 27 to when she is 34 out of the workforce, she returns to work on a part-time basis (working continuously on this basis until 65).
• Audrey: She also has the same general characteristics of the other women. However, after leaving the workforce at the age of 27, Audrey does not return to paid work.
The following diagram (figure 1) identifies the estimated earnings of these five individuals over their careers, whilst the Table 4 provides a comparison of their gross lifetime earnings and levels of superannuation savings.
Figure 1
Hypothetical Age Earning Profiles For Different Labour Market Groups 0 5000 10000 15000 20000 25000 30000 35000 40000 Age John Tracey Sandra Valerie Audrey
Table 4:Gross lifetime earnings and superannuation for five stereotypical individuals
Gross Lifetime Earnings Superannuation Accumulation
Gross lifetime earnings % of John’s lifetime Earnings % of Tracey’s lifetime earnings Total super. accum. % of John’s total super. % of Tracey’s total super. John $1,440,000 100% - $233,000 100% - Tracey $1,256,000 87% 100% $206,000 88% 100% Sandra $924,000 64% 74% $144,000 62% 70% Valerie $637,000 44% 51% $106,000 45% 51% Audrey $163,000 11% 13% $43,000 19% 21% Assumption: all individuals commence work at age 20 in 2000 and retire at age 65 if in the paid workforce at that time. The dollar estimates reported here are real dollars at 1996 levels.
Workforce Attachment and Superannuation Accumulation
The differences in the lifetime earnings and superannuation savings of the five individuals reflect the impact of several labour market features and their relationship with superannuation outcomes. The gross lifetime earnings of Tracey, for example, are 13 per cent lower than John’s. Her superannuation savings are 12 per cent lower than John’s. The observed gap between John and Tracey is the product of two forces: (a) a gender wage gap in the earnings of males and females employed full-time; and (b) a gender gap in the rate of return to additional years of labour market experience. The outcomes are net of the effects of other factors known to affect earnings (such as, education, hours of work, birthplace and other demographic characteristics such as marital status and children). The comparison of John and Tracey thus highlights the
importance of labour market discrimination for women’s relative income both pre- and post-retirement.
The comparison of Sandra’s lifetime earnings with that of Tracey’s highlights the large financial cost borne by women when they leave the workforce to care for children. Sandra’s lifetime earnings are reduced by 26 per cent by the seven-year absence from work. The impact on her post-retirement income is even more dramatic, as this falls by 30 per cent, due to the lost contributions and the benefits of compound interest at a relatively early stage of her retirement savings.
The lifetime earnings and superannuation savings of Valerie clearly demonstrate the influence of extended periods of part-time employment. Part-time
employment is often used as a way of combining work and family
responsibilities (see Austen and Birch, 2001). The gross lifetime earnings of Valerie relative to Sandra are equal to 69 per cent. However, because Valerie was able to make superannuation investments during the early part of her career
when she was employed full-time, her overall level of superannuation on retirement is equal to 74 per cent of the equivalent amount accumulated by Sandra. The estimates, therefore, show that if women are able to accumulate superannuation contributions in the early part of their careers, the disadvantage in terms of their retirement incomes caused by part time work, although large, can be less than the loss in lifetime earnings. The result reflects the effects of compounded interest, where earnings (interest payments) are reinvested and compounded over a longer period of time to increase final returns.
As could be expected Audrey’s absence from the workforce after childbirth has a dramatic impact on her lifetime earnings and superannuation savings. Over her lifetime she earns 18 per cent of the lifetime earnings that flow to Sandra. The level of superannuation accumulated by Audrey equals 30 per cent of the level accumulated by Sandra. Again, the difference in these figures reflects the influence of early contributions to superannuation.
The Role of Education and Occupational Status on Superannuation Savings
Thus far we have used information on men and women with average (high school) levels of education to generate our lifetime earning profiles and to estimate the impact of labour force attachment on superannuation. Rates of return to additional years of labour market experience are, however, affected by education and occupation. Degree holders, for example, are more likely to be employed in a professional capacity than persons who left school without
completing high school. Their earning profiles will be both higher (higher initial starting wage) and steeper (faster rate of growth) (Miller, 1982). Over their lifetime, such individuals are likely to accumulate higher levels of earnings and superannuation.
To examine the effects of education and occupational status on superannuation savings, separate wage equations were estimated using the IDS96 data for three stereotypical individuals: (a) a professional man (Bruce); (b) a professional woman (Deirdre); and ( c) a woman employed as a cleaner (Fiona). The
coefficient estimates on labour market experience from these regressions were combined with information on the starting salaries of these individuals to construct age-earning profiles for our new set of hypothetical individuals. The profiles are illustrated in figure 2 below.xi
Figure 2: Earning Profiles by Occupation and Gender 0 5000 10000 15000 20000 25000 30000 35000 40000 45000 A ge Men-Prof essional Women-Prof essional Women-Average Women-Cleaners
Table 5 shows the gross lifetime income of the professionals (Bruce and Deirdre) and our cleaner (Fiona), together with estimates of their superannuation
accumulation at retirement. It should be noted that we employ a rather extreme assumption here in that we assume that all these individuals work on a full-time continuous basis until retirement at age 65. Our aim at this stage is simply to highlight the effects of education and occupational attainment on women’s lifetime earnings and retirement income.
The results show that the higher earnings of our professional woman (Deirdre) has allowed her to accumulate a level of superannuation that is 13 per cent higher than that accumulated by a woman with an average level of
education/occupational status (such as Tracey). The level of superannuation accumulated by Fiona, a cleaner, is almost 40 per cent less than Tracey’s.
Table 4: Gross lifetime earnings and superannuation for different occupational groups
Gross Lifetime Earnings Superannuation Accumulation
Gross lifetime earnings % of average woman’s lifetime Earnings Total super. accum. % of Tracey’s total super. Bruce - Professional $1,688,000 134% $273,000 133% Deirdre – Professional $1,426,000 114% $234,000 113% Tracey – Average $1,256,000 100% $206,000 100% Fiona – Cleaner $751,000 60% $125,000 61%
Assumption: all individuals commence work at age 20 in 2000 and are employed on a full-time continuous basis until retirement at age 65 in 2045. The dollar estimates reported here are real dollars at 1996 levels.
Table 6 re-estimates the lifetime earnings and superannuation levels for the three women (Deirdre, Tracey and Fiona) taking into account a seven year career break. Two sets of comparisons are presented. One assumes a career break between the age of 27-34. The other delays child-birth and assumes a seven year career break between the age of 32-39. The objective of the exercise is twofold: (a) to show, as before, how periods of labour market absence impact on the earnings of different representative women; and (b) to demonstrate how the timing of children impacts on outcomes.
Table 6: Effects of delaying children on earnings and superannuation.
Gross Lifetime Earnings Superannuation Accumulation if has a career break age 27-34 if has a career break age 32-39 % difference if has a career break age 27-34 if has a career break age 32-39 % difference Deirdre (Professional) $1,059,000 $1,111,000 4.9% $164,000 $178,000 8.5% Tracey (Average) $924,000 $973,000 5.3% $144,000 $156,000 8.3% Fiona (Cleaner) $617,000 $625,000 1.3% $96,000 $101,000 5.2%
A comparison of the results in Tables 5 and 6 shows that when Deirdre, a professional woman, has a seven year career break between the ages of 27 and 34, her final superannuation or lump-sum is 30 per cent lower than her
counterpart who has no career break. If she were to delay childbirth (e.g. assume a 7 year exit between the ages of 32 and 39) her relative lifetime earnings would increase by 4.9 per cent, while her superannuation funds would grow by 8.5 per cent (see Table 6). The result derives from the loss in workforce experience during a period of relatively high earnings growth and reduced capacity to gain from compounded interest payments. The effect is smaller for less qualified women and those in low paid jobs (such as cleaning).
Other Determinants of Superannuation Savings
Birthplace and Location
Clearly there are numerous other factors that will combine to affect the level of earnings and superannuation funds accumulated by women. For example, women born in non-English speaking countries earn around 7.4 per cent less than women born in Australia (Preston 2001, p.157). Indigenous women earn considerably less than non-indigenous women. It is beyond the scope of these paper to take all these other factors into consideration except to say that these
wage gaps will have a proportionately depressing effect on lifetime earnings and superannuation accumulation.
Baby Boomers
The age of retirement and number of years contributing to the fund will also, clearly, affect levels of funds accumulated. One group that is particularly at risk in the near-future is the ‘baby boom’ generation (comprised of people born between 1946 and 1964). At the time of the introduction of the SGC in 1992, the oldest baby boomers were aged 46 and the youngest aged 28. Table 7 shows estimated levels of superannuation that our ‘average’ hypothetical individuals (John, Tracey, Sandra, Valerie and Audrey) could expect to accumulate
depending on their age at the time of the introduction of the SGC. Estimates are all provided in real 1996 dollars. Column 3 shows levels of superannuation that might be generated if the individual was covered by the SGC throughout their entire working life; column 4 shows estimates for ‘young baby boomers’ (those aged 20 in 1984); column 5 shows estimates for ‘old baby boomers’ (those aged 20 in 1966).
Table 7: Baby Boomers and Superannuation
Gross Lifetime Earnings Total Super.a Accum. (original) Total Super.b Accum. for ‘young’ BBs Total Super.c Accum. for ‘old’ BBs $(‘000) John – FT $1,440,000 $233,000 $149,000 $46,000 Tracey – FT $1,256,000 $206,000 $129,000 $39,000 Sandra (FT, break, FT) $924,000 $144,000 $95,000 $33,000 Valerie (FT, break, PT) $637,000 $106,000 $59,000 $21,000 Audrey (FT, break, out) $163,000 $43,000 $0 $0
Real dollars at 1996 levels. Notes: In all cases it is assumed that the individuals started work at age 20. In the case of: (a) aged 20 in 2000; (b) age 20 in 1984; (c) age 20 in 1966.
Under the SGC, and assuming no change in the employer contribution rate of 9 per cent post 2003, the most that a ‘young’ average baby-boomer who has had time out of the labour market and has returned to part-time employment could expect to accumulate would be $59,000 (see Valerie). If the same person was an ‘old’ baby-boomer she would save $21,000 under the SGC over her working life.
The Legal Framework
The legal framework associated with the current superannuation system also has an important effect on the level of superannuation funds generated under the SGC. For example, under existing legislation employers are not required to make compulsory superannuation contributions for employees earnings less than $450 in a calendar month.xii The level of compulsory contributions to superannuation
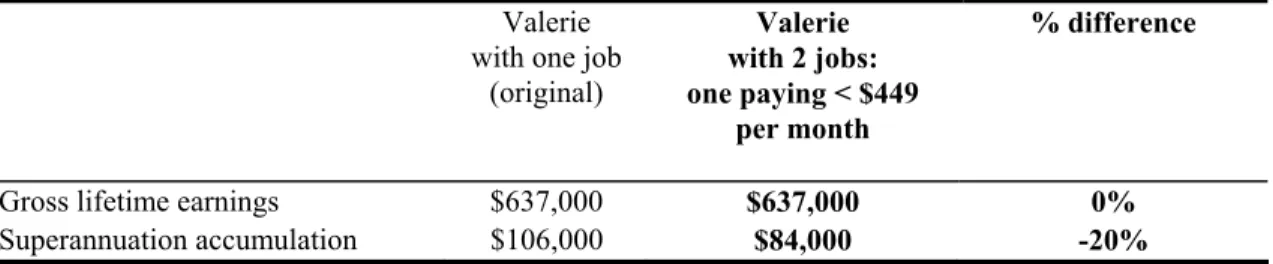
and taxation arrangements also impacts on the level of superannuation savings. To examine the impact of the ‘$450 per month’ rule on the retirement incomes of some women we use Valerie (our part-time worker) and assume that she works 24 hours a week in two jobs (rather than one). In one job she earns $449 in a calendar month and is, therefore, not entitled to superannuation on those
earnings. The results of this simulation are shown in Table 8. Although Valerie’s gross lifetime earnings remain unchanged, her level of superannuation at
retirement is 20 per cent lower.
Table 8: Effect of the $450 threshold on levels of superannuation.
Valerie with one job
(original) Valerie with 2 jobs: one paying < $449 per month % difference
Gross lifetime earnings $637,000 $637,000 0%
Superannuation accumulation $106,000 $84,000 -20%
One way to raise savings for retirement would be to legislate for a higher rate of compulsory contribution. When fully implemented (in 2003) the SGC will
provide for a level of mandatory employer contributions equal to 9 per cent. The Association of Superannuation Funds of Australia (ASFA) is, however, currently lobbying the government to raise the level of compulsory contributions to 12 per cent.
Table 9 demonstrates the effects that this change in compulsory contributions would have on the overall level of superannuation savings. It is assumed that the movement towards the 12 per cent contribution rate would be gradual: for
example, 10 per cent in 2005 and 2006, rising to 11 per cent in 2007 and 2008, and 12 per cent in 2009. The estimates show that an increase in the compulsory savings rate would deliver significant increases in the superannuation funds accumulated by individuals eligible for superannuation. For example, Valerie (who works part-time and has a 7 year career break), would see a 20.8 per cent increase in her superannuation savings over her lifetime.
Table 9: Effects of an increase in compulsory savings from 9% to 12%
John Tracey Sandra Valerie Audrey
Gross superannuation accumulated under current arrangements
$233,000 $206,000 $144,000 $106,000 $43,000
Gross superannuation with a gradual increase in the rate from 9% to 12%
$295,000 $260,000 $178,000 $128,000 $45,000
Percentage change (%) 26.6% 26.2% 23.6% 20.8% 4.7%
Note: the estimates here are for a representative person aged 20 in 2000. The assumed age of retirement is 65.
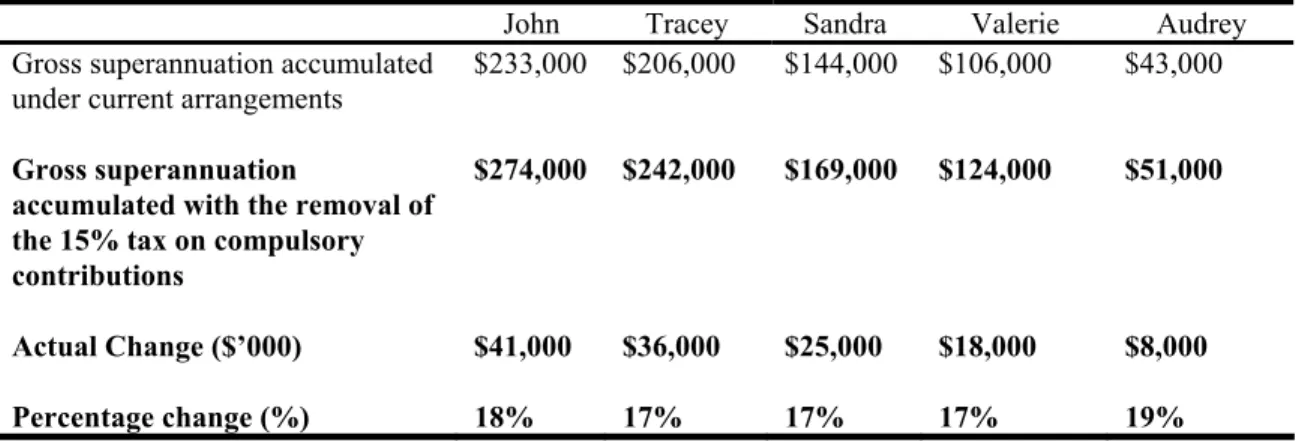
ASFA have also called for a removal of the 15 per cent government tax on
compulsory contributions by employers. Their estimates suggest that this would add $55,000 to a lump-sum, although it is not entirely clear what assumptions under-pin their estimate and precisely who would accumulate the additional $55,000.xiii Table 10 shows how a removal of this tax would affect our five
‘average’ representative people. John, an ‘average’ Australian born male who works on a full-time continuous basis from age 20 to 65 would accumulate an additional $41,000 (18%) over his lifetime following a removal of the 15 per cent tax. Valerie, would increase her superannuation savings by 17 per cent, or $18,000.
Table 10:Effects of a removal of the 15% tax on compulsory contributions
John Tracey Sandra Valerie Audrey
Gross superannuation accumulated under current arrangements
$233,000 $206,000 $144,000 $106,000 $43,000
Gross superannuation
accumulated with the removal of the 15% tax on compulsory contributions
$274,000 $242,000 $169,000 $124,000 $51,000
Actual Change ($’000) $41,000 $36,000 $25,000 $18,000 $8,000
Percentage change (%) 18% 17% 17% 17% 19%
Note: the estimates here are for a representative person aged 20 in 2000. The assumed age of retirement is 65. Real 1996 dollars.
Finally, the retirement income of individuals who are married or in other long-term relationships will be affected by the sharing of resources and assets within the family. Some individuals may choose to save for retirement through
contributions to shared assets (such as the family home) and/or supporting a partner’s career and, thus, the family’s future income. However, such options are prone to the risks associated with marriage breakdown and, thus, retirement incomes are also affected by laws relating to the division of assets, including superannuation in the event of divorce.
5. Adequacy Assessment
Thus far we have derived estimates of the level of superannuation for a range of different individuals/scenarios. These estimates have highlighted the importance of factors relating to workforce attachment, education, occupation, other
determinants of wages and legislative provisions to the level of superannuation savings. However, we have yet to comment on whether the estimated levels of superannuation are sufficient to fund the income needs of retirees.
Assessing the adequacy of the level of retirement income generated under
occupational superannuation arrangements is difficult. Answers as to how much is needed for retirement vary considerably from a minimum of 25 per cent of male average weekly total earnings (AWTE) to 100 per cent of pre-retirement income. However, most financial planners suggest that 75 per cent of pre-retirement earnings is a good pre-retirement income target.
In this section we refrain from providing specific income targets, as the funds required in retirement will clearly vary across individuals depending on their set of circumstances and access to other financial/liquid assets (such as, private savings and home ownership). Our approach, instead, involves estimating the present value of an annuity (a series of regular, for example, annual payments) which will flow to an individual following conversion of a lump-sum payment from a superannuation fund. This is then compared to the income level that is currently provided by the maximum level of the age pension.
The annuity that is used in our calculation results in complete exhaustion of the lump-sum by the time of death. As before, we base our calculations on our representative individuals who retire at 65.
The formula used to compute the present value of an annuity with the principal completely exhausted may be written as follows:
r r A R −n + − = ) 1 ( 1
where: r measures the real rate of interest (as before, assumed to be equal to 3.25 per cent); A is the lifetime annuity purchased with a lump sum from the
superannuation fund at retirement (we assume that the lump sum is not subject to tax); and n measures the number of payments. We base our number of
current life expectancies for Australian men and women, n is equal to 11 years for men and 17 years for women.xiv There is no adjustment for inflation;
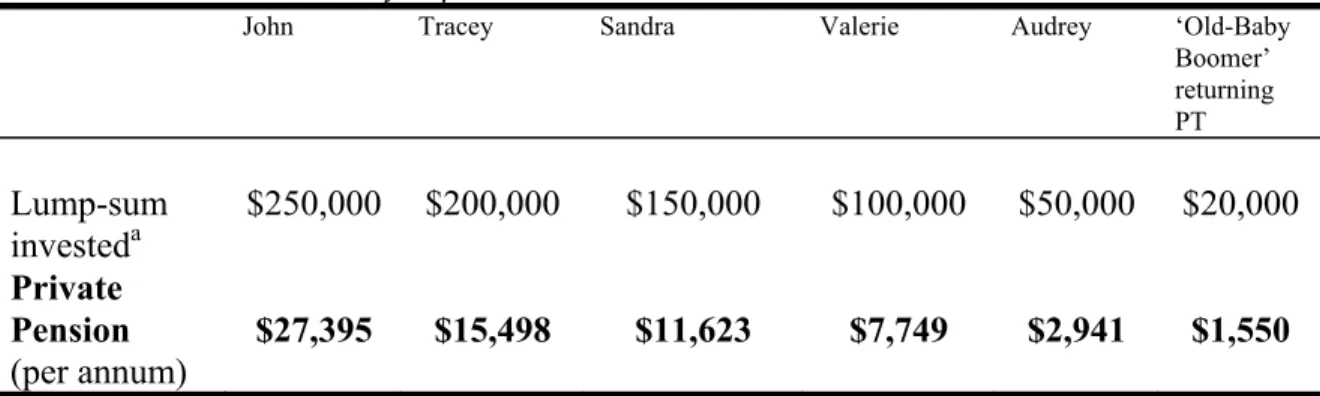
estimates provided are in real 1996 dollars. Table 11 shows the annual payments that would flow from various lump-sum investments.
Table 11: Present value of superannuation annuities
John Tracey Sandra Valerie Audrey ‘Old-Baby
Boomer’ returning PT Lump-sum investeda $250,000 $200,000 $150,000 $100,000 $50,000 $20,000 Private Pension (per annum) $27,395 $15,498 $11,623 $7,749 $2,941 $1,550
Notes: (a) the amounts shown here are for general assessment purposes. They correspond closely to the gross superannuation accumulated by our representative individuals: John ($233,000); Tracey ($206,000); Sandra ($144,000); Valerie ($106,000) and Audrey ($43,000).
The gender difference apparent in a comparison of Tracey and John’s outcomes reflects, in large part, differences in the life expectancies of men and women. If we were to assume that John would also live for 17 years post retirement (rather than 9), the annuity that he could purchase with his lump-sum of $250,000 would only deliver an annual income stream of $19,372.
To assess the adequacy of these annuities we compare them to income levels available under the age pension. The maximum age pension, as indicated earlier, is equal to 25 per cent of male ATWE, or $8753 per annum in 1996.
The estimates show that, under the current arrangements for superannuation, Valerie (who has a seven year career break and returns to the paid workforce on a part-time basis working 24 hours per week until retirement at age 65) would, in the absence of any other income source (such as the age pension), have an
income stream in retirement roughly equivalent to the current age pension. In other words, without making additional private savings (either in the form of superannuation or through other forms of investment such as property), Valerie’s capacity to generate a retirement income above the minimum is considerably constrained within the SGC (compulsory) occupational
superannuation system. In the absence of other sources of income, Audrey (who leaves the paid workforce at age 27 and never returns) would have a private pension equal to around one third of that provided by the age pension. The results also suggest that many ‘baby boomers’ will have little in the way of a
private pension and will continue to depend on the age pension (either in part or in full) during their retirement years.
The significance of these results lie in the fact that Valerie’s and Audrey’s labour force characteristics are similar to many Australian women’s. For example, data on participation arrangements and working hour arrangements show that, of all women aged 35 or more, around 24 per cent are in full-time employment, a further 21 per cent are in part-time employment (the majority of these women work less than 29 hours per week). The balance, 55 per cent, of women aged over 35 are not in paid employment (ABS Cat No. 6203). Given these estimates our modest assumptions may still be rather extreme. We assume, for example, that Valerie returns to part-time employment (24 hours per week) until retirement at age 65.
In summary our findings indicate that, in the absence of a significant change in the employment patterns of women, their outcomes under a fully matured 9 per cent Superannuation Guarantee accumulation arrangement will be equivalent, on average, to the full age pension.
Government predictions suggest that the SGC will not significantly change the number of retirees claiming the age pension, although the new arrangements could be expected to increase the number receiving only a part pension (see Gallery, Brown and Gallery, 1996, for further discussion). Estimates presented in this paper suggest that many women with weak attachment to the workforce will remain dependent on the full age pension (assuming no other sources of income, such as spouse’s superannuation or personal savings). Other women with a strong attachment to the workforce, albeit in a part-time capacity, will also be heavily dependent on the government age pension system in retirement. As at July 2000 the maximum fortnightly income a single person could receive and still be eligible for the full age pension was $106 per fortnight or $2756 per annum. The pension disqualifying income limit for a single person was $1087 per fortnight ($28,262 per annum).xv
The results thus highlight the need to ensure that changes in the retirement income system are broad based and designed to benefit all members of the community. Whilst tax concessions aimed at encouraging private savings are laudable, they should not be made at the expense of the age pension.
6. Summary and Conclusion
This paper uses a number of micro-simulations to assess how a shift towards a retirement income system centred on occupational superannuation might impact on the economic well-being of women and those with intermittent patterns of labour market activity. It is frequently argued that increased workforce
attachment (even if in part-time work) together with the SGC, should substantially improve the financial circumstances of women in retirement. The results of the micro-simulations detailed in this paper, however, caution against such generalisations. Women who are employed on a part-time basis throughout most of their working life, or who have extended period of absence from the workforce, will struggle to achieve income levels in retirement
equivalent to the current full age pension. Removal of the $450 threshold level and the 15 per cent employer contribution tax could make a significant difference to the level of superannuation funds accumulated by some Australian women. There is, however, a need to broaden the current debate over retirement incomes away from a narrow focus on superannuation. Many women with a weak
attachment to the workforce will remain heavily dependent on the government age pension in retirement. There is a danger that the current policy shift in favour of compulsory savings in private superannuation schemes will see a magnification of current retirement income inequities and a retreat by government from its obligations to all retirees.
References
Association of Superannuation Funds of Australia (ASFA) (1999), “Achieving an adequate retirement income – how much is enough? ASFA Research Centre Discussion Paper.
Austen, S. and Birch, E. (2001), “The Working Lives of Women and Their Retirement Incomes”, Western Australian Quarterly Bulletin of Economic Trends, 1.01: 75-92.
Austen, S. Jefferson, T. and Preston, A. (2001), “Women and Retirement Income: Issues and Inequities”, Report prepared by for the WA Women’s Policy Office, April.
Beal, D. and Mc Keown, W. (2001), Personal Finance, John Wiley and Sons, Brisbane, Australia.
Blinder, A. (1976), ‘On Dogmatism in Human Capital Theory’, Journal of Human Resources, 11(1): 8-22.
Cox, E. (1994), 'Super for Unwaged and Low Waged Women', in Women and Superannuation: Selected Seminar Papers, EPAC Back ground paper No. 41, Economic Planning and Advisory Council and Office for the Status of Women, Canberra, 30-47.
Department of Family and Community Services, (1999) [newsletter].
Gallery, N., Brown, K. and Gallery, G. (1996), ‘Privatising the Pension’ Journal of Australian Political Economy, 38:98-124.
Harding, A. (1991), 'Social Security, Cash Transfers, income Taxes and the
Distribution of Lifetime Income in Australia', in P. Saunders, and D. Encel, Social Policy in Australia, Options for the 1990s, proceedings of National Social Policy Conference, Sydney 3rd -5th July 1991, Kensington Publishing.
King, A. (1999), ‘Trends in the Distribution of Australian Incomes’, Paper Presented to the Anglicare National Conference Melbourne 20-21 May, Canberra, National Centre for Social and Economic Modelling.
King, A., Baekgaard, H. and Harding, A. (1999), Australian Retirement Incomes, Discussion Paper no. 43, National Centre for Social and Economic
Modelling, University of Canberra, August.
Knox, D. and Piggott, J. (1993), Contemporary Issues ion Australia's Superannuation: A Conference Summary, Research Paper No. 12, Superannuation Economics Research Group, University of New South Wales, Sydney, September. Miller, P.W. and Rummery, S. (1991), ‘Male-Female Wage Differentials in
Australia: A Reassessment’, Australian Economic Papers, 30(5): 50-69. Miller, P. (1982), 'The Rate of Return to Education', the Australian Economic
Review, 3rd Quarter, No. 59: 23-32.
Preston, A.C., (2001) The Structure and Determinants of Wage Relativities: Evidence from Australia. Aldershot: Ashgate Publishing Limited.
Preston, A.C. (2000b), ‘Equal Pay in Western Australia’, Western Australian Quarterly Bulletin of Economic Trends, 3 (3): 56-72.
Preston, A.C. (1998), ‘Australian Wage Determination: Economic and Normative Forces’ PhD Thesis, The University of Western Australia, Perth, Australia. Rosenman, L. and Winocur, S. (1994), 'Women's work patterns and the impact
upon provisions on retirement', in Women and Superannuation: Selected Seminar Papers, EPAC Back ground paper No. 41, Economic Planning and Advisory Council and Office for the Status of Women, Canberra, 95-104. Thompson, M. (1999), Women and Retirement Incomes in Australia, Social Rights,
Industrial Rights and Property Right, Discussion Paper No. 98, Social Policy Research Centre, University of New South Wales.
APPENDIX A.
Table A1
Determinants of Relative Earnings of Men and Women Employed Full-Time.
Women Men
Coef t-stat. proportio
n in each group (%)
Coef t-stat. proportio n in each group (%) constant 5.770 313.999 5.741 303.190 Skilled certificate 0.141 9.217 0.21 0.166 13.700 0.38 Degree or higher 0.447 28.230 0.20 0.444 27.255 0.16 Experience 0.038 17.500 17.44 0.039 18.625 19.19 Experience2 /100 -0.084 -15.765 4.34 -0.074 -16.183 4.97 Overtime work 0.096 7.761 0.57 0.163 13.127 0.74 Married 0.058 3.561 0.55 0.131 7.425 0.68 Wid.sep.div 0.094 3.951 0.11 0.085 3.077 0.06 Kids0-4 0.024 0.934 0.06 -0.021 -1,262 0.18 Kids5-9 -0.044 -1.892 0.08 -0.101 -0.717 0.18 Kids10-15 -0.119 -6.134 0.13 -0.024 -1.541 0.18 Migrant -0.068 -4.766 0.24 -0.032 -2.478 0.26 Mean ln(Y) 6.264 6.445 Adjust R2 0.310 0.269 Observations 3202 5866
Source: estimates derived from the ABS 1996/97 IDS. The sample is restricted to persons employed full-time as a wage and salary earner. Full-time is defined as more than 35 hours per week. The dependent variable is the natural logarithm of weekly earnings in main job. The sample is also restricted to those employed in one job only. See above for details on the construction of the variables and definition of the variable labels used here.
i Tax expenditures on superannuation are projected to rise to $12bn in 2004-05, up from
$9bn in 2001-02. Over the same period the cost of the Age Pension is projected to rise from $16bn to $19bn (Budget Papers 2001).
ii If the individual is paid under an award it may state that the employer must contribute
to a superannuation fund, even if the individual earns less than $450 a calendar month.
iii We control for these characteristics and later relax some of the assumptions, such as
birthplace and geographic location, as a way of showing that life-time earnings and superannuation contributions also vary by such parameters.
iv Estimates based on the IDS96 data base show that the adjusted (i.e. controlling for
characteristics such as education, experience and other factors known to affect earnings ) average gender wage gap in Australia in the full-time labour market is around 10.5 per cent (Preston 2000). We acknowledge that this gap will be lower amongst junior workers (e.g. those aged 20). Miller and Rummery (1991), for example, estimate that the adjusted gender wage gap amongst 19-25 year olds is 4.9 per cent. There are, however, very few studies available where the adjusted gender wage gap has been estimated for different age groups. Accordingly, we apply the overall average to our estimates here. The limitation of this approach is that it may overstate the
earnings of young men. However, the focus of our study is primarily on comparisons amongst women rather than comparisons between men and women. With this in mind we believe that the approach adopted is reasonable.
v One weakness with the IDS data (a weakness shared by many other data sets) is the lack
of information on actual labour market experience. Following convention ‘potential’ labour market experience is defined here as age minus years of schooling minus 5 (assumed aged when schooling commenced). It is generally acknowledged that this potential measure is a poor proxy for female labour market experience, on account of their intermittent labour market activity. This explains why the sample is restricted to persons employed full-time. An underlying assumption of the model is that those who are employed full-time have essentially worked full-time over their entire working career. For many full-time workers this is a reasonable assumption. It means that the estimated experience coefficients provide a reasonable approximation of the rate of return to an additional year of labour market experience. There are a number of different ways to adjust the potential measure to perhaps more accurately reflect the actual labour market experience of older women. However, research shows that the varied approaches generate mixed results and impart additional biases into the results (Blinder, 1976; Preston, 2001, pp14-27). In the absence of information on actual labour market experience variables controlling for marital status and the presence and age of dependant children are used to capture penalties associated with intermittent labour market experience.
vi Although we have continuous data, for simplicity and ease of presentation we have
grouped the data into age groups with intervals of 5 years.
vii An acknowledged limitation with this approach is that, relative to women employed
full-time, the experience earnings profile may be flatter for women employed part-time. One could try and develop some correction parameter by estimating a wage equation for part-time workers and calculating their rate of return to experience. However, as before, such a
methodological has its inherent weaknesses in that it assumes that the worker has only ever held a part-time job. Given these methodological limitations we prefer to simplify the analysis by estimating part-time earnings as a proportion of full-time earnings. To the extent that there are differences in the experience earning profiles of women employed full-time and women
employed part-time, our results will most likely overstate the gross life-time earnings of part-time workers and their resultant levels of superannuation.
viii The Accord era (1980s), for example, is widely seen as having led to a reduction in the
real wage of many labour market participants.
ix This assumption is fairly reasonable. According to ABS data collected in 2000, only 18.7
per cent of women in employment have superannuation funds which consist of personal/spouse contributions and employer/business contributions. (Amongst men the corresponding share is 25.2 per cent) (ABS 6361.0, Table 15).
x This equates to the standard investment real rate of interest recommended by the
Australian Securities and Investment Commission (ASIC) for use when calculating investment returns on a balanced style investment portfolio.
xi The wage relativities were taken from Preston (1998). Using 1991 Census data Preston
shows that professional men earn 17.2 per cent more than the average for all male occupations. The corresponding relativity for female professionals and cleaners is 15.5 and -23.0 per cent, respectively.
xii Anecdotal evidence suggests that in some industries (e.g. child-care) this rule is explicitly
used as a device to minimise the wage bill.
xiii Their estimate was reported in a recent press release “ASFA warns of aged ‘underclass’ Australian Financial Review, 22 February 2001.
xiv
Clearly the choice of n will vary across individuals depending on their knowledge of their health and attitudes to risk. Some individuals may prefer to retain some capital rather than completely exhaust their principal so soon after retirement. In this study n is estimated as the difference between life-expectancy and age of retirement (65). In the case of women n is equal to 17. This would appear to be an appropriate factor. Research prepared by ASFA (1999) suggests that a factor of 19.26 years is currently used by many financial institutions for the life-expectancy of women.
xv In the most recent budget (Budget 2001) the government announced that the tax-free
threshold for retirees would be raised to $20,000. This will ease the burden on many retirees with some private income (e.g. from superannuation).