MULTI-SCALE SIMULATION OF SPHERICAL AGGREGATES
A
RNAUDD
ELARUE ANDD
OMINIQUEJ
EULINCentre de Morphologie Math´ematique, Ecole des Mines de Paris, 35 rue Saint Honor´e 77 300 Fontainebleau, France
e-mail: [email protected]
(Accepted October 8, 2001)
ABSTRACT
This paper presents a method to simulate high density non overlapping sphere structures with anisotropy and heterogeneity.
Keywords: 3D mathematical morphology, non-overlapping spheres, structure simulation.
INTRODUCTION
Morphological models of random sets (Matheron, 1975; Serra, 1982) provide a means to represent in a synthetic way the morphological properties of microstructures, and to generate 3D simulations using the identification of models based on the available information, namely part of the Choquet capacity.
The aim of this work is to propose multi-scale simulations of anisotropic structures containing
aggregates of non-overlapping spheres. Such
microstructures are very common in materials, and in the present case were studied in a joint research project (Delarue, 2000). Composite materials were elaborated from an aluminium or a PMMA matrix incorporating Zircon or Zircon-Silica spherical inclusions. Materials were prepared in the GEMPPM (INSA de Lyon) and in the LTPCM (Grenoble). 3D images of this materials are obtained by X-ray microtomography in the Synchrotron of the ESRF (Grenoble) with a 2µm resolution per voxel.
In the Centre de Morphologie Math´ematique, we characterized these structures by 3D measurements
such as the covariance in various directions,
a tortuosity index obtained from 3D geodesic propagation, local volume fraction of inclusions, distance functions and angular distributions (to study
the anisotropy of the neighborhood of inclusions) (Delarue, 2000).
The first part of this paper is a presentation of a standard method to generate random homogeneous and isotropic non-overlapping sphere structure, and problems related to high densities. The second part presents measurements, able to characterize spatial distribution from multi scale histograms. The next part presents the results of the measurements on 3D microtomography images of real materials. The last part describes an algorithm of multi-scale simulations, to obtain heterogeous and anisotropic hard spheres structures with a high density.
3D HIGH DENSITY HARD SPHERE SIMULATION
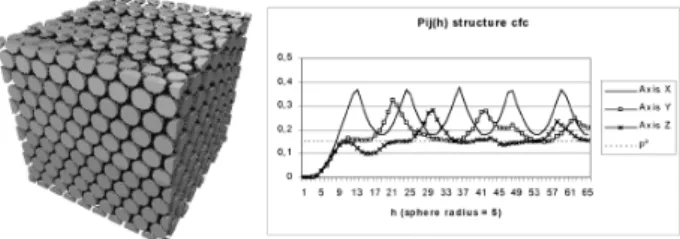
The implantation of non-overlapping spheres with random coordinates is practically impossible if the density is larger than 30 or 35%. To generate simulations with a higher density of hard spheres, it is better to start from an ordered dense structure, like cfc (cubic face centered). But this kind of structure is completely ordered. Disorder can be introduced by deleting some spheres at random and by random translation of the remaining spheres.
Fig. 1. Image and 2 points correlation function Pi j h P x A
i; x h A
ALGORITHM OF SIMULATION
In this part, we consider simulation of hard spheres with a fixed radius R 1. The first step of a random
hard sphere structure simulation with a high density is to implant ordered hard sphere with cfc order and with the higher hard core radius RHc. The maximum
theoretical hard core radius, for a p density structure, is given by:
RHc
3 π
3 2p
The highest density, when RHc 1, is 74
04%. This result corresponds to Kepler’s conjuncture, which was recently proved by Th. Hales (Aste, 2000).
After implantation, spheres are moved by random translations. At each step, a sphere and a direction is chosen. The translation is fifty times smaller than the sphere radius. This is accepted if the translation of the sphere is made without any sphere overlap. If it is accepted, the same translations are repeated 10 times. This method is very fast but it is important to know how many translations are needed, and to define a criterion of convergence of the process.
CONVERGENCE
Measurement of the probability for two points
to be in two separated spheres P x A
i; x h
Aj; i j is used to characterize the spherical
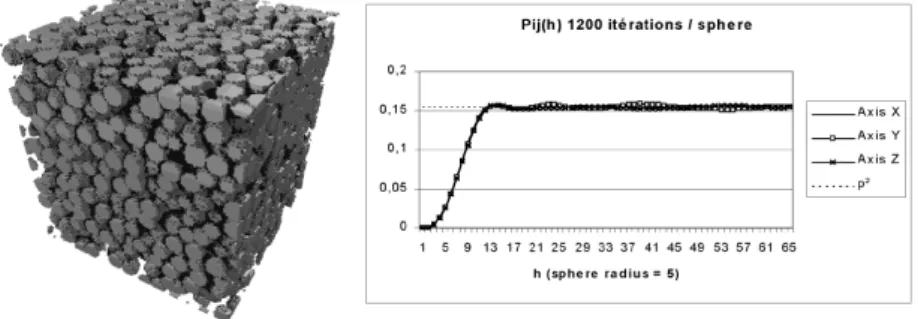
packing. For a cfc structure like that in Fig. 1, this measurement produces curves with many oscillations. After translations of spheres, the order disappears in the structure and oscillations decrease (Fig. 2). The convergence criterion Cc is defined by the following
formula:
Cc
10r
h 2r
10r h
P x A
i; x h A
j; i j
p
2
2dh
For a low density (20 or 30 %), few translations are needed for convergence. For a higher density (40 or 50 %) the number of translations increases quickly (Fig. 3). The highest volume concentration of random spheres simulated by this technique is close to 55%.
Density of hard spheres
Number of translations by sphere
20% 120
30% 250
40% 700
50% 2700
Fig. 2. Image and 2 points correlation function of 3D random hard sphere structure (40%).
CHARACTERIZATION OF THE SPATIAL DISTRIBUTION FROM MULTI SCALE HISTOGRAMS
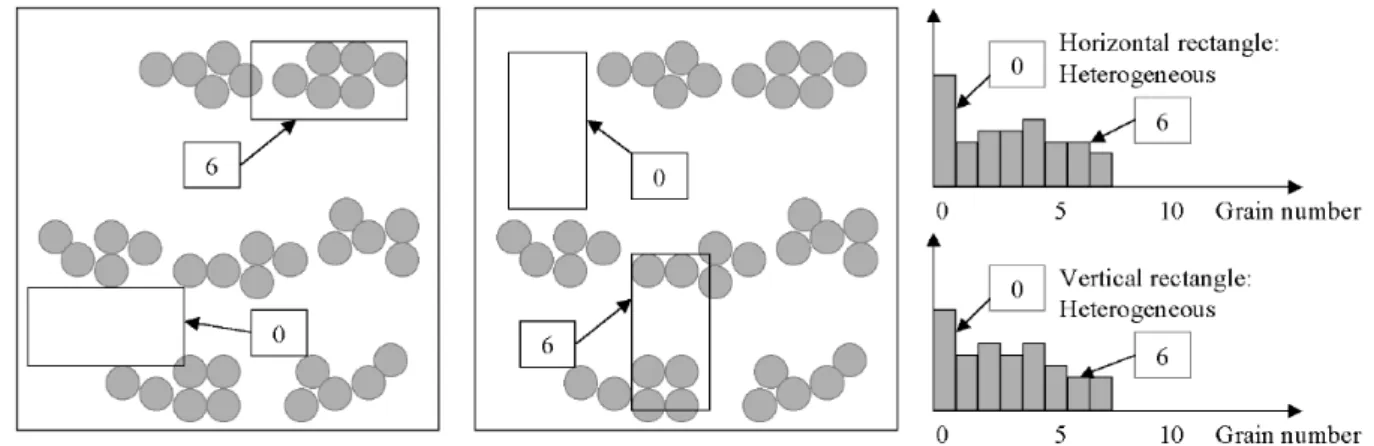
In this part, we present a 3D characterization of granular arrangements based on the estimation of the histogram of the number of spheres included in a characteristic volume. To account for the anisotropy of the structure, this volume is a parallelepiped with different orientations. Different sizes of parallelepiped are used to obtain information at various scales.
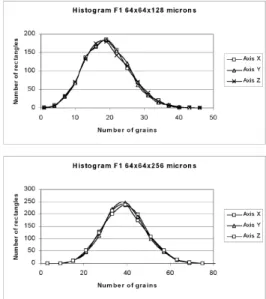
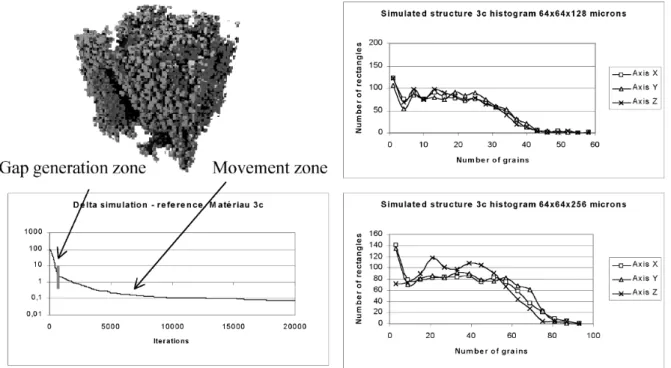
In Fig. 4, histograms of local grain numbers are the same in both directions x and y. But, if a longer parallelepiped is taken (Fig. 5), histograms become anisotropic. In this last histogram it is possible to find the main direction of aggregates (in this case, the horizontal direction). With parallelepipeds showing different orientations, it is possible to study the size and orientation of aggregates.
This measurement is quite fast because, for example, for an image of 1
2 1
2 1
2 mm3,
with a resolution of 2 µm and measurements with
parallelepipeds with dimensions 64 64 128µm
3
and 64 64 256 µm
3 every 32 µm returns a
measurement more than 103 faster than covariance.
The main advantages of this type of measurements are the characterization of heterogeneity and anisotropy, and the very low cost of calculation.
MEASUREMENT ON REAL
MATERIALS
Figs. 6 and 7 show measurements obtained on two different structures (Delarue, 2000). The first structure (Fig. 6) is homogeneous and isotropic without aggregates, with 40% volume fraction of spheres.
Fig. 4. Histogram of local grain number. At this scale, the structure is isotropic.
Fig. 6. Measurement on an homogeneous and isotropic structure.
Fig. 7. Measurement on anisotropic aggregates.
The second structure (Fig. 7) is a 35% aggregate structure which was compressed along the z axis. The heterogeneity is apparent for the two types of histograms. The first one is isotropic and corresponds to the smaller dimension of aggregates. The histogram with the larger parallelepiped is sensitive to the larger dimension of the aggregate. As the covariance, this measurement can detect that aggregates are flat (like disks orthogonal to the Z axis).
Real structures need two types of information to be completely characterized. The characterization of the spatial localization of inclusions obtained with the measurements presented here, and the granulometry because of the non unique hard sphere radius of inclusions. The granulometry can be obtained by labelisation of inclusions (a small erosion is sometimes required to separate grains) and volume measurement of each of them. We assume that inclusions are
spherical. Fig. 8 presents the granulometry of a homogenous and of a heterogenous structure.
Fig. 8. Granulometry of real materials (distribution of
volumes of inclusions).
STRUCTURE SIMULATION
simulate three dimensional structures following the same distributions. In a first step, a hard sphere structure with a random distribution (for a high density in most studied materials) is simulated. Then random translations of the spheres are generated, controlling the difference between the histograms of local sphere numbers of the reference and of simulated structures. The size of the translation decreases when the simulation proceeds, like cooling in a thermodynamical system. If N is the total number of translations, for the i-th translation, the maximal sphere range d i is given by the formula,
d i d
0e
kNi
Sphere motion is accepted if this difference decreases. The procedure is iterated until a given
number of steps (typically N 25000 for about
1000 spheres) or a level of error is reached. As the histogram is estimated for each sphere movement, the importance of a very fast measurement process is clear. Such constrained simulations follow a simulated annealing process (Yeong, 1998; Manwart, 2000). Similar approaches were followed in 2D: simulations reproduce the histograms distributions of the number of pixels of the microstructure in different windows (Srivastava, 1994), or the covariance of non overlapping discs (Rintoul, 1997).
GAP GENERATION
Structures with a high heterogeneity and a high density are very difficult to simulate by this method. Random translations (under histogram control) of individual spheres can hardly generate aggregates with a high local density and large empty spaces between grains. A solution to this problem was developed by the controlled generation of gaps (Fig. 9).
To simulate a heterogeneous structure with the density reference Dre f, a homogeneous hard sphere structure is generated with the density DSimul(DSimul
Dre f). After that, spheres are deleted and the difference between the histograms of local sphere number of reference and simulated structure is controlled. If the difference decreases, the deletion is accepted. When the density of the simulated structure DSimul reaches Dre f, random translations under the control of histogram differences start, as previously.
RESULTS
After simulation, structures are validated with respect to reference structures by a direct comparison of the histograms (to locate and explain their differences) and by estimating the probability for two points to be in two different inclusions, which is typical of the anisotropy of the distribution of inclusions (Delarue, 2000).
CONCLUSION
In this paper we present the different steps to obtain hard sphere simulations using histograms of sphere center numbers included in a characteristic volume. For a homogeneous low density structure, only two steps are needed to obtain simulations: random implantation and random translation under a reference structure histogram condition. For higher densities, random implantation must be replaced by a dense periodic implantation and random translations. We show that the number of translations needed to converge to disorder increases with the density. In the case of very heterogeneous structures, four steps are needed: ordered implantation of spheres with a higher density than the reference one, random translation, random suppression and translation under control of the reference structure histograms.
ACKNOWLEDGEMENTS
This study was supported by CNRS (project 104. Programme mat´eriaux). A. Delarue is indebted to CNRS and to DGA for a grant.
REFERENCES
Aste T, Weaire D (2000). The pursuit of perfect packing. Bristol: Institute of Physics Publishing.
Delarue A, Jeulin D (2000). Morphologie 3D de Composite Granulaires, N-29/00/MM. Caract´erisation Morphologique 3D de Mat´eriaux H´et´erog`enes par Microtomographie X et Traitement d’image pour la pr´evision de Comportement M´ecanique. Programme Mat´eriaux du CNRS, Th`eme 12a, Projet N 104. Matheron G (1975). Random sets and integral geometry.
New York: J. Wiley.
Manwart C, Torquato S, Hilfer R (2000). Stochastic reconstruction of sandstones. Phys Rev E 62:893-9. Rintoul MD, Torquato S (1977). Reconstruction of the
structure of dispersions. J Colloid Interf Sci 186:467-76.
Serra J (1982). Image analysis and mathematical morphology. London: Academic Press.
Srivastava RM (1994). An annealing procedure for honouring change of support statistics in conditional simulations. In: Dimitrakopoulos R, ed. Geostatistics for the next century. Dordrecht: Kluwer Academic Publishers, 277-90.