Abstract—Mefenamic acid is one of the active pharmaceutical ingredientsthat exhibit polymorphism. An experimental study has found that Form I of mefenamic acid is produced fromcooling crystallization with ethanol as a solvent. Hydrogen bonding is considered as the fundamental factor that controls the polymorphism of mefenamic acid in ethanol. This work, in essence, was performed to verify this using molecular dynamics simulation.The simulation was performed using COMPASS force field available in Material Studio package.The resultof the simulation showed strong hydrogen bonding between oxygen and hydrogen in the carboxylic group.The results of the Fourier transform infrared spectroscopy analysis confirmed the existence of O-H, C-O and C=O bonds. These findings proved the presence of hydrogen bondsthat leads to the formation of hydrogen motif in Form I of mefenamic acid during crystallization process using ethanol as a solvent.
Index Terms—Radial distribution function, COMPASS, Ewald, polymorphs
I. INTRODUCTION
Mefenamic acid is a widely used non-steroidal anti-inflammatory and analgesic agent for the treatment of pain caused by menstrual disorders [1] and [2]. It was reported to exist in two polymorphic forms: Form I and Form II [3], [4]. Theliterature crystallographic data of mefenamic acid Form I and Form II are shown in Table I [5], [6]. Several researches have reported the effect of solventsonthe polymorphism of mefenamic acid [7], [8]. Crystallization of mefenamic acid using ethanol as solvent to produce Form I was reported by Panchagnula and co-researchers [7]. However, the molecular insight into the hydrogen bonding interactions leading to the formation of Form I of mefenamic acid is yet to be investigated. The interactions can be investigated using molecular dynamics simulation method and confirmed with the Fourier transform infrared (FTIR) spectroscopy analysis. Molecular dynamics simulation method is a computational experiment conducted on a
Manuscript received March 10, 2013; revised May 17, 2013. This work was supported by the International Islamic University Malaysia (Research Endownment Fund B12-363-0841).
Siti Kholijah Abdul Mudalip and Parveen Jamal are with the Kulliyyah of Engineering, International Islamic University Malaysia, 50728 Kuala Lumpur, Malaysia (e-mail: ctkhol@ yahoo.com, jparveen@ iium.edu.my). Mohd. Rushdi Abu Bakar is with the Kulliyyah of Pharmacy, International Islamic University Malaysia, 25200 Kuantan, Pahang, Malaysia (e-mail: [email protected]).
Fatmawati Adam is with the Chemical Engineering Department, Faculty of Chemical Engineering & Natural Resources, Universiti Malaysia Pahang,
targeted molecular model with the aim to simulate the behavior of molecules [9]-[11]. From pharmaceutical point of view, molecular dynamics simulation plays an important role to increase an understanding of crystallization process and mechanism leads to production of different polymorphs [12].Fourier transform infrared (FTIR) spectroscopy, on the other hand, is a recognized method used to obtain an infrared spectrum of absorption, emission, photoconductivity or Raman scattering of a solid, liquid or gas [13]. Based on the extensive literature review, a new approach is adopted in this study, which is based on molecular dynamics simulation and FTIR spectroscopy analyses for a mixture of mefenamic acid and ethanol. The aim of this work is to investigate the solute-solute, solute-solvent and solvent-solvent interactionsor hydrogen bonding network, which controls the self-assembly of mefenamic acid molecules in ethanol and consequently leads to the crystallization of mefenamic acid Form I.
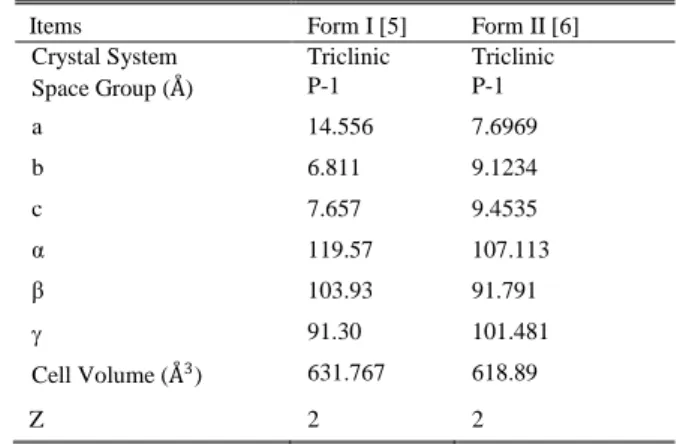
TABLEI:CRYSTALLOGRAPHIC DATA
Items Form I [5] Form II [6]
Crystal System Triclinic Triclinic
Space Group (Å) P-1 P-1
a 14.556 7.6969
b 6.811 9.1234
c 7.657 9.4535
α 119.57 107.113
β 103.93 91.791
91.30 101.481
Cell Volume (Å3) 631.767 618.89
Z 2 2
II. METHODOLOGY
A. Chemicals
Mefenamic acid powder with purity of 98% was purchased from Baoji Tianxin Pharmaceutical Co. Ltd., China. The ethanol used was ananalytical grade with 99.9% purity and supplied from Fisher Scientific.
B. Molecular Dynamics Simulation
The simulation work was performed in Material Studio 5.5 using HP Z400 workstation. The geometry optimization and energy minimization of mefenamic acid and ethanol molecules were performed using Smart minimizer. The cubical simulation box with periodic boundary for initial condition of pure ethanol and mixture of ethanol and mefenamic acid were constructed. The self-associations of
Structures and Hydrogen Bonding Recognition of
Mefenamic Acid Form I Crystals in Mefenamic Acid/
Ethanol Solution
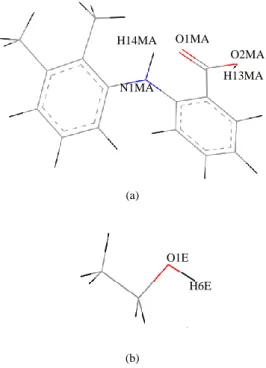
the molecules were studied by using an initial random configuration of molecules in the simulation box of ethanol molecules. All the simulations were performed at ambient temperature and pressure. The intermolecular interactions for the molecules were described by the COMPASS force field [14], which is an optimized force field for condensed phase applications. A 250 ps run in NVE ensemble was applied first for equilibration. Then, the system was simulated in the NPT ensemble using Nose [15] and Berendsen[16] for thermostat and barostat, respectively for 500 ps. The time step used is 1.0 fs. The equation of motions was integrated using Verlet algorithm with Ewald summation method to describe non-bonded energies in periodic system [17]. The trajectory files from the simulation were analyzed for radial distribution function (RDF). The partial labeling of molecules used in this simulation work for the purpose of molecular recognition is shown in Fig. 1.
(a)
(b)
Fig. 1. Partialnumbering and labeling of (a) Mefenamic acid; and (b) Ethanol. Color representation: Black: Hydrogen; Grey: Carbon; Blue: Nitrogen and
Red: Oxygen.
Details of the simulation performed are summarized in Table II. The value of density for mefenamic acid/ ethanol mixture tabulated in Table I is calculated using Equation (1) [18].
𝜌𝑠𝑜𝑙 = 𝐿 + 𝑆 / 𝐿 𝜌𝐿+ 𝑆 𝜌 𝑆 (1)
where 𝜌𝑠𝑜𝑙, is the density of solution, 𝐿 is the mass of solvent,
𝑆 is the mass of solute, 𝜌𝐿is the density of solvent and 𝜌𝑠 is the density of solute.
TABLEII:SIMULATION DETAILS
System Number of
Molecules
Calculated Density (g/cm3)
Ethanol 250 0.785 [18]
Mefenamic acid:
Ethanol 100: 250 1.0601
C. Preparation of Saturated Solution of Mefenamic Acid in Ethanol
Excess amount of mefenamic acid was added into 2 mL of ethanol at 25°C. The solution was continuously shaken at 300 rpm and maintained at 25°C for 24 hours. The solution was filtered using 0.45µm PTFE syringe filter and stored in a glass vial for analysis.
D. Crystallization from Ethanol
A saturated solution at 60°Cwas prepared by heating 1.14 g ofMA in 50 mL of ethanol in a 100 mL conical flask on a hot plate until dissolution, followed by natural cooling to25°C. The crystals produced were filtered and dried in an oven at 60°C. The crystals were periodically dried and weighed until constant weight was achieved. The dried crystals were stored in a screw cap glass vials for analysis [7].
E. FTIR Spectroscopy Analysis
The FTIR spectra of the samples in a range of 500 to 4000 cm-1 were recorded using Perkin Elmer ATR-FTIR Spectrometer (Frontier) with an average of 16 scans.
III. RESULTS AND DISCUSSION
A. Molecular Dynamics Simulation
The RDFplot of pure ethanol in comparison with literature[19] is shown in Fig. 2. The RDF plot is concurring with the literature and thus proves the validity of method used during the simulation process. In addition, the simulated density of pure ethanol, which is 0.781 g /cm3, shows a good agreement with the calculated value as its deviation is only 0.51%. As shown in Fig. 2 (a) and (b), the first peak observed for O1E•••H6E and O1E•••O1Eare at 1.75Å and 2.75Å, respectively. These peaks represent solvent-solvent intermolecular interaction and the strength of the interaction of the specified atom with its nearest neighbor. Based on these values, it can be affirmed that O1E•••H6E, which shows the nearest neighbor interaction, is stronger than O1E•••O1E.This reflects the strength of hydrogen bonding present in the structure of pure ethanol.
0.0 1.0 2.0 3.0 4.0 5.0 6.0
0 2 4 6 8 10
g
(r
)
r(Å)
This work
Literature [19] 1.75 Å
O1E
H6E
H13MA O2MA O1MA
N1MA H14MA
(b)
Fig. 2. g(r) plotsof pure ethanol (a) Molecular interaction between O1E•••H6Eand (b) O1E•••O1Ein comparison with literature [19].
The g(r) plot of solvent-solvent present inmefenamic acid/ ethanol solution, which is O1E•••H6E,is shown in Fig. 3 (a). The probability of this interactionis higher than pure ethanol (Refer Fig. 2 (a)). This is probably due to the differences in molecular self-assembly of solute-solute and solvent-solvent structures that are present in the solution, but are not present in the pure ethanol.
The probabilities of intermolecular interactions of solvent-solute and solute-solvent in mefenamicacid/ ethanol solution are shown as g(r) plot in Fig. 3(b). As shown in the figure, the g(r) plots are structured except for N1MA•••H6E and O1E•••H14MA. O1E•••H13MA shows a sharp peak with the highest probability at 1.75Å. This results suggest that the association of mefenamic acid molecules in ethanol solution that leads to high solubility value is primarily through the hydrogen bonds formed byO1E•••H13MA interactions.
Reference [20] stated that prior to solute cluster formation, the phase separation of solvent-solvent and solute-solute interaction is presence in the mixtures. The formation of solute cluster, which leads to nucleation of a targeted polymorph, depends on the hydrogen bonding established between solute-solute molecules. As shown in Fig. 3 (c), the hydrogen bonding between mefenamic acid molecules in the mixture are formed through intermolecular interaction between O1MA•••H13MA as asharpg(r) peak was observed at 1.75Å. According to [21], the g (r) peaks with a sharp and nearest radial distance will contribute to significant intermolecular interactions during pre-nucleation event. Therefore, it can be suggested that, the intermolecular interaction between O1MA•••H13MA play an important roles during pre-nucleation of Form I of mefenamic acid that crystallized in ethanol.
B. FTIR Spectroscopy Analysis
The FTIR spectrum of pure ethanol, saturated solution of mefenamic acid/ ethanol and solid crystals of mefenamic acid are shown in Fig. 4, Fig. 5 and Fig. 6, respectively. The spectrum illustrated in Fig. 4 shows the presence of hydrogen bonds in the chemical structure of pure ethanol that explains the polar protic characteristics of pure ethanol. The FTIR spectrum of mefenamic acid/ ethanol solution in Fig. 5 shows
the presence of C-O, C-H, C=O, and O-H bonds. The presence of C=O and the shifting of the O-H bonds to 3376 cm-1 in the spectrum, indicatesthe availability of mefenamic acid in the solution. In addition, the peaks are relatively more intense than those in the pure ethanol. This indicates the bonds exist with higher strength in saturated solution of mefenamic acid/ ethanol as compared to pure ethanol.
(a)
(b)
(c)
Fig. 3. The comparison of g(r) plot of mefenamic acid/ ethanol solution (a) 0.0
1.0 2.0 3.0 4.0 5.0 6.0
0 2 4 6 8 10
g
(r
)
r(Å)
This work Literature [19] 2.75Å
0 1 2 3 4 5 6 7 8
0 2 4 6 8 10
g
(r
)
r(Å)
O1E…H6E 1.75 Å
0 1 2 3 4 5 6 7 8 9 10
0 2 4 6 8 10
g
(r
)
r(Å)
O1E…H13MA
O1E…H14MA
N1MA…H6E
O1MA…H6E
O2MA…H6E 1.75 Å
3.25 Å
0.0 0.5 1.0 1.5 2.0 2.5 3.0 3.5 4.0
0 2 4 6 8 10
g
(r
)
r(Å)
O1MA..H13MA
O1MA…H14MA
O2MA…H13MA
O2MA…H14MA
N1MA…H13MA
Fig. 4.FTIR spectrum of pure ethanol.
Fig. 5. FTIR spectrum of saturated mefenamic acid/ ethanol solution at 25oC.
Fig. 6. FTIR spectrum of mefenamic acid solid crystals obtained from ethanol solution.
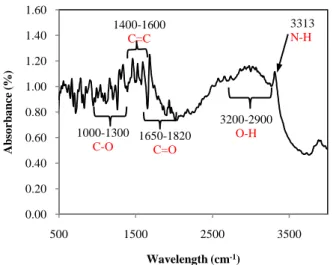
The FTIR spectrum in Fig. 6 shows the presence of C-O, C=C, C=O, O-H and N-H in mefenamic acid that crystallized in ethanol. This spectrum is consistent with IR adsorption spectra of Form I which was reported by previous studies [3], [22]. Although the crystal of mefenamic acid produced in this work shows the presence of N-H bond, the bond is not detected in the IR spectrum of mefenamic acid/ ethanol mixture (Refer Fig. 5). This is probably due to the weak strength of the N-H band in the solution. These results are compliment to the molecular dynamics simulation result shown in Fig. 2 and Fig. 3.
IV. CONCLUSION
The molecular recognition of the polymorphism of mefenamic acid Form I crystals in ethanol has been successfully revealed through molecular dynamics simulation. The hydrogen bonding between O1MA•••H13MA is identified to be responsible for formation of hydrogen motif in mefenamic acid Form I. The results from FTIR analysis confirmed the existence of hydrogen bonds in mefenamic acid/ ethanol solution that leads to the nucleation of mefenamic acid Form I crystals.
ACKNOWLEDGMENT
Financial support provided by the International Islamic University Malaysia (Research Endownment Fund B12-363-0841) is gratefully acknowledged. SitiKholijah Abdul Mudalip is grateful to the Malaysian Ministry of Higher Education and the Universiti Malaysia Pahang for a scholarship.
NOMENCLATURES
a, b, c : cell parameter (Á)
Z : number of atoms
: cell angle between a and b (o)
α : cell angle between b and c (o)
β : cell angle between a and c (o)
REFERENCES
[1] M. Otsuka, H. Hasegawa, and Y. Matsuda, “Effect of polymorphic transformation during the extrusion-granulation process on the pharmaceutical properties of carbamazepine granules,” Chem. Pharm. Bull., vol. 45, pp. 894-898, 2007.
[2] M. Otsuka, F. Kato, and Y. Matsuda, “Effect of temperature and kneading solution on polymorphic transformation of mefenamic acid during granulation,” Solid State Ionic, vol. 172, pp. 451-453, 2004. [3] S. Romero, B. Escalera, and P. Bustamante, “Solubility behavior of
polymorphs I and II of mefenamic acid in solvent mixtures,”Int. J. Pharm., vol. 178, pp. 193-202, 1999.
[4] A. Adam, L. Schrimpl, and P. C. Schmidt, “Factors influencing capping and cracking of mefenamic acid tablets,” Drug Dev. Ind. Pharm.,vol. 26, pp. 477-487, 2000.
[5] J. F. McConnell and F. Z. Company, “N-(2,3-xylyl) anthranilic acid, C15H15NO2 mefenamic acid,” Cryst. Struct. Commun. vol. 5, pp. 861-864, 1976.
[6] E. H. Lee, S. R. Byrn, and T. M. Carvajal, “Additive-induced metastable single crystal of mefenamic. acid,” Pharm. Res., vol. 23, pp. 2375– 2380, 2006.
[7] R. Panchagnula, R. Sundaramurthy, O. Pillai, and S. Agrawal, “Solid-state characterization of mefenamic acid,” J. Pharm. Sci., vol.
93, pp. 1019-1029, 2004.
[8] S. Cesur, and S. Gokbel, “Crystallization of mefenamic acid and polymorphs,” Cryst. Res. Technol. vol. 43, pp. 720-728, 2008. 0
5 10 15 20 25 30 35 40
500 1000 1500 2000 2500 3000 3500 4000
A
b
so
rb
a
n
ce
(
%
)
Wavelength (cm-1)
3366 O-H 2980
C-H 1048
1092
1384 C-O
0 5 10 15 20 25 30 35 40
500 1000 1500 2000 2500 3000 3500 4000
A
b
so
rb
a
n
ce
(
%
)
Wavelength (cm-1) C-O
1092
1388 1048
1770 C=O
0.00 0.20 0.40 0.60 0.80 1.00 1.20 1.40 1.60
500 1500 2500 3500
A
b
so
rb
a
n
ce
(
%
)
Wavelength (cm-1) 1650-1820
C=O
3200-2900 O-H
3313 N-H
1000-1300 C-O
1400-1600 C=C
3376 O-H 2980
[9] K. I. Ramachandran, G. Deepa, and K. Namboori, Computational Chemistry and Molecular Modelling: Principles and Applications, Berlin, Heidelberg: Springer, 2008.
[10] I. G. Economoua and N. M. Garridoa, and Z. A. Makrodimitria, “Prediction of microscopic structure and physical properties of complex fluid mixtures based on molecular simulation,” Fluid Phase Equilibria, vol. 296, pp. 125–132, 2010.
[11] S. Karanikas and I. G. Economou, “Molecular simulation of structure, thermodynamic and transport properties of polyacrylonitrile, polystyrene and their alternating copolymers in high temperatures,”
European Polymer Journal, vol. 47, pp. 735–745, 2011.
[12] S. Hamad, C. Changman Moon, R. A. Catlow, A. T. Hulme, and S. L. Price, “Kinetic insights into the role of the solvent in the polymorphism of 5-fluorouracil from molecular dynamics simulations,” J. Phys. Chem. B, vol. 110, pp. 3323-3329, 2006.
[13] P. R. Griffiths and J. A. de Haseth, Fourier Transform Infrared Spectrometry, 2nd ed. J. D. Winefordner (ed.) John Wiley &Sons:
USA, 2007.
[14] H. Sun, “COMPASS: An ab initio force-field optimized for condensed-phase applications overview with details on alkane and benzene compounds,” J. Phys. Chem. B, vol. 102, pp. 7338-7364, 1998.
[15] S. Nose, “A unified formulation of the constant temperature molecular dynamics methods,” J. Chem. Phys., vol. 81, pp. 511, 1984.
[16] H. J. C. Berendsen, J. P. M. Postma, W. F. van Gunsteren, A. DiNola, and J. R. Haak, “Molecular-dynamics with coupling to an external bath,” Journal of Chemical Physics, vol. 81, pp. 3684–3690, 1984. [17] M. P. Allen and D. J. Tildeslry, Computer Simulations of Liquids.
Clarendon Press: Oxford, U.K., 1987.
[18] J. W. Mullin, Crystallization, 4 ed., Butterworth-Heinemann: Oxford, 2001.
[19] L. Saiz and J. A. Padro, “Structure and dynamics of liquid ethanol,” J. Phys. Chem B., vol. 101, pp. 78-86, 1997.
[20] H. Na, S. Arnold, and A. S. Myerson, “Cluster formation in highly supersaturated solution droplets,” J. Cryts.Growth, vol. 139, pp. 104-112, 1994.
[21] F. Adam, “An Examination into the Influence and Change of Solution Structure on the Polymorphic Behaviour of 2,6-Dihydroxybenzoic Acid,” Ph.D. dissertation, Institute of Particle Science and Engineering, University of Leeds, Leeds, 2012.
[22] R. K. Gilpin and W. Zhou, “Infrared studies of the thermal conversion of mefenamic acid between polymorphic states,” Vibrational Spectroscopy, vol. 37, pp. 53-59, 2005.
Siti Kholijah Abdul Mudalip is a Ph.D student at Biotechnology Department, Kulliyah of Engineering, International Islamic University Malaysia, Kuala Lumpur, Malaysia. She is currently attached at Kulliyyah of Pharmacy, Intrenational Islamic University Malaysia, Kuantan, Malaysia. She obtained her Bachelor and Master Degree in Chemical Engineering
from Universiti Teknologi Malaysia, Skudai, Johor, Malaysia in year 2005 and 2007, respectively. Previously, she was a LECTURER in Faculty of Chemical Engineering & Natural Resources, Universiti Malaysia Pahang, Gambang, Malaysia. She is a member of the Institution of Chemical Engineers (IChemE) since 2009.
Mohd. Rushdi Abu Bakar is an assistant professor at the Department of Pharmaceutical Technology, Kulliyyah of Pharmacy, Intrenational Islamic University Malaysia, Kuantan, Malaysia. He obtained his Ph.D in Chemical Engineering from the University of Loughborough, United Kingdom in 2010. His M.Sc. in Pharmaceutical Technology was awarded by King’s College London, University of London, United Kingdom in 2004. He is a member of the British Association for Crystal Growth (BACG) and the International Society for Pharmaceutical Engineering (ISPE). He’s also an associate member of the Institution of Chemical Engineers (IChemE). His research interests are pharmaceutical crystallization, process analytical technology assisted investigation of crystallization process and solid-state characterization techniques.
Fatmawati Adam is a senior lecturer at Department of Chemical Engineering, Faculty of Chemical Engineering & Natural Resources, Universiti Malaysia Pahang, Gambang, Malaysia. She obtained her PhD from Institute of Particle Science, University of Leeds, United Kingdom in 2012. Her research interest is in the area of pharmaceutical crystallization process and molecular modeling.
![Fig. 3. The comparison of g(r) plot of mefenamic acid/ ethanol solution (a) 0.01.02.03.04.05.06.00246810g(r)r(Å)This workLiterature [19]2.75Å0123456780246810g(r)r(Å)O1E…H6E1.75 Å0123456789100246810g(r)r(Å)O1E…H13MAO1E…H14MAN1MA…H6EO1MA…H6EO2MA…H6E1.75 Å3.2](https://thumb-us.123doks.com/thumbv2/123dok_us/8072626.2138505/3.892.465.820.199.1148/fig-comparison-mefenamic-ethanol-solution-workliterature-man-å.webp)