A QoS Aware Multi-Cloud Service Composition
Algorithm
Zahra Nazari*
School of Engineering Science, College of Engineering University of Tehran
Tehran, Iran [email protected]
Ali Kamandi, Mahmood Shabankhah
School of Engineering Science, College of EngineeringUniversity of Tehran Tehran, Iran
{kamandi, shabankhah}@ut.ac.ir
Received:2019/04/09 Revised:2019/10/22 Accepted:2019/12/25
Abstract— Devices that are connected on the internet and
are exchanging data with internet brokers to receive requested services are a significant part of internet users. In order to manage and account well to IoT requests maximum processing power, speed in data transfer, and proper combining services in minimum time is needed. Since there is a large number of IoT devices which have a large scale, we have to use the abilities and services of cloud environment in order to solve its problems. So, service composition in a cloud environment is paid attention recently. We want to suggest an algorithm with the approach in this research, of improving factors propounded in the service composition problem like the number of clouds involved in service, number of services examined before responding to users’ requests SP and load balance between clouds. In this paper, the factor, similarity measure, is introduced and used to find the best cloud and composition plan in each phase which in addition to improving QoS metrics propounded in previous papers, it caused improving QoS metric of load balancing between clouds, prevention of formation of a bottleneck in clouds entrance. These changes, besides the proper load balancing, have avoided the clouds stop working suddenly and satisfied the users by presenting the services faster.
Keywords— Service Composition, Multi-Cloud Environment, Internet Of Things, Load Balancing, Quality Of Service
1. INTRODUCTION
The Internet has influenced communication between humans in the recent century and with attention to the easy access and variety of services provided, is influencing communication between human and things and in some cases, things communicating with each other. Internet of things (IoT) is a new subject that millions of smart things are connected through it. IoT is spreading in our personal and social life. Intelligent transportation network, Intelligent phones and wearing gadgets, intelligent health networks and homes, smart city and smart grid, are some examples of IoT applications in our personal and social life. By growing the number of these devices every day even from the population of the Earth, the new main problem is how to manage these things, keeping and processing collected data by them and responding to their requests on time [1]. Scientists and researchers of corporations are being persuaded by spreading these technologies in order to enhance performance and fix the challenges in IoT.
In this century, data volume available in the human hand is too much. This data made their owners uncompetitive in a class of most valuable companies in the world. IoT is made dependent to cloud environment because of the delirious growth of data volume in modern ages and IoT should use all of the advantages of the cloud, including unlimited virtual resources and powers along with prevalence against its limits and challenge. From particular and distinct attributes of cloud computing can express elasticity, scalability, and fast configuration of services. Intelligent devices are somehow smart computers. The development of these devices created the expectation in users to access various and instantaneous services so that it is required that a cloud environment can provide these kinds of compound requests real-time.
It put an interesting comparison for contrast and the possibility of cloud cooperation and internet objects in [2]. With a cursory look at table mentioned in this article, we can quickly answer the question: Why merging these two concepts occurred so fast, and why is that increasing every single day ?
1-IoT, including the objects that spread all over the world and moving permanently; cloud resources also reachable all over the earth. 2-Objects of IoT space exist physically, whereas cloud objects define virtual . 3-Reachable computational sources for internet objects are limited and specified whereas computational sources of cloud environment are unlimited because any source would be accommodated for the user in necessity and take back in other times and with this procedure, the best utilization will occur. 4-Memory space of IoT is so limited that it can be overlooked whereas memory space of cloud unlimited. 5-Internet in IoT has an essential role in communication and collecting devices; clouds also do clouds. They use the internet for delivering required services. 6-IoT devices are making a large amount of information that should be saved and processed all the time. Clouds are the best choice for being with IoT devices because of their unlimited spaces [2].
servers, are widespread, and it is possible that we are forced to receive and combine various services from different providers to respond to a user’s/thing’s request. On the other hand, combining the least services, to minimize data transfer and energy consumption, required its particular mechanism and algorithm. Based on what we said previously, it seems our ability in determining what pair (service/set of services, cloud) we use to respond to user’s requests, is determinant for our success in speeding responses and successively acquiring user’s satisfaction [1]. Therefore, receiving service from clouds settled in different providers and combining them, enforces a load of data transfer on network, in this paper we are trying to find a useful algorithm, that it can find a combination of services in an integrative environment of cloud and internet of things in optimum time, which has the least addition overhead for cloud environment in addition to fulfilling user’s requests.
We know that the cloud environment has specific characteristics and categories and isn’t specified as one aspect or type, and also according to the evolution of science and existing tools, improving devices and their capabilities, and varied user requirements through times, we’re not limited to any particular form in the field of IoT and thus numerous forms of communication type and requested services are propounded. However, this variety does not matter to our research case as we have supposed solving the problem be in general condition. The considerable point for us, is that, regarding extension of IoT and its undeniable demand for cloud environment to deliver requested services, it’s necessary to recognize quality of service (QoS) metrics in service composition in the cloud environment besides utilizing existing tools and standard data to simulate the problem according to these factors and try to introduce an algorithm outperforming the previous similar ones in one or more quality factors. It is desired in this analysis to decrease the required time for the intermediate layer to combine different providers’ services in order to meet user requested services, the number of services examined before responding to users’ requests and also the number of used clouds.
Several approaches in the literature focus on the IoT devices energy consuming challenges at the hardware level [3][4][5][6]. For example, sensor nodes can switch their radios off when not in use, to save power and can wake up only when they are needed to operate. These techniques are not efficient when the IoT devices are exposed as software components and are deployed in the cloud environment to be accessible to their users [7].
A. Problem Statement
Our problem is defined in space, including numerous devices with the ability to connect to the internet and receive services from a cloud environment. In this environment, each user's request is sent to the broker layer. In many cases, fulfilling the user’s request requires obtaining several clouds services. This scenario is the main reason of services composition problem [8]. We know that the services presented by each provider do not necessarily
include all existing services. Because of that, the middle layer must manage and based on services provided by every provider, find a collection of providers and clouds that contains all of the user's requested services. In other words, this problem is concentrating on establishing a new value-added cloud service, which uses a previously existing combination of cloud services [9].
In more formal word interpretation, a web service is a self-contained, self-describing, and web-accessible software unit in a more formal statement that is presentable by the service provider and is recalled by service requests all over the internet [10]. These days data transfer is simplified around the world through internet and web-based services [11]. Cloud computing provides dynamic, scalable and virtual resources, as services as a web and Internet-based computing model [12].
While using the virtual sources of the cloud environment, we should pay attention to the cost that should be paid for the usage of it. It means that if a user needs a source for a particular time or continuously in some time, he does not need to buy it, and he can use it whenever it is needed and can return it when it is not needed then it will be available for other users. This algorithm makes it possible to use the sources not only with amortized cost but also in a faster way, and we know that the amortized costs of resources certainly enhance efficiency. This kind of service giving that is called on-demand, includes different hardware and software services [13].
Apart from the type of the provided service for the user, a cloud computing architecture provided services can be one of the three models containing: Infrastructure as Service, Platform as a Service, Software as a Service [14]. IaaS: Cloud infrastructure-based services are self-service access, monitoring, and remote data centers infrastructure administration models like calculating, memory, and web services. In the other term, the user could utilize the virtual machines instead of purchasing the needed hardware and only pay the costs of used service, similar to electricity and other services which are provided widely and everyone pays the cost according to the using amount.
PaaS: This servicing model provides the software developing framework for users and helps them through creating, developing, managing and executing their applications without struggling with the system software and hardware's complexities SaaS: In this servicing model, the presented service is a software, and the user should apply through the given user interface to connect to the requested software. Most SaaS applications can be executed without downloading or installing software and only by a browser and at most with a plugin.
In many cases, the user's request can be fulfilled with several resource combinations called service composition.
services analogously to give different kinds of services to the final user namely human. As we see, costumer and provider are connected within a go-between that is mostly called the broker layer. The connection part between request responding space and the user is the given algorithm. We see in this picture that the algorithm in the broker layer is settled on top of the pyramid and other components in the cloud environment we mentioned before, include other parts.
In our problem, we consider that we have some services called si. Our problem is difficult, and that is that each of these services is not accessible by itself. It means that whenever we need a service si, after finding a composition plan, by the algorithm that contains our service, we have to expend for all the services in that composition plan f; because services are given in multiple packages (not alone) in the form of composition plan. Although in a cloud environment, optimality of serving needs providers giving their composition plans based on accurate computing and clustering requested services, for most of these services that are given in a composition plan be probably required for the user. However, some other factors like resource proper distribution and hardware regard sometimes make providers put services together that besides being an acceptable correlation, be easier and less expend.
In (Figure 2) that is gotten from paper [8] a view similar to what has recently been a reference to papers, is represented. In this picture, we see that each of MCPs (Multiple Cloud service Providers), has some service packages. In each package, there are some services, and if you want to receive any of these services, you should expend for all the services in the package. In this picture, each of f’s is equivalent to a composition plan that has been expressed in (Figure 1) and represented by π.
B. Necessity and Importance of the Research
In the statement of importance and necessity of investigation of service composition in the cloud, at least two reasons can be counted. First, the statement of the relation between the cloud and internet of things is close and should be investigated and second that the service composition in the cloud has its difficulties [1].
Increasing growth of cloud application in the persistence of IoT and boosted several Internet-connected devices around the world are proved by a thorough look at global statistics. Based on Gartner prediction, in 2020, there will be about 20 billion Internet-connected devices [15].
In [7], defining the best combination of services from different providers that adjust to user requirements, environmental expectations, and the broker layer has been considered as the primary challenge of IoT provision in the multi-cloud environment because of these reasons: 1. How should be the function of the middle layer to combine the various services in a condition that none of them lonely can satisfy the user's request? 2. Reducing the energy consumed is one of the most important quality factors of this problem. Which one of the providers should the
middle layer get the services from, in a way that fewer clouds and providers are involved and also less data is transferred?
Service composition is an NP-hard optimization problem [16]; i.e., It is more complicated than the most complex problems of NP class, and if it can be solved in polynomial time, then all of the NP-class problems will be soluble. The solution to this problem is a challenge because it is not only service composition but also a combinatorial optimization [10]. This field still needs to be paid attention and also needs time to be devoted to, since [17] has pointed in his research which was conducted in 2017, that there has not been any systematic and comprehensive analysis on the service composition problem in the cloud environment before.
The article attempted to resolve the gap in this field by expressing anatomy and categorization of limited research in this case and highlighted key points for improving methods of service composition.
Fig. 1. A representation of a multi-cloud environment.
The article attempted to resolve the gap in this field by expressing anatomy and categorization of limited research in this case and highlighted key points for improving methods of service composition.
C. Article Structure
In this part, we studied the preliminary statement, the importance, and necessity of research, and the research goals. In the second part, we will explain the formal form of the problem. We will list the previous studies, and we will outline the goals and the positive and negative aspects of each of them in the third part. In part 4, we will express our proposed algorithm, and the steps taken in this study. Also, the challenges and solutions to solve the problem will be described. Moreover, in the fifth part, we will list the results of the proposed algorithm. A comparison between the present and previous methods and providing solutions to enhance the results of future researches with some suggestions that consist of the topics discussed in the last section.
2.PROBLEM STATEMENT
In this section and the next, we are going to describe the detail of the problem, explaining the definitions, and presenting the previous studies .Talking about previous studies will necessarily clarify the need for this study, and we can find a bright idea for the question "How do you solve this problem?" by examining the styles and patterns used in. During the discussion of previous works, algorithms will be proposed for this problem that they have the appropriate solution and not necessarily optimal. We will explain more about the meaning of the keyword «quality factors» that is mentioned in the abstract part of the article and will describe the comparison standards of different methods .Finally, we will explain our approaches in the next section after clarifying the problem space in these two sections.
In multi-cloud, various QoS metrics are essential in the field of service. Time, cost, scalability, optimality, and efficiency are some of the most important of these. Time is the length of the waiting period of the user, or we can say that the distance between sending a user request to the server until it receives an answer. Scalability represents the ability to modify and adapt to other variables in the cloud environment. Price is the total amount charged for responding to a request. Optimization is to find the best or most useful combination of service that comes with the right methods. Efficiency is also a returns rate; how satisfied is the response to a given amount of time and cost. The issue that we are discussing, in a multi-cloud environment has been presented, and several solutions have been suggested for it. Multi-cloud solutions are mechanisms that there exist multi-suppliers for providing clouds [18].
A. Formal Description
In this part, we will explain the names and terms used in the problem space and also in the algorithm
Definition 1. Web Service: A pair of <I, O> both of which are service interfaces.
Definition 2. Web Service Composition (WSC): It is a dual <I, S>, which I is the initial service interface that is specified in the user request, and S is the set of web services offered. Assuming that we have a web service composition problem <I, S> the answer to this issue is f composition plan. Specifically, f is a set of services: f ⊆ S. Definition 3. Cloud: A set of f composition plans that are distinct and formed at least from one service.
Definition 4. Multiple Cloud Provider (MCP): A set of distinct clouds and each cloud contains at least one composition plan.
Definition 5. Cloud Web Service Composition problem (Cloud WSC): The pair is the <I, MCP>, As I indicated to the service user requests and MCP multi-cloud provider or simply as suppliers are concerned. The answer is a set of pairs <service, cloud> similar to W = {<si, cp>, <si, sq>, ...} to the extent that the conditions are met:
To show the subject and the problem space, we need to give an example. All of the former algorithms that are going be mentioned in the next part use this framework and express and compare their possible results about this example. Assume that we have a multi-cloud environment that contains 5 MCPs called MCP1, MCP2, MCP3, MCP4, and each MCP consists of 4 clouds that are called C1, C2, C3, C4. Each of these <MCP, Cloud> pairs include some subset services S = {S1, S2, ..., S19} in the form of composition plans which are F = {f1, f2, f3, f4, f5}. Each of these 'f's in the OWLS-XPlan [19] standard project dataset which under the name Health-SCALLOPS [19][20] automatically composite services, represents several services in the Emergency Medical Assistance (EMA). This explanation of the existential nature of 'f's is found in the context of the problem of other environments and become exciting. In (Table 1) [21], the characteristics of these components can be seen. Each service is provided only in one of the 'f's and the collection of 'f's results in the S set as expected. Since the community of each of the four clouds in each MCP contains all the 'f's and subsequently includes all services, each MCP can respond to any combination of 19 services independently.
TABLE 1. MCP SETTING FOR ASSESSMENT. C4 C3
C2 C1
MCPNo/CNo
f1, f2, f3, f5 f3, f4
f4, f5 f1, f2, f3 MCP1
f1, f4, f5 f2, f5
f3 f1, f2 MCP2
f3, f4 f1, f2
f5 f1, f3, f5 MCP3
f4, f5 f1, f2, f3
f3, f4 f2, f3, f5 MCP4
f1, f4, f5 f3
f2, f3 f1, f2
TABLE 2. THE CLOUD SERVICES IN EACH COMPOSITION PLAN F. Services
Composition Plan
s1, s6 f1
s9, s10, s11 f2
s3, s5, s8, s12, s14, s15, s16, s17 f3
s2, s4, s18 f4
s7, s13, s19 f5
3.PREVIOUS WORK
There have been several methods of combining multiple services in the cloud computing environment [22] since 2009, that often assumed that all of the requested services were accessible from a cloud and that their concentration was only on the satisfaction of the user's request and the cost factor was ignored [7]. Studies have been conducted to enhance the performance of these methods according to different criteria such as cost, usefulness, energy consumption, response accuracy, and security [9] after finding a way to find the combination of service responses.
One of the most important studies in this area has been made by [23]. In this research, different quality of service (QoS) metrics, including accuracy, delay, reliability, cost, and availability, are analyzed. This review also contains a detailed categorization based on the different parameters which are related and dependent on existing techniques analysis. Based on this, research done by 2013, based on the techniques used in their studies, it has been divided into four classical and graph-based classes, machine-based approaches, combined methods, and framework-based approaches.
The result of the idea of using the path with the best QoS and lowest cost is a method to find composite service in [24] The method is based on the Dijkstra's search path which assumes that QoS attributes such as duration and throughput are additive . Based on multi-agent reinforcement learning [25] has explained a model for the dynamic optimization of service composition. By using reinforcement learning algorithms, the agent can interact with the environment in real time. This article used distribution to process tasks. Every task consists of some smaller tasks, each of the agents concentrates on its corresponding sub-task, and by using this distributed Q-learning algorithm, the process would converge fast. Also, in order to permit the composite service to be dynamically fitted a variable environment, an experience sharing strategy is suggested. As a result, the features of the component services may change. The mechanism is highly scalable and efficient, but its complexity is very high. Most recent studies concentrate on applying intelligent optimization algorithms to find the optimal solution of the nonlinear integer programming problem, but the low rate of convergence and the high probability of falling into the local optima are bottlenecks of these algorithms [26].
In [27], the author also referred to the different mechanisms of service composition in a single-cloud environment. Article [28] also assesses different challenges
for example language, tool support, knowledge reuse, executive framework, and target users, and reviewed some articles that examined service composition problem from the perspective of these challenges, but there are still some difficulties in modeling the problem of service composition, the analysis of QoS metrics and also open issues in this area. The review [17] considers all articles from 2012 to 2016 and provides a complete overview of the methods suggested for the composition of the service. All related articles have been extracted from 9 valid and highly referenced sources in this article by using three available combination search terms, and only useful and practical articles from these 942 articles remain. Filtering articles based on the keywords of the main title of the articles, deleting conference papers, reviewing and pre-2012, deleting the articles without sufficient explanation about the method of work, QoS metrics, and datasets, are the steps taken in this review and 20 achieved articles is the result. From the author of this article, the resulting articles are divided into three, framework-based, agent-based, and heuristic- based. In each of these categories, 7, 6, and 7 of the 20 selected papers selected for the final review in [17] included.
In short, we can say that framework-based methods are less burdened by a weakness such as high calculation time than other methods and are suitable for usage in various environments, whether it be single-cloud or multi-cloud. Agent-based methods have better handling of scale and are especially suitable for use in a multi-cloud environment. In contrast, although heuristic-based methods do offer optimized solutions at a lower cost, they are only suited to single-cloud environments .
After studying over 50 articles on the methods that was used for service composition in cloud environment, we arrived at the idea of improving the load balance factor for the first time and simultaneously, we try to optimize other QoS metrics in the previous studies, the number of services examined before responding to users’ requests and number of clouds involved. Some of the other algorithms overwhelm one of the clouds and their algorithms aim at minimizing the number of services examined, send all of the requests firstly to the provider and cloud that have more composition plans than others wishing that higher probability of responding to their demand, While in real-world conditions and also in simulations which are close to the fact that many environmental factors are considered and enforced, this policy is not useful and is the reason of bottlenecks and long queues, since the number of requests received is not limited, and they are added daily while our processing resources are limited. The result of this prolongation of the queue is not run time merely when the user receives the service, and also it is when the cloud has high traffic, and as a result, the user’s request is waiting for the supplier to respond.
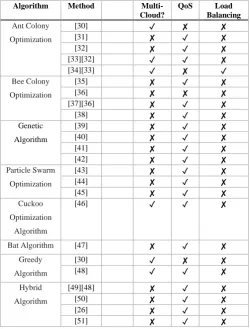
only in clouds that provide many services. As an example, when the hypothetical service S1 in the MCP1 provider is provided only by C1, in the general look we see that the users that request to get S1 service, they will regret that because of two reasons. The first is that the service is provided by one cloud and doesn't have the capacity to capture its intended service, and the second one is that the service provider cloud is a crowded cloud, since the cloud always enters a long queue of requests, and it makes serving services like S1 well, much harder and unlikely. In (Table 3) [29], it is concluded that the debate on the workload of clouds on this issue has been ignored and few articles have been published in this area.
[10] is a detailed article that uses three applied algorithms with straightforward ideas, and each algorithm concentrates on some of the QoS metrics. All three of the algorithms of this article, known as the All Cloud, Base Cloud, and Smart Cloud hybrid algorithms, are non-distributed and centralized. All the clouds are considered as an option in the first algorithm, "All Clouds", in a fixed MCP that combines them to count all possible states and reports the optimal state. This primitive algorithm that is the first solution that comes to mind finds a near-optimal list of 'f's, but the number of clouds in this method is not optimal at all, and to reach an answer, a large number of services examined. As a result, the algorithm does not have enough QoS metrics.
All cloud combination possibilities in increasing order are enumerated by the Base Cloud algorithm recursively until an optimal solution is identified. It begins by analyzing all singleton sets of clouds and stop searching if the required combination can be found utilizing a single cloud. Otherwise, it extends its search to cloud sets of size two, then three to find the required combination. It produces an optimal composition solution with a few clouds, even though this method has one of the QoS metrics, it has a lot of time to run, and a lot of services are checked in order to get the answer.
Smart cloud is the final algorithm of this article, which is designed to find an approximate solution. This algorithm imagines the problem space as a tree form, and by searching, finds a near-optimal answer that consists of fewer clouds, but still has a high execution time and is not cost-effective.
The next article [8] was released in 2015 and presented COM2 algorithm with better results. This article that gets its name from the Combinatorial Composition shortcut suggests a combinatorial optimization algorithm for the problem which has fewer run time and cloud compositions, and it is more efficient than the former algorithms. The latest article in this area [7], published in 2017 that tries to provide a better servicing with a simple exploratory algorithm. In this algorithm which is called E2C2 in each executive loop (as long as the intended user services are adequately provided), the cloud which has a more significant number of composition plans f and has not been
TABLE 3. AN OVERVIEW OF SOME SERVICE COMPOSITION TECHNIQUES AND THEIR MAIN FEATURES.
Algorithm Method
Multi-Cloud?
QoS Load
Balancing Ant Colony
Optimization
[30] ✓ ✘ ✘
[31] ✘ ✓ ✘
[32] ✘ ✓ ✘
[33][32] ✓ ✓ ✘
[34][33] ✓ ✘ ✓
Bee Colony
Optimization
[35] ✘ ✓ ✘
[36] ✘ ✘ ✘
[37][36] ✘ ✓ ✘
[38] ✘ ✓ ✘
Genetic
Algorithm
[39] ✘ ✓ ✘
[40] ✘ ✓ ✘
[41] ✘ ✓ ✘
[42] ✘ ✓ ✘
Particle Swarm
Optimization
[43] ✘ ✓ ✘
[44] ✘ ✓ ✘
[45] ✘ ✓ ✘
Cuckoo
Optimization
Algorithm
[46] ✓ ✓ ✘
Bat Algorithm [47] ✘ ✓ ✘
Greedy
Algorithm
[30] ✓ ✘ ✘
[48] ✓ ✓ ✘
Hybrid
Algorithm
[49][48] ✘ ✓ ✘
[50] ✘ ✓ ✘
[26] ✘ ✓ ✘
[51] ✘ ✓ ✘
used before is chosen. The algorithm also assumes that in all MCPs, the clouds are adjusted in a single form in terms of the number of 'f's and will not be paid for sorting out the cost. As outlined below and in the comparison table of the algorithms of this section, before the service is presented and provides excellent results the algorithm succeeds in reducing the number of tested services, but this algorithm uses the assumption of regularity and also its load balancing is not that good. In the next chapter, it will be shown that for random inputs that are similar to the problem's input, this algorithm will distribute bad loads and cause bottlenecks and slower servicing.
The recent algorithm, which is called E2C2, takes a simple approach and sends the input request first to a cloud with a more significant number of composition plans, with the hope that the cloud will occur with a higher probability of successful servicing, of course, this algorithm assumes that clouds have already been arranged based on the number of their composition plans. This method has good experimental results compared to previous algorithms although it is simple and can be implemented quickly, but it causes the traffic flow of one of the clouds to be increased and is not careful to the load balancing factor.
4.CLOUD COMBINATION ALGORITHMS A. TSM Algorithm
discussed in other articles, and in particular, the articles that are going to be mentioned in the next part and are directly comparable to our algorithm. Reducing the number of clouds involved in the process of fulfilling user requests, the execution time, as well as reducing the number of services examined before responding to users’ requests in previous studies. In this study, we intend to set the system's workload, in addition to enhancing or sustaining the above factors.
In a situation where the algorithm often leads us to use a specific cloud and, in a sense, does not program a regular usage of the clouds, we are faced with a considerable number of requests at the input of that cloud that is waiting to be analyzed. Since we assume that the algorithm produces the most optimized result, then the forming of a queue at the input and a bottleneck in the system which will directly impact the request response time and cause dissatisfaction for the user is not acceptable. We have implemented a uniform usage of each specific MCP, or in other words, we have added the factor of load balance to the factors considered in our problem and have designed the algorithm in a way that this factor remains in an approximate uniform state. To measure this factor, we use the standard deviation index between the number of times each of the clouds used in a specific MCP. As the number of clouds is closer, the standard deviation is smaller and assuming that in the process of receiving and answering 100 requests, if the first cloud is used 70 times, then the rest of the clouds are not only used 30 times.
The TSM stands for "tree-based similarity measure". In this algorithm, the components of the problem, which are MCPs and clouds, are assumed to be roots of a tree which, at its root, our algorithm lies. For the beginning, we start with the zero time of the simulation. At first, there is not any information on the amount and services provided in each of the clouds or suppliers, and we only assume that the components of the problem in the tree structure are applicable. Each MCP node has several children, corresponds to clouds of the system, and each cloud can provide several composition plan f. The Data1, ..., Data5 parameter was used to simulate whether each of the 'f's has existed in the cloud. Each of these parameters is 19-bit strings, which 19 can be any other number equal to the number of unique services that were provided in the problem. Each bi bit of this string for the Dataj parameter means the presence or absence of the number i service in the composition plan fj in the specified <cloud, supplier> pair. The Data parameter which was defined for the specified <cloud, supplier> pair is aggregation of these five Datai parameters, and as said earlier, all the 19 parameters should be all 1 in the MCPs, since each service is at least included in one of the composition plans and each composition plan f is shown at least in one of the clouds in that particular MCP.
The algorithm's methodology is something that the set of user-requested services are given in the form of a bit string and is given to the algorithm, or we can say that, being given to the root of the tree. Based on said MCP, the request is sent to one of the child's of root, and after the
similarity factor of this input string with the child clouds of the MCP gets calculated, the cloud and composition plan with maximum similarity get selected and during a loop, efficient resources to satisfy the requested services is found. In the routine of TSM algorithm, the algorithm regularly calculates the similarity factor of two bit strings and this method is useful to reduce the cost of the algorithm because bitwise operations can be run in parallel at the time o(1) with accessible hardware requirements and Low cost.
1) Initial Launch Phase
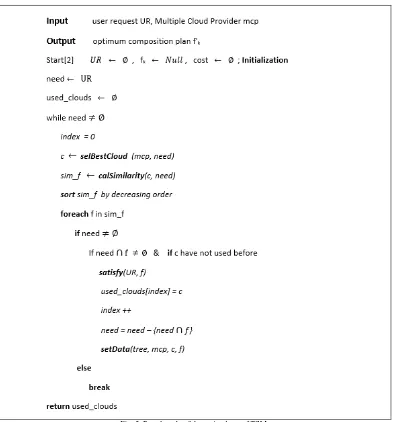
The assumptions for the first phase of the simulation were mentioned in the previous segment. In this section, the goal is to achieve an understanding of the structure, quality, and quantity of the services provided in their environment. Therefore, we do not have optimization in the presentation of our services; instead, we merely offer the first random answer that is satisfying to the user. In this part, user requests are received and routed to a randomly ordered list of clouds, and each cloud uses all of its existing 'f's to satisfy the request. The algorithm stops whenever all requested services satisfied, and the response returns. That means the system works, user requests are answered, and we will identify the details of our multi-cloud environment concurrently. After requesting each sk request service from a couple of < MCPi, Cj, fp >, all the services provided to the user in this package get summarized, resulting in a 19-bit binary number called f, that we use from some of its services, but the information of all services provided in this service package in our data tree can be used. This value initializes one of the Data parameters of the jth child of an ith child of the root. This way, during the servicing of the initial phase requests, our multi-cloud information tree is set up and ready for the next steps. Our experimental results demonstrate that after processing about 50 requests, the tree is wholly initialized and is ready to go to the next phase. In (Figure 3) [1], we see the pseudocode of the initial phase.
2) Main Phase
In this phase, for each request, the cloud Ck is selected by algorithm which its Data variable value is the most similar factor with the input string, and in the next step, the composition plan fp that be more similar to the requested input string and, if necessary, then other composition plans of Ck will be selected. After the task of the cloud Ck is completed, the required services parameter is updated, and the next cloud is selected if the parameter is still opposed to zero. This approach means maximum similarity measurement is the heuristic that we have suggested solving this problem and to find a proper approximate answer.
case can be saved in cache after calculation, because both the access is fast and it prevents additional calculations. Whenever a new entry arrives, if the ordered list of optimal clouds for that specific request was available, the list will be used otherwise we will pass the similarity measure phase, and after that, save it in the cache until the same request arrives. As an example, with the assumptions of this issue, approximately 512k was the number of storage space rows per presence/absence of the desired service in the user's request. In each row, there are five variables per MCP, and in order to determine the order of the clouds, each variable needs up to 8 bits. For example, in the 58963rd row of this array, we have four variables and the value of the second one is "100010011000", it means that in order to satisfy the request with the byte code of "0001110011001010011"=58963 requesting the services with numbers of 1, 2, 5, 7, 10, 11, 14, 15, 16 from the MCP2, it is necessary to choose the cloud 4="100" first and then the cloud 2="010" and finally the cloud 3="011". There is no need to use the cloud of 1 at all. The maximum memory that is needed in this mode is only 3.75KB. In (Figure 5) [1], we see the pseudocode of the main phase.
This phase is after the construction of the full information tree, which stores the properties of the services provided in each one of the composition plans f, corresponding to each <mcp, c> pair. In this phase, based on the provider that is supposed to provide the service, the request is given to a cloud that has the most similarity to the requested service based on the data value. This maximum similarity is a heuristic approach which we have provided as a means to an approximate solution. Each service, after being given to an optimized cloud, is analyzed again and similarity factor of all of f's of the clouds are calculated with the requested service,
and like the previous section, allocation priority is given to maximum similarity. When the service is fully provided, the algorithm will finish. As we have mentioned before, a simple way to avoid unnecessary calculations in this method is to use a hidden memory to store the optimized results for each specific requested service and provider pair. In the last sentence of the algorithm, this method has been implemented. The implementation of the calculation of the similarity factor for choosing the selection priority of the clouds and the composition plans have been provided in (Figure 4) [1].
3) Similarity Factor
In this part, multiple simple and propounded similarity factors which are widely applied are examined. After all these similarity factors were applied, the number of clouds used in response to a request and also the number of tested services before coming to a final result in average and for a random input was the same, but since primacy of selected clouds are directly affected by the factors and each of the factors had a different impact on the third QoS metrics i.e. load distribution.
All of the tested similarity factors were a combination of likeness and contrast of input variables, which are byte
codes of requested services and composition plans. How to combine either of these amounts in conclusion and name the two byte strings similar or different, was the main challenge. Our desirable outcome was making a balanced load distribution than former methods, that was why we chose similarity factors which brought us equal value to several likenesses and differences in the two byte strings measured by "bitwise and" and "bitwise or". With this calculation formula, it forces a more balanced work-load on each of the clouds. The similarity factor you see in (Figure 4) is reducing the number of differences in the two byte strings from the number of likenesses and for avoiding negative variable, it is added with a constant value. Other formulas that we used to calculate this factor are 1. The inverse of the number of mismatches between two bit string means "bitwise xor" operator, 2. The number of similarities between two bit strings means "bitwise and" operator, 3. Subtractive linear combination of similarities and differences between two bit strings in which the difference is multiplied by coefficients 1/4, 1/3, and 1/2; e.g. (similarities - differences/3); i.e., in this formulas the “similarities in having 1” is twice, three, or four times more significant than “lacking differences.” The final formula is a subtractive linear combination of similarities and differences in a two bit string with the difference having the coefficient 1; i.e. (similarities - differences) meaning that the significance of “similarity in having 1” and “lacking difference” is considered the same. In (Figure 4), the pseudocode of similarity measure procedures of TSM is shown.
To clarify the concept, we have an example here. Assume that we have these strings: a = "100110000100000 1000" and b = "0001100000000001000" and c = "1001100001011101001". Both strings 'a' and 'b' have the value of "1" in the three corresponding positions and have different values in the two other corresponding positions. In this case, the number of similarities between 'a' and 'b' is 3-2=1. If both the string 'a' and the assumed string 'c' have the value of "1" in the five corresponding positions and have counter-values of "1" and "0" in the four corresponding positions, the number of the similarity will be still 5-4=1, i.e., the strings 'b', 'c' have the same (number of) similarity to the string 'a'. The reason why the worth of having "1" in the corresponding position was equal with the worth of not having different numbers is easily explainable by analyzing the problem. In the previous example of the given byte numbers 'a', 'b', 'c', it is assumed that 'a' is a user request and 'b', 'c' are composition plans. The composition plan 'c' is higher than 'b' in the number of commons of 'a'; which means, it can provide more of the services demanded by 'a'. Meanwhile, this composition plan provides a large number of services that 'a' does not need to receive. Moreover, these unfunctional services increase the cost factor |SP| and reduce the efficiency of the algorithm.
B. A simple huristic SIHU
Fig. 3. Pseudocode of the initial phase of TSM.
Fig. 4. Similarity measurement in TSM
for solving service composition problem in multi-cloud environment, which most of them use simple and common ideas. If the service provider clouds and MCPs properties are not variable, simpler ideas can be used. In this section, we present a simple idea for a quick assignment and mention simulation results of it.
In this method, the pre-processing phase is first implemented, so, according to the cloud’s properties and the provided services in each of them, it forms 4 classes for input services. At first, requested services are checked and
classified into one of these 4 classes. In the first executive loop, according to the fact that to which class a received service belongs (based on the simple 'analyze' algorithm), it is sent to the cloud corresponding to that class to satisfy its request. Then, the algorithm continues according to the E2C2 algorithm. This loop will run until all the requested services are fulfilled and each time the new cloud with the most composition plans is chosen.
Fig. 5. Pseudocode of the main phase of TSM
this goal, we considered a computational section called pre-process. This section is designed independent to the properties of provided services in clouds and the clouds of every provider. For each MCPi provider, a mi1 table will be created. Each mi1[n,p] entry is a fraction representing the number of pth category provided services in Cn cloud of the MCPi provider, divided by total numbers of provided services in pth category. We will express this method in details for MCP3 which mentioned its properties in Tables 1 and 2 (Table 4). We have considered s1 to s5 as the first category, s6 to s10 as the second, s11 to s15 as the third, and s16 to s19 as the last category.
Since our goal is to achieve a uniform load distribution, we seek to classify input requests into four categories (equal to the number of clouds). We give each request to the cloud that can withstand it with higher probability in order to improve other qualitative factors too. For this purpose, according to the values of the mi1 table, we determine the values of corresponding entries in the mi2 table too. Each entry in the first table is converted to a number in the rage of 0 to 4 and inserted in the second
table. We have four numbers in each column of the first table. Each number of 0 is considered 0 in the second table too. The smallest non-zero number is considered 1, and so the larger numbers are considered in the same manner. Below in the (Table 5), we see the second corresponding table to MCP3.
After doing all these steps for all MCPs, we will have 5 tables that by summing up the values of each corresponding entry, we will have a summed up 4*4 table.
TABLE 4. PERCENT OF PROVIDED SERVICES IN CLOUDS OF THE MCP3
s16 - s19 s11 - s15
s6 - s10 s1 - s5
3/4=0.75 4/5=0.8
3/5=0.6 3/5=0.6
C1
1/4=0.25 1/5=0.2
1/5=0.2 0/5=0
C2
0/4=0 1/5=0.2
3/5=0.6 1/5=0.2
C3
3/4=0.75 3/5=0.6
1/5=0.2 4/5=0.8
C4
TABLE 5. SIMPLIFICATION OF TABLE 4 2
3 2 2 C1
1 1 1 0 C2
0 1 2 1 C3
This table indicates how possible it is to satisfy an appointed service, which most of its requests are from classes 1 to 4, to correspond class; for each of the clouds in summation of all the providers. In the assumed example, the final summed up table is mentioned in (Table 6).
The final processing is done in accordance with the table above. We must decide what is the optimal permutation for the clouds from first to fourth categories of services. We want to find a permutation to satisfy requested services faster while keeping the load distribution balanced. to achieve this, first we consider a random permutation and then we optimize it. Optimizing the initial response is based on the standard deviation between numbers of the entries of the table and the sum of their values. It means that the optimized permutation is the one that numbers of its entries of the table have larger values and are closer to each other. For example, if we choose the yellow highlight with 7, 7, 10, 10 values as the initial answer, it’s sum of the values is 34 and the standard deviation is 1.78. And so, for the green highlight with 12, 8, 8, 9 values have 37 as sum, and 1.64 as standard deviation. The green highlight has a larger sum and less standard deviation. So, it's a better permutation. According to this calculation, the optimum permutation is [4, 1, 3, 2] which means the request that most of its services fall into the first, second, third and fourth categories are respectively given to the fourth, first, third and second clouds in the first running loop, independent of corresponding MCP.
5.IMPLEMENTATION RESULTS
All algorithms which are defined precisely in accordance to our problem and were considered in the previous part applied the problem structure with mentioned characteristics in chapter 4 in their simulations; for example, we have 19 services that each exist precisely in one of the composition plan f1, ..., f5; the problem space includes five providers that all of them have four clouds and the composition plans presented is the difference between every “cloud, provider” pair and the other is in the composition plans presented in them.
In order to test the way of responding to input requests, all algorithms mentioned earlier, only used the input string UR= {S1, S5, S9, S11, S14, S15, S18} and calculated and their QoS metrics is merely stated based on this input string. But in this part, the designed algorithm for 1000 random inputs all having a size of 7 is tested, equal to that of above input, to demonstrate algorithm's independence from the input and that generally leads to optimum results. The experimental results of other algorithms for assumed inputs are shown in (Table 7) and (Figure 6). We can observe that for the input request UR= {S1, S5, S9, S11, S14, S15, S18}, fewer clouds have been involved by our proposed algorithm TSM, and the CC factor is equal or less than that of other methods, and before coming to the response it has fewer tested services called SP factor in both of algorithms. Also, in (Figure 7) [1], a comparison between the efficiency of algorithms in the first QoS metric, i.e., the number of involved clouds have been made and clearly shows the improvement in the TSM algorithms.
In this paper, for a more reliable comparing and more accurate analysis, we implemented the E2C2 algorithm exactly as the corresponding paper. We compare the produced results obtained in the same conditions with the TSM and SIHU algorithms. The input of this step of the simulation is 1000 service requests produced randomly and the (Table 8) and the (Figure 8) show the independence of the algorithm from inputs and also the fair load balancing of our algorithms. In processing and service delivery to 1000 service requests, each been sent to 5 providers, i.e., totally 5000 distinct commands, clouds the TSM algorithm has used one to 4 2692, 3047, 2952, 3621 times respectively. If we divide them by the number of inputs, we come to 0.538, 0.609, 0.590, 0.724.
In this article to measure the optimality of the load balancing factor in algorithms, we used the standard deviation factor. The standard deviation of usage of clouds in TSM is 0.0679. Also, for the E2C2 algorithm which
TABLE 6. SUMMED UP VALUES OF ALL MCP'S CORRESPOND TABLES 6 12 13 7 C1 8 10 7 8 C2 7 10 10 8 C3 10 9 9 12 C4
TABLE 7. EXPERIMENTAL RESULTS FOR THE MCP
Smart Clouds COM2 QSC_MCD E2C2 TSM SIHU Algorithms CC SP CC SP CC SP CC SP CC SP CC SP MCPs C1 C3 70 C4 C2 35
C4 C2 C1 35 C4 C2 35 C1 C2 19 C3 C4 19 MCP1
C1 C2 C4 48
C4 C2 C3 45
C4 C1 C2 27
C4 C1 C2 26
C1 C2 C4 21
C3 C4 C1 27
MCP2
C3 C4 48
C1 C4 C3 50
C1 C4 C3 29
C1 C3 C4 29
C3 C4 16
C3 C1 C4 29
MCP3
C2 C3 140
C1 C3 C2 49
C1 C3 C4 38
C1 C3 C2 38
C3 C4 19
C3 C1 C2 35
MCP4
C1 C2 C4 56 C2 C4 30 C2 C4 19 C4 C2 24
C1 C3 C4 21
Fig. 6. Comparison between |SP| of algorithms
Fig. 7. Comparison between |C| of algorithms
Fig. 8. The usage of each of clouds for 1000 random inputs.
implemented accurately, we run the simulation. Clouds has been used by this algorithm to 4 4773, 3530, 2875, 3773 times respectively. If we divide them by the number of inputs, we come to 0.95, 0.706, 0.575, 0.755 and the standard deviation of them is 0.1364 that is twice larger than our algorithm’s as shown in (Figure 9). The load distribution helps to shorten the entrance queue of the clouds and prevent the bottleneck. Also, with the balanced distribution of the workload on the clouds, the possibility of failure of the clouds becomes less.
6.CONCLUSION AND FUTURE WORK
In this chapter, the results of TSM algorithms and other algorithms were compared. In case of each of the factors concerning the number of involved clouds in service production, the number of inspected services before responding to request and the workload between the clouds
Fig. 9. Improvement of load balancing for 1000 random inputs.
TABLE 8. QOS METRICS FOR 1000 RANDOM INPUTS
Clouds C1
C2 C3 C4 SUM |SP|
E2C2
3.773 2.875 3.530 4.773 14.971 142.271
TSM
2.692 3.047 2.952 3.621 12.321 100.838
SIHU
3.376 3.021 3.006 3.716 13.119 120.194
of the system, TSM was remarkably enhanced and have improved 17%, 29%, and 50% respectively, compared to the best results before. The significance of load balance in every problem is clear to everyone but in this special case, the abundance of inputs and the user's expectations of the system to respond in real time makes it necessary that the algorithms be defined in a way to avoid bottlenecks and long ques at the entrance of the cloud. By this change applied, besides avoidance of early depreciation of the system and thus one of the clouds being out of reach, the user's satisfaction will be more.
REFRENCES
[1] Z. Nazari, A. Kamandi, and M. Shabankhah, “An Optimal Service Composition Algorithm in Multi-Cloud Environment,” 2019, pp. 141–151.
[2] A. Botta, W. De Donato, V. Persico, and A. Pescapé, “On the Integration of Cloud Computing and Internet of Things,” in
International Conference on Future Internet of Things and Cloud (FiCloud), 2014, pp. 23–30.
[4] M. Taneja, “A framework for power saving in IoT networks,” in
2014 International Conference on Advances in Computing, Communications and Informatics (ICACCI), 2014, pp. 369–375. [5] Z. Abbas, W. Yoon, Z. Abbas, and W. Yoon, “A Survey on
Energy Conserving Mechanisms for the Internet of Things: Wireless Networking Aspects,” Sensors, vol. 15, no. 10, pp. 24818–24847, Sep. 2015.
[6] J.-M. Liang, J.-J. Chen, H.-H. Cheng, and Y.-C. Tseng, “An Energy-Efficient Sleep Scheduling With QoS Consideration in 3GPP LTE-Advanced Networks for Internet of Things,” IEEE J. Emerg. Sel. Top. Circuits Syst., vol. 3, no. 1, pp. 13–22, Mar. 2013.
[7] T. Baker, M. Asim, H. Tawfik, B. Aldawsari, and R. Buyya, “An energy-aware service composition algorithm for multiple cloud-based IoT applications,” J. Netw. Comput. Appl., vol. 89, pp. 96– 108, Jul. 2017.
[8] A. A. F. Heba Kurdi, Abeer Al-Anazi, Carlene Campbell, “A combinatorial optimization algorithm for multiple cloud service composition,” Comput. Electr. Eng., vol. 42, pp. 107–113, Feb. 2015.
[9] A. L. Tang M, “A hybrid genetic algorithm for the optimal constrained web service selection problem in web service composition,” in Evolutionary Computation (CEC), 2010 IEEE Congress on, 2010, pp. 1–8.
[10] Y. Zou, G., Chen, Y., Xiang, Y., Huang, R., Xu, “AI Planning and Combinatorial Optimization for Web Service Composition in Cloud Computing,” in Annual International Conference on Cloud Computing and Virtualization, 2010.
[11] A. A. Zahra Pooranian, Mohammad Shojafar, Bahnam Javadi, “Using imperialist competition algorithm for independent task scheduling in grid computing,” J. Intell. Fuzzy Syst. vol. 27, no. 1, pp. 187-199.
[12] A. Bastia, M. Parhi, B. K. Pattanayak, and M. R. Patra, “Service Composition Using Efficient Multi-agents in Cloud Computing Environment,” in Intelligent Computing, Communication and Devices, Springer, 2015, pp. 357–370.
[13] N. J. N. Mehran Ashouraie, “Priority-based task scheduling on heterogeneous resources in the Expert Cloud,” Kybernetes, Vol. 44 Issue 10, pp.1455-1471, 2015.
[14] S. K. Garg, S. Versteeg, and R. Buyya, “A framework for ranking of cloud computing services,” Futur. Gener. Comput. Syst., vol. 29, no. 4, pp. 1012–1023, Jun. 2013.
[15] Egham, “N,” Gartner. [Online]. Available: https://www.gartner.com/newsroom/id/3598917.
[16] M. L. V. Gerardo Canfora, Massimiliano Di Penta, Raffaele Esposito, “An approach for QoS-aware service composition based on genetic algorithms,” in Genetic and Evolutionary Computation Conference, 2005.
[17] A. Vakili and N. J. Navimipour, “Comprehensive and systematic review of the service composition mechanisms in the cloud environments,” Journal of Network and Computer Applications, vol. 81. Academic Press, pp. 24–36, 01-Mar-2017.
[18] D. Ardagna et al., “MODAClouds: A model-driven approach for the design and execution of applications on multiple Clouds,” in
2012 4th International Workshop on Modeling in Software Engineering (MISE), 2012, pp. 50–56.
[19] M. Klusch and A. Gerber, “Fast Composition Planning of OWL-S OWL-Services and Application,” in 2006 European Conference on Web Services (ECOWS’06), 2006, pp. 181–190.
[20] A. Urbieta, A. González-Beltrán, S. Ben Mokhtar, M. Anwar Hossain, and L. Capra, “Adaptive and Context-Aware Service Composition for IoT-based Smart Cities.”
[21] S. Bharath Bhushan and C. H. Pradeep Reddy, “A Qos aware cloud service composition algorithm for geo-distributed multi cloud domain,” Int. J. Intell. Eng. Syst., vol. 9, no. 4, pp. 147– 156, 2016.
[22] H. Mezni and M. Sellami, “Multi-cloud service composition using Formal Concept Analysis,” J. Syst. Softw., vol. 134, pp. 138–152, Dec. 2017.
[23] A. Jula, E. Sundararajan, and Z. Othman, “Cloud computing service composition: A systematic literature review,” Expert Syst. Appl., vol. 41, no. 8, pp. 3809–3824, 2014.
[24] J.-Z. Luo, J.-Y. Zhou, and Z.-A. Wu, “An adaptive algorithm for QoS-aware service composition in grid environments,” Serv. Oriented Comput. Appl., vol. 3, no. 3, pp. 217–226, Sep. 2009. [25] H. Wang, X. Wang, X. Hu, X. Zhang, and M. Gu, “A multi-agent
reinforcement learning approach to dynamic service composition,” Inf. Sci. (Ny)., vol. 363, pp. 96–119, Oct. 2016. [26] J. Zhou and X. Yao, “Multi-objective hybrid artificial bee colony
algorithm enhanced with Lévy flight and self-adaption for cloud manufacturing service composition,” Appl. Intell., vol. 47, no. 3, pp. 721–742, Oct. 2017.
[27] S. Asghari and N. J. Navimipour, “Service Composition Mechanisms in the Multi-Cloud Environments: A Survey,” Int. J. New Comput. Archit. their Appl., vol. 6, no. 2, pp. 40–48. [28] A. L. Lemos and F. Daniel, “Web Service Composition: A
Survey of Techniques and Tools,” ACM Comput. Surv. 48, 3, Artic. 33, 2015.
[29] S. Asghari and N. J. Navimipour, “Nature inspired meta-heuristic algorithms for solving the service composition problem in the cloud environments,” Int. J. Commun. Syst., vol. 31, no. 12, p. e3708, Aug. 2018.
[30] Q. Yu, L. Chen, and B. Li, “Ant colony optimization applied to web service compositions in cloud computing,” Comput. Electr. Eng., vol. 41, pp. 18–27, Jan. 2015.
[31] Z. G. Chen, “Research of Cloud Manufacturing Execution Path Optimization Based on Adaptive Ant Colony Algorithm on Hadoop Platform,” Appl. Mech. Mater., vol. 628, pp. 417–420, Sep. 2014.
[32] L. Wang, J. Shen, and J. Luo, “Facilitating an ant colony algorithm for multi-objective data-intensive service provision,” J. Comput. Syst. Sci., vol. 81, no. 4, pp. 734–746, Jun. 2015. [33] L. Wang and J. Shen, “Multi-Phase Ant Colony System for
Multi-Party Data-Intensive Service Provision,” IEEE Trans. Serv. Comput., vol. 9, no. 2, pp. 264–278, Mar. 2016.
[34] N. J. Navimipour and S. Asghari, “Cloud service composition using an inverted ant colony optimisation algorithm,” Int. J. Bio-Inspired Comput., vol. 13, no. 4, p. 257, 2019.
[35] A. Alamri, “Nature-inspired multimedia service composition in a media cloud-based healthcare environment,” Cluster Comput., vol. 19, no. 4, pp. 2251–2260, Dec. 2016.
[36] X. Xu, Z. Liu, Z. Wang, Q. Z. Sheng, J. Yu, and X. Wang, “S-ABC: A paradigm of service domain-oriented artificial bee colony algorithms for service selection and composition,” Futur. Gener. Comput. Syst., vol. 68, pp. 304–319, Mar. 2017.
[37] J. Zhou and X. Yao, “DE-caABC: differential evolution enhanced context-aware artificial bee colony algorithm for service composition and optimal selection in cloud manufacturing,” Int. J. Adv. Manuf. Technol., vol. 90, no. 1–4, pp. 1085–1103, Apr. 2017.
[38] J. Zhou and X. Yao, “Multi-population parallel self-adaptive differential artificial bee colony algorithm with application in large-scale service composition for cloud manufacturing,” Appl. Soft Comput., vol. 56, pp. 379–397, Jul. 2017.
[39] D. Wang, Y. Yang, and Z. Mi, “A genetic-based approach to web service composition in geo-distributed cloud environment,”
Comput. Electr. Eng., vol. 43, pp. 129–141, Apr. 2015.
[40] H. Jin, X. Yao, and Y. Chen, “Correlation-aware QoS modeling and manufacturing cloud service composition,” J. Intell. Manuf., vol. 28, no. 8, pp. 1947–1960, Dec. 2017.
[41] Z.-Z. Liu, D.-H. Chu, Z.-P. Jia, J.-Q. Shen, and L. Wang, “Two-stage approach for reliable dynamic Web service composition,”
Knowledge-Based Syst., vol. 97, pp. 123–143, Apr. 2016. [42] N. Sasikaladevi and N. Sasikaladevi, “SLA based cloud service
composition using genetic algorithm,” Int. J. Adv. Intell. Informatics, vol. 2, no. 2, p. 77, Jul. 2016.
Service Composition,” Mob. Networks Appl., vol. 18, no. 1, pp. 116–121, Feb. 2013.
[44] A. Zhang, H. Sun, Z. Tang, and Y. Yuan, “Service composition based on discrete particle swarm optimization in military organization cloud cooperation,” J. Syst. Eng. Electron., vol. 27, no. 3, pp. 590–601, Jun. 2016.
[45] X. Hongzhen, L. Limin, X. Dehua, and L. Yanqin, “Evolution of service composition based on QoS under the cloud computing environment,” in 2016 IEEE International Conference of Online Analysis and Computing Science (ICOACS), 2016, pp. 66–69. [46] M. Ghobaei-Arani, A. A. Rahmanian, M. S. Aslanpour, and S. E.
Dashti, “CSA-WSC: cuckoo search algorithm for web service composition in cloud environments,” Soft Comput., vol. 22, no. 24, pp. 8353–8378, Dec. 2018.
[47] B. Xu and Z. Sun, “A fuzzy operator based bat algorithm for cloud service composition,” Int. J. Wirel. Mob. Comput., vol. 11, no. 1, p. 42, 2016.
[48] M. Torkashvan and H. Haghighi, “A greedy approach for service composition,” in 6th International Symposium on Telecommunications (IST), 2012.
[49] V. Gaur, P. Dhyani, and O. P. Rishi, “A Multi-Objective Optimization of Cloud Based SLA-Violation Prediction and Adaptation,” Int. J. Inf. Technol. Comput. Sci., vol. 8, no. 6, pp. 60–65, Jun. 2016.
[50] F. Seghir and A. Khababa, “A hybrid approach using genetic and fruit fly optimization algorithms for QoS-aware cloud service composition,” J. Intell. Manuf., vol. 29, no. 8, pp. 1773–1792, Dec. 2018.
[51] M. S. Azari, A. Bouyer, and N. F. Zadeh, “Service composition with knowledge of quality in the cloud environment using the cuckoo optimization and artificial bee colony algorithms,” in
2015 2nd International Conference on Knowledge-Based Engineering and Innovation (KBEI), 2015, pp. 539–545.
Zahra Nazari received her B.S. degree in Computer Software
Engineering from Sharif
University of Technology, Tehran, Iran in 2016 and her M.Sc. degree
in Computer Engineering
(Algorithms and Computation) from University of Tehran, Tehran, Iran in 2019. Her research interests include IoT, Cloud Computing, Graph Algorithms.
Ali Kamandi received his B.S. and M.Sc. in Computer Software Engineering from Sharif University of Technology, Tehran, Iran; the Ph.D. in Software Engineering, from Sharif University of Technology, Tehran, Iran in 2010. He is an assistance professor in the Department of Engineering Science at University of Tehran. He has published more than 25 papers in various journals and conference proceeding. His research interests include Data Science, Software Engineering, eCommerce and Distributed Systems.