R E S E A R C H
Open Access
Supervised redundant feature detection for
tumor classification
Xue-Qiang Zeng
1,3†, Guo-Zheng Li
2*From
IEEE International Conference on Bioinformatics and Biomedicine (BIBM 2013)
Shanghai, China. 18-21 December 2013
Abstract
Background:As a high dimensional problem, analysis of microarray data sets is a challenging task, where many weakly relevant or redundant features affect overall performance of classifiers.
Methods:The previous works used redundant feature detection methods to select discriminative compact gene set, which only considered the relationship among features, not the redundancy of classification ability among features. This study propose a novel algorithm named RESI (Redundant fEature Selection depending on Instance), which considers label information in the measure of feature subset redundancy.
Results:Experimental results on benchmark data sets show that RESI performs better than the previous state-of-the-art algorithms on redundant feature selection methods like mRMR.
Conclusions:We propose an effective supervised redundant feature detection method for tumor classification.
Background
Rapid advances in gene expression microarray technology enable simultaneous measurement of the expression levels for thousands or tens of thousands of genes in a single experiment. Analysis of microarray data presents unprecedented opportunities and challenges for data mining in areas such as gene clustering, class discovery, and tumor classification [1]. A typical data set may con-tain thousands of genes but only a small number of sam-ples (often less than a hundred). The number of samsam-ples is likely to remain small at least for the near future due to the expense of collecting microarray samples [2]. The nature of relatively high dimensionality but small sample size in microarray data causes the known problem of “curse of dimensionality”. Therefore, selecting a small number of discriminative ones from thousands of genes is essential for successful sample classification [3-5].
Feature selection, a process of choosing a subset of fea-tures from the original, is frequently used as a preproces-sing technique in data mining. It has been proved effective
in reducing dimensionality, improving mining efficiency, increasing mining accuracy, and enhancing result compre-hensibility [6-9]. The goal of the feature selection algo-rithm is to select the minimum set of features that are strongly related to the desired decision variable and have the least redundancy among them [10,11]. Existing effi-cient feature selection algorithms (feature ranking meth-ods) usually assume feature independence, and assign a discriminative score to each feature. Because the interac-tions and correlainterac-tions among features are not considered, these algorithms fail to remove redundant features completely.
Hall [12] pointed out that the prediction capability and the inter-correlation of feature subset are two important aspects in feature selection. However, the optimal feature selection requires an exponentially large search space (O(2m), wheremis the number of features) [10]. In prac-tise, researchers often resort to various approximations to determine the optimal feature subset. The prediction cap-ability is usually estimated by the interrelation of indivi-dual feature with the target. For the issue of redundancy, many researchers attempt to explicitly address feature interactions by finding some low-order interactions,i.e. †Contributed equally
2
Department of Control Science & Engineering, Tongji University, 4800 Cao An Road, Shanghai, 201804, China
Full list of author information is available at the end of the article
2-way (one feature and the label) and 3-way (two features and the label) interactions.
In recent years, researchers have proposed many techni-ques to eliminate redundant features according to the above principle. Battiti proposed the Mutual Information based Feature Selection (MIFS) method [13], and then improved versions like MIFS-U [14] and mMIFS-U [15] were proposed. Hall proposed the Correlation-based Fea-ture Selection (CFS) method [12], Ding and Peng pro-posed the minimum Redundancy-Maximum Relevance (mRMR) method [16], Bontempi and Meyer proposed a Causal filter selection method, called min-Interaction Max-Relevance (mIMR) [17], Fleuret used the Conditional Mutual Information Maximization (CMIM) to select fea-ture [18]. These methods consider the problem of feafea-ture selection from different motivations and various solutions have been proposed. But the same point is that they are trying to find the optimal discriminative feature subset by considering to remove feature redundancy, where feature redundancy is computed by various pair-wise similarity measures,i.e. mutual information or conditional mutual information.
However, the used traditional pair-wise similarity metrics only consider the numerical values of given vari-ables, but not the similarity of discriminative ability among them. Therefore, feature redundancy can not be measured correctly in terms of feature prediction ability by existing methods. How to measure feature (subset) redundancy is a fundamental problem, which should be reconsidered in the field of feature selection. In the appli-cation of classifiappli-cation, we consider a feature redundant only when its predictive power is redundant, not that its numerical value is similar with some selected features. Because two highly similar features are obviously not redundant to each other when the minor difference hap-pen to be critical to the classification. In this paper, we proposed a novel method to measure feature (subset) redundancy by comparing features’predictive powers directly. Feature’s prediction power is recorded by its instances’distribution explicitly, which includes clear-dis-cerned instances and blur-disclear-dis-cerned instances. Based on the predictive power distributions, a new feature redun-dancy metric is defined on the ground of comparing pre-dictive powers. Furthermore, we proposed a novel algorithm named RESI (Redundant fEature Selection depending on Instance). Experiments on several bench-mark microarray data sets demonstrate the outstanding performance of our proposed method.
Methods
Supervised redundant feature detection
Given a data set (X = [X1, X2, . . . , Xm], Y) with n
instances represented by m features (genes), whereX andYare instances matrix and class label respectively.
The task of classification is to tag instances with a label in low probability of error. Theoretically, having more features implies more discriminative power in classifica-tion. However, many features are relevant to each other and they have no contribution to classification, except to degrade performance of classifiers [19]. Thus, it is necessary to remove irrelevant and redundant features as more as possible, without losing information greatly. Generally, the task of feature selection in classification issue is formally defined as the process of selecting the optimal feature subsetS ⊆X to have high classification performance.
Thus, qualities of relevant and non-redundant fea-tures of the selected subset are two key points consid-ered in feature selection methods. In existing methods, predictive power of a feature subset has often been divided into computation of the interrelation score of individual features with the label. Due to computa-tional limitation in high dimensional feature space, redundancy degree of a feature subset is usually esti-mated by pair-wise similarity measures, i.e. mutual information or conditional mutual information of two given variables.
However, to measure the feature subset redundancy is a fundamental problem, which should be reconsidered in the field of feature selection. Without including learning model (i.e. wrapper methods), measuring the redundancy degree of a feature subset as a whole is impractical. So, approximately measuring individual pair-wise feature simi-larity is a reasonable way which has been adopted by var-ious existing methods. But, the prevvar-ious pair-wise similarity measures only consider the numerical values of given features, but not the discriminative ability among them. Therefore, feature redundancy is not measured cor-rectly. For instance, two highly similar features are usually considered as redundant to each other by the previous pair-wise similarity measures. But this is not correct when the minor difference of the two features happens to be cri-tical to the classification.
In the context of classification, it is reasonable to address the feature set redundancy from the view of predictive power. So, we define the pair-wise feature redundancy as follow.
Theorem 1In the context of classification, a feature Xp
is redundant to a given feature Xqif its predictive power
to label Y has already been expressed by feature Xq.
As argued in Theorem 1, the similarity should be mea-sured by comparing the distribution of predictive power between two features. Thus, the predictive power needs to be measured in a comparable way. More concretely, we need to record those instances which are clear-discerned by the given feature and which are not.
Theorem 2Given a feature Xp, an instance Xuis
instances on feature Xphave the same class labels with
that of Xu.
The intuitive idea of Theorem 2 is inspired from thek Nearest Neighbor (kNN) classifier. We believe that The-orem 2 holds true no matter which classification model is applied finally. Based on the idea in Theorem 2, we define the neighborhood pUrity of instance Xu on a given featureXpas below,
U(Xup|Y) =
Xv∈N
k(Xup) δ (Y
v ==Yu)
k , (1)
whereδ(·) is the Kronecker delta functioni.e.δ(·) = 1 whenYv==Yuis true, otherwiseδ(·) = 0,Yuis the target label of instanceXu, Xupis the value of instanceXuon fea-tureXp, Nk(Xpu) is the neighborhood ofXudefined by the
kclosest instancesXvon featureXp(Xvpis close toXpu),kis a predefined parameters. Equation 1 measures how many instance labels are the same in the neighborhood ofXuvia featureXp.
The value ofU(Xup|Y)varies from 0 to 1. HighU(Xup|Y) means the corresponding instance has more neighbors with the same class. An instance is defined as clear-dis-cerned when itsU(Xpu|Y)is higher than a given thresh-oldµ, i.e.U(Xp|vY)> μ, otherwise it is blur-discerned.
By Equation 1, each feature’s predictive power is recorded as a distribution of instances,i.e. the clear-dis-cerned instances and the blur-disclear-dis-cerned instances. Then, redundancy of two given feature can be measured by comparing the corresponding instance distributions directly. We define the REdundancy Measure depending on Instances (REMI) of feature Xq to featureXpunder
labelYas follows.
REMI(Xp;Xq|Y) =
n
u=1δ(U(Xup|Y)≤μ&U(Xuq|Y)≤μ) n
u=1δ(U(Xup|Y)≤μ)
(2)
The numerator of Equation 2 gives the count of instances which are blur-discerned on both featureXp
and feature Xq, the denominator is the blur-discerned
instances which count on feature Xp. The value of
REMI(Xp; Xq|Y) varies from 0 to 1. It is 0, when all blur-discerned instances on feature Xp are clear-discerned on feature Xq, which means the predictive power ofXqis completely complementary to that of Xp and we consider their corresponding redundancy is zero. The value is 1 when no blur-discerned instance on featureXpis clear-discerned on featureXq, which means
Xqhas no predictive power contribution toXp, i.e. Xqis
redundant to Xp.
As to measure the predictive power of selected fea-tures, we use the metric of t-statistic. For binary classi-fication, the definition of t-statistic on a feature p is given as:
t(p|Y) = p¯ 1− ¯p2
var1/n1+var2/n2 (3)
wherep¯1, n1 andvar1 are the mean value of features, the number of examples and variance of one class, p¯2,
n2
and var2 have the similar meaning for the other class. The meaning of t-statistic value is intuitive, which measures the weighted distance between the centroid of one class and the other class on the feature p. It is usually believed that the value of t(p|Y) largely repre-sents the discriminative power of the giving feature, higher absolute score means greater discriminative power. A feature is usually regarded as irrelevant when its t-statistic value is trivial. The t-statistic measure has demonstrated as an effective feature selection method and widely used in the field of bioinformatics [20].
In total, we define the merit function of REMI as:
JREMI(Xp|S,Y) = abs(t(Xp|Y))− 1
p−1 p−1
i=1
REMI(Xp;Xi|Y)(4)
which denotes the merit score of candidate feature Xp
given the selected featuresS(S=X1:p−1) and the labelY.
Furthermore, we propose a novel algorithm named RESI (Redundant fEature Selection depending on Instance), which combines REMI with the sequential forward search strategy. The detail algorithm is described as in Algorithm 1.
Algorithm 1The RESI Algorithm
Input:Feature setX = [X1,X2, . . . ,Xm]
Target labelY
Output:Selected feature subsetS
1:F⇐X; 2:S⇐ Ø;
3:for all featureXiinFdo
4: ifabs(t(Xi|Y)) <∈then
5: F⇐F \ Xi;
6: end if 7: end for
8:Xp⇐argmaxXp∈Fabs(t(Xp|Y));
9:S⇐ S∪Xp; 10:F⇐ F \ Xp;
11: whilepre-defined stopping criteria is not satified do
12: Xp⇐argmaxXp∈FJREMI(Xp|S,Y);
13: S⇐ S∪Xp;
14: F⇐F \ Xp;
15:end while
values are trivali.e. abs(t(Xi|Y)) <∈, are removed from the
candidate set. Then, the most discriminative features with the highest abs(t(Xp|Y)) are selected. In the stage of
redundant feature elimination, RESI starts with the cur-rent selected subset, and adds one important feature at a time. Given a selected feature subset ofp−1 featuresS, a new featureXpis chosen from the rest of the feature sub-setX \ Sby evaluating the merit functionJREMI(Xp|S, Y). It will be terminated when pre-defined stopping criteria is satisfied. For example, the number of selected features is larger than a threshold or the score ofJREMI(Xp|S, Y) is trivial.
In our experiments, the parameter∈= 0.1, the num-ber of neighborhood instancesk = 3, the threshold of clear-discerned instanceµ= 0.66.
Related works on redundant feature detection
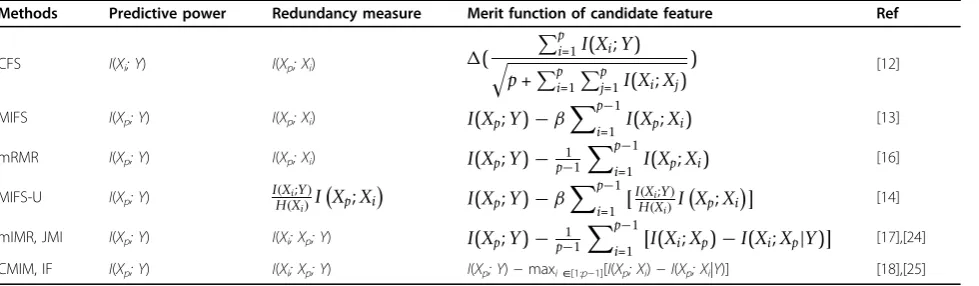
As we mentioned in Section Introduction, the predictive power and the inner redundancy of the selected feature subset are two key points in feature selection methods. In recent years, researchers have proposed various fea-ture selection methods [21-23], most of which are explained from the two aspects. Here, we give a short review on related feature selection methods using for-ward feature selection scheme. These methods are briefly described in Table 1.
Hall proposed the Correlation-based Feature Selection (CFS) method [12], where some correlation measures are used to evaluate the goodness of a subset by consid-ering the individual predictive ability of each feature and the degree of correlation between them. The symmetri-cal uncertainty (a normalized version of mutual infor-mation), for discrete data, and the standard linear correlation, for continuous data, are used by Hall to measureI(Xi; Y) andI(Xi; Xj).
Ding and Peng proposed the minimum Redundancy-Maximum Relevance (mRMR) method in 2005 [16], which requires that selected discriminative features are maximally dissimilar to each other. mRMR is almost as
the same as the MIFS method [13], except that the parameter b is set as p−11 in mRMR. Both MIFS and mRMR use mutual information to measureI(Xi; Y) and
I(Xi; Xj). Kwak and Choi proposed an improvement to MIFS, called MIFS-U [14], which uses a re-weighted mutual information I(Xi;Y)
H(Xi)I
Xp;Xi
to measure the fea-ture redundancy. Without explicit claim,I(·;· ) is mea-sured by the mutual information in the rest of paper.
Bontempi and Meyer proposed a causal filter selection method, called min-Interaction Max-Relevance (mIMR) [17]. Bontempi and Meyer try to maximize the mutual information between X1:p and Y directly. Due to the
number of the subset ofX1:pisO(2p), it is impractical to
compute I(X1:p; Y) in a precise way. Only low-order
interactions are considered in the approximate solution given by mIMR. And in the final solution, the merit function of mIMR can also be divided into two parts: predictive power and feature set redundancy. Obviously, the difference between mRMR and mIMR is the two-way mutual information I(Xi; Xp) is replaced by the three-way mutual informationI(Xi; Xp; Y), and I(Xi; Xp;
Y) =I(Xp; Xi)−I(Xp; Xi|Y).
Fleuret used the Conditional Mutual Information Maximization (CMIM) to select feature [18], which examines the information between a feature and the tar-get, conditioned on each current feature. It is clear that CMIM is very similar with mIMR. The only difference is the sum function is replaced by the maximum func-tion to measure the feature redundancy.
Yang and Moody proposed using Joint Mutual Infor-mation (JMI) to select feature [24], which tries to
maxi-mize joint mutual informationp−1 i=1 I
Xp,Xi;Y
. This is
the information between the targets and a joint random variable, defined by pairing the candidateXpwith each current selected feature. But after deduction, the merit function of JMI is exactly equivalent to that of mIMR.
Vidal-Naquet and Ullman proposed another criterion used for computer vision, which is refereed as Informative
Table 1 Related feature selection methods
Methods Predictive power Redundancy measure Merit function of candidate feature Ref
CFS I(Xi; Y) I(Xp; Xi) (
p
i=1I(Xi;Y)
p+pi=1pj=1I(Xi;Xj)
) [12]
MIFS I(Xp; Y) I(Xp; Xi) I(Xp;Y)−βp−1
i=1 I(Xp;Xi)
[13]
mRMR I(Xp; Y) I(Xp; Xi) I(Xp;Y)− 1
p−1 p−1
i=1 I(Xp;Xi) [16]
MIFS-U I(Xp; Y) I(Xi;Y)
H(Xi)I
Xp;Xi
I(Xp;Y)−β
p−1 i=1 [
I(Xi;Y)
H(Xi)I
Xp;Xi
] [14]
mIMR, JMI I(Xp; Y) I(Xi; Xp; Y) I(Xp;Y)− 1
p−1 p−1
Fragments (IF) [25]. The authors motivate the criterion mini∈[1:p−1][I(Xp, Xi; Y)−I(Xi; Y)] by noting that it
mea-sures the predictive ability gain of combining a new fea-tureXpwith each existing featureXi, over simply usingXi
by itself. TheXiwith the least“gain”from being paired
withXpis taken as the score forXp. Interestingly, using the chain ruleI(Xp, Xi; Y) =I(Xi; Y) +I(Xp; Y|Xi), therefore IF is equivalent to CMIM.
From the short review, we can easily find the common point of these methods. Although the motivations are var-ious, the merit functions of all these methods are divided into two parts: predictive power and feature redundancy. And due to the practical limitation, one certain pair-wise similarity measure is adopted to compute the predictive power and feature redundancy. However, the traditional pair-wise similarity measures,i.e. mutual information or conditional mutual information, only consider the numerical values of given variables, but not the the similarity of discri-minative ability between them. Therefore, feature redun-dancy can not be measured correctly in existing methods.
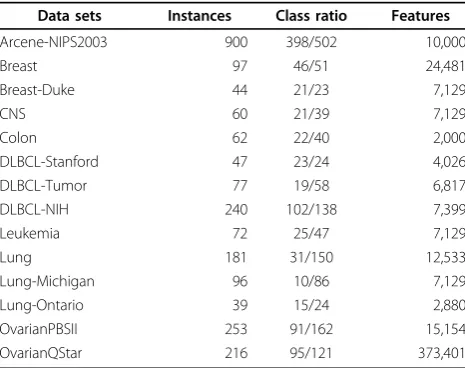
Data sets
There are fourteen data sets used in our study, which are listed in Table 2. The data set of Arcene-NIPS2003 is gath-ered from the NIPS’03 feature selection competition [26], Breast-Duke is reported by West [27], all other data sets are downloaded from the Kent Ridge Bio-medical Dataset [28]. All these data sets have relative big feature/instance ratio, and the feature numbers are no less than 2,000. For the missing values in some existing data sets, they are replaced by the corresponding means. For the data set of OvarianQStar, only the first 373,401 features are used.
Experimental settings
We use the stratified 10-fold cross-validation procedure, where each data set is split into ten subsets of equal
size. Each subset is used as test set once, and the corre-sponding left subsets are combined together and used as training set. Within each cross-validation fold, the gene expression data are standardized. The expressions of the training set are transformed to zero mean and unit stan-dard deviation across samples, and the test set are trans-formed according to the means and standard deviations of the corresponding training set. The Irani’s MDL method is applied when discretization is required [29]. The 10-fold cross-validation is repeated 10 times, which is also denoted as the 10 × 10 cross-validation measur-ing procedure.
We should note that the 10 × 10 cross-validation mea-suring procedure is more reliable than the randomized re-sampling testing strategy and the leave-one-out cross-validation due to the correlations between the test and training sets, some detailed discussions can be found at [30] Even in the small sample problem like gene expres-sion data, 10 × 10 cross-validation is still one of the most reliable measuring way [31].
The final classification performance is recorded by the Balanced ACCuracy (BACC), which is defined as follows.
BAAC= 1 2
sensitivity+specificity
= 1 2
TP TP+FN+
TN TN+FP
(5)
where TP, TN, FP, and FN, stand for the number of true positive, true negative, false positive, and false nega-tive samples, respecnega-tively. Without explicit clarification, all the scores are averaged on 10 × 10 cross-validation.
To make conclusions sound, six widely used classifiers are used, including Support Vector Machine (SVM) with linear kernel andc= 1, non-linear support vector machine using Sequential Minimal Optimization (SMO) and polynomial kernel,kNearest Neighbor (kNN) with
k= 3, Logistic Regression (LR), Naïve Bayes classifier (NB) and decision tree with J48 algorithm (J48). All these classifiers are trained on the training set to predict the label of the test samples on the same cross-validation partition.
The algorithms are implemented in JAVA language based on WEKA [32], and carried out on a DELL PC workstation with 24 × X5680 3.33GHz CPU and 64G RAM.
Results and discussion
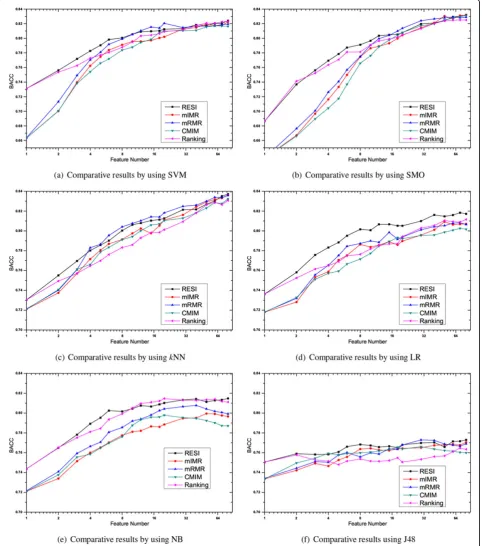
In order to examine the performance of our proposed method, three state-of-the-art feature selection methods, mIMR, mRMR and CMIM, are used to compare with RESI. Additional, a feature Ranking method using absolute t-statistic score is also used as baseline. The parameter of selected feature number has great influence on the
Table 2 Experimental data sets
Data sets Instances Class ratio Features
Arcene-NIPS2003 900 398/502 10,000
Breast 97 46/51 24,481
Breast-Duke 44 21/23 7,129
CNS 60 21/39 7,129
Colon 62 22/40 2,000
DLBCL-Stanford 47 23/24 4,026
DLBCL-Tumor 77 19/58 6,817
DLBCL-NIH 240 102/138 7,399
Leukemia 72 25/47 7,129
Lung 181 31/150 12,533
Lung-Michigan 96 10/86 7,129
Lung-Ontario 39 15/24 2,880
OvarianPBSII 253 91/162 15,154
performance comparison. We vary the selected dimension from 1 to 80, which are 1, 2, 3, 4, 5, 6, 8, 10, 12, 15, 18, 20, 30, 40, 50, 60, 70 and 80 in detail. Higher dimension is not included because the number of relevant genes (whoseI (Xi; Y) > 0) is limited on some data sets. On each data set
and each selected feature dimension, six widely used classi-fiersi.e. SVM, SMO, LG,kNN, NB and J48 are applied to examine the performances with the procedure of 10 × 10 cross-validation. The detailed comparative BACC results withkNN classifier are plotted in Figure 1. Due to the length limitation of the paper, only results on four repre-sentative data sets, including the data set of Breast, Colon, Leukemia and Lung, are included in Figure 1, which are widely used by previous researchers [16,17]. The compara-tive BACC results averaged on all fourteen data sets are plotted in Figure 2. Note, the abscissas of Figure 1 and Figure 2 use the Log coordinate and the Log base is 2.
From Figure 1 and Figure 2, it’s clear there is no method has overwhelming performance over all classi-fiers, although the plotted lines in Figure 2 fluctuate
much more gently than the drawings on individual data set. However, our RESI is relatively the best one among all the feature selection methods. This is especially obvious by using the classifier of LR, and we will demonstrate the point by t-test later.
The performances of mIMR, mRMR and CMIM are often tied, and mRMR is the best one in most cases. We suggest it’s because all these methods use mutual infor-mation to represent the predictive power, and the tradi-tional mutual information of mRMR is the most robust one to estimate feature redundancy in our experiments.
It’s also interesting to find that the performances of RESI and Ranking are obviously better than that of others, when the selected dimension is small,i.e. below 5. This is true with almost all classifiers. We believe the superiority is caused by the difference of two metrics, mutual informa-tion and the absolute t-statistic, used to represent the pre-dictive power. The absolute t-statistic measures the weighted distance between the centroid of two classes, which is directly related to the discriminative power of the
giving feature. On the contrary, mutual information repre-sents the general information between two variables. So from our experimental results, the absolute t-statistic per-forms better than mutual information to represent the predictive power.
Investigating the difference between RESI and Rank-ing, we find that their performances are similar when the selected dimension is small. This is because the absolute t-statistic is used to represent the predictive power by both of them. And when only a few features
are selected, the influence of feature redundancy is not obvious. But as the selected dimension grows, the impact of feature redundancy becomes more and more critical to the BACC performance. Eliminating redun-dant features is meaningful when the feature dimension is not small, which is coincided with Figure 2, where RESI is much better than Ranking when the dimension grows.
Paired two-side t-test is also used to examine the differ-ences between those methods. The corresponding t-test results are showed in Table 3. Each cell (W/T/L) in Table 3 summarizes over all data sets and classifiers the wins/ties/ losses in BACC (at the significance level of 0.05) comparing various feature selection methods each other. The last col-umn of Table 3 gives the overall W/T/L values summarized on corresponding compared methods. From Table 3, it’s clear that RESI is the best feature selection method.
Conclusions
Redundant feature selection is an important topic in the field of bioinformatics. Here, we propose a novel redun-dant feature subset measure REMI by comparing feature predictive powers directly, which is recorded by its instance distribution explicitly including clear-discerned instances and blur-discerned instances. Furthermore, a novel feature selection method RESI based on REMI was proposed. Experimental results on benchmark microarray data sets demonstrate that RESI performs better than the state-of-the-art algorithms like mRMR on fourteen bench-mark data sets.
Future works include improving its efficiency and applying it to more scientific fields.
Competing interests
The authors declare that they have no competing interests.
Authors’contributions
All authors read and approved the final manuscript. GZL proposed the algorithm and wrote this paper. XQZ jointly proposed the paper idea, collected the data, implemented the computation on the datasets and checked the manuscript.
Acknowledgements
This work was supported by the Natural Science Foundation of China under grant nos. 61105053, 61273305 and 61463033, the Nature Science Foundation of Jiangxi Province under grant no. 20132BAB201043, and China Postdoctoral Science Foundation under grant no. 2013M541540.
Declarations
Funding for open access charge: Natural Science Foundation of China. This article has been published as part ofBMC Medical GenomicsVolume 7 Supplement 2, 2014: IEEE International Conference on Bioinformatics and Biomedicine (BIBM 2013): Bioinformatics in Medical Genomics. The full contents of the supplement are available online at http://www. biomedcentral.com/bmcmedgenomics/supplements/7/S2.
Authors’details
1
Computer Center, Nanchang University, 999 Xuefu Road, Nanchang, 330029, China.2Department of Control Science & Engineering, Tongji University, 4800 Cao An Road, Shanghai, 201804, China.3The Key Laboratory of Embedded System & Service Computing, Tongji University, 4800 Cao An Road, Shanghai, 201804, China.
Published: 22 October 2014
References
1. Ge L, Du N, Zhang A:Finding informative genes from multiple microarray experiments: A graph-based consensus maximization model.
Bioinformatics and Biomedicine (BIBM), 2011 IEEE International Conference on
2011, 506-511.
2. Dougherty ER:Small sample issue for microarray-based classification.
Comparative and Functional Genomics2001,2:28-34.
3. Zheng S, Liu W:Selecting informative genes by lasso and dantzig selector for linear classifiers.Bioinformatics and Biomedicine (BIBM), 2010 IEEE International Conference on2010, 677-680.
4. Zeng XQ, Li GZ:Incremental partial least squares analysis of big streaming data.Pattern Recognition2014,47(11):3726-3735. 5. You M, Li GZ:Feature selection for multi-class problems by using
pairwise-class and all-class techniques.International Journal of General Systems2011,40(4):381-394.
6. Li GZ, Meng HH, Yang MQ, Yang JY:Combining support vector regression with feature selection for multivariate calibration.Neural Computing and Applications2009,18(7):813-820.
7. Shao H, Li G, Liu G, Wang Y:Symptom selection for multi-label data of inquiry diagnosis in traditional chinese medicine.Science China Information Sciences2013,56(5):1-13.
8. Li GZ, Sun S, You M, Wang YL, Liu GP:Inquiry diagnosis of coronary heart disease in chinese medicine based on symptom-syndrome interactions.
Chinese Medicine2012,7(1):9.
9. You M, Liu J, Li GZ, Chen Y:Embedded feature selection for multi-label classification of music emotions.International Journal of Computational Intelligence Systems2012,5(4):668-678.
10. Guyon I, Elisseeff A:An introduction to variable and feature selection.The Journal of Machine Learning Research2003,3:1157-1182.
11. Zeng XQ, Li GZ, Yang JY, Yang MQ, Wu GF:Dimension reduction with redundant gene elimination for tumor classification.BMC Bioinformatics
2008,9(Suppl 6):8.
12. Hall MA:Correlation-based feature selection for discrete and numeric class machine learning.Proceedings of the 2000 International Conference on Machine Learning (ICML’00)2000, 359-366.
13. Battiti R:Using mutual information for selecting features in supervised neural net learning.IEEE Transactions on Neural Networks1994,5(4):537-550. 14. Kwak N, Choi CH:Input feature selection for classification problems.IEEE
Transactions on Neural Networks2002,13(1):143-159.
15. Novovičová J, Somol P, Haindl M, Pudil P:Conditional mutual information based feature selection for classification task.InProgress in Pattern Recognition, Image Analysis and Applications. Volume 4756.Springer; 2007:417-426. 16. Peng H, Long F, Ding C:Feature selection based on mutual information
criteria of max-dependency, max-relevance, and min-redundancy.IEEE Transactions on Pattern Analysis and Machine Intelligence2005, 27(8):1226-1238.
17. Bontempi G, Meyer P:Causal filter selection in microarray data.
Proceedings of the 2010 International Conference on Machine Learning (ICML’10)2010, 95-102.
18. Fleuret F:Fast binary feature selection with conditional mutual information.The Journal of Machine Learning Research2004,5:1531-1555. 19. Zeng XQ, Li GZ:Dimension reduction for p53 protein recognition by
using incremental partial least squares.IEEE Transactions on NanoBioscience2014,13(2):73-79.
Table 3 Comparative t-test results (wins/ties/losses) summarized on data sets and classifiers
mIMR mRMR CMIM Ranking Total
RESI 40-33-11 36-37-11 41-33-10 31-36-17 148-139-49 mIMR - 9-42-33 31-28-25 20-30-34 71-133-132
mRMR - 36-36-12 23-32-29 103-147-86
CMIM - 18-27-39 65-124-147
20. Liu H, Li J, Wong L:A comparative study on feature selection and classification methods using gene expression profiles and proteomic patterns.Genome informatics2002,13:51-60.
21. Brown G:A new perspective for information theoretic feature selection.
Proceedings of the 2009 International Conference on Artificial Intelligence and Statistics (ICAIS’09)2009,5:49-56.
22. Liu H, Liu L, Zhang H:Feature selection using mutual information: An experimental study.Proceedings of the 2008 Pacific Rim International Conference on Artificial Intelligence (PRICAI’08)2008, 235-246. 23. Bolón-Canedo V, Sánchez-Maroño N, Alonso-Betanzos A:A review of
feature selection methods on synthetic data.Knowledge and Information Systems2013,34(3):483-519.
24. Yang HH, Moody J:Data visualization and feature selection: New algorithms for nongaussian data.Advances in Neural Information Processing Systems1999,12:687-693.
25. Vidal-Naquet M, Ullman S:Object recognition with informative features and linear classification.Proceedings of the 2003 IEEE International Conference on Computer Vision (ICCV’03)2003, 281-288.
26. Guyon I, Li J, Mader T, Pletscher PA, Schneider G, Uhr M:Competitive baseline methods set new standards for the NIPS 2003 feature selection benchmark.Pattern Recognition Letters2007,28(12):1438-1444.
27. West M, Blanchette C, Dressman H, Huang E, Ishida S, Spang R, Zuzan H, Olson JA Jr, Marks JR, Nevins JR:Predicting the clinical status of human breast cancer by using gene expression profiles.Proceedings of the 2001 National Academy of Sciences2001, 11462-11467.
28. Li J, Liu H, Wong L:Mean-entropy discretized features are effective for classifying high-dimensional biomedical data.Proceedings of the 3rd ACM SIGKDD Workshop on Data Mining2003, 17-24.
29. Fayyad U, Irani K:Multi-interval discretization of continuous-valued attributes for classification learning.Proceedings of the 1993 International Joint Conference on Articial Intelligence (IJCAI’93)1993, 1022-1027. 30. Dietterich TG:Approximate statistical tests for comparing supervised
classification learning algorithms.Neural Computation1998,10:1895-1923. 31. Molinaro AM, Simon R, Pfeiffer RM:Prediction error estimation: a
comparison of resampling methods.Bioinformatics2005,21(15):3301-3307. 32. Witten IH, Frank E:Data Mining: Practical Machine Learning Tools and
Techniques.Morgan Kaufmann Publishers Inc., San Francisco;, 2.
doi:10.1186/1755-8794-7-S2-S5
Cite this article as:Zeng and Li:Supervised redundant feature detection for tumor classification.BMC Medical Genomics20147(Suppl 2):S5.
Submit your next manuscript to BioMed Central and take full advantage of:
• Convenient online submission
• Thorough peer review
• No space constraints or color figure charges
• Immediate publication on acceptance
• Inclusion in PubMed, CAS, Scopus and Google Scholar
• Research which is freely available for redistribution