Copyright © 2012 IJECCE, All right reserved
Performance Evaluation of Congestion Control Scheme
in Distributed Multimedia Streaming
P.Chakradhar
ICT, SASTRA UniversityThanjavur, India E-mail: [email protected]
P. Pavan Kumar
FST, IFHE University Hyderabad, IndiaE-mail: [email protected]
P. R. Vijaya Kumar
FST, IFHE UniversityHyderabad, India E-mail: [email protected]
Abstract—performance evaluation of multimedia (Video) streaming over distributed networks has motivated efforts across several research communities. This leads to the development of various congestion control schemes. In Distributed multimedia (Video) streaming, the important questions to answer would be, will the congestion control scheme is TCP-friendly? And will it control the selfish users from dedicated bandwidth sharing? In this paper we analyze the performance of DMSCC (Distributed Multimedia (Video) Streaming Congestion Control), a congestion control scheme. In order to evaluate we use, Network Simulator (version 2), widely known as NS2, which is an event driven simulation tool that has proved useful in studying the dynamic nature of congestion control in Distributed Multimedia(Video) Streaming .
Keywords — Congestioncontrol; NS2; DMSCC; TCP-friendly; Distributed multimedia streaming
I. I
NTRODUCTIONDistributed multimedia streaming, which uses multiple senders to collaboratively and simultaneously stream media content to a receiver [2], poses new challenges in congestion control [1]. In media-on-demand services, media content can be mirrored by different CDN(Content Distribution Network) servers, a CDN can improve access to the data it caches by increasing access bandwidth and redundancy and reducing access latency. Data content types often cached in CDNs include web objects, downloadable objects (media files), applications, live streaming media [3], and database queries. The capacity sum of strategically placed servers can be higher than the network backbone capacity. This can result in an impressive increase in the number of concurrent users. For instance, when there is a 10 Gbit/s network backbone and 200 Gbit/s central server capacity, only 10 Gbit/s can be delivered. But when 10 servers are moved to 10 edge locations, total capacity can be 10×10 Gbit/s. a client can stream concurrently from these servers. In peer-to-peer file sharing applications, a receiver can stream from multiple peers that seed the same media file.
Improving robustness, aggregation of bandwidth among peers are two advantages in concurrent streaming of multiple senders.
A. Contribution
The key focus of this paper is to analyze the efficiency of DMSCC. We have made an attempt in studying the DMSCC with the help of Network Simulator.
The entire paper is organized as follows: Section II Background, Section III Problem dissertation, Section IV System specifications. Section V Simulation details, Section VI shows Results and Analysis, Section VII conclusion.
II. B
ACKGROUNDA distributed multimedia streaming session contains multiple media flows from different senders. These flows may or may not pass through the same bottleneck. Ensuring TCP-friendliness of each DMS flow is not sufficient: their combined throughput is larger than the other TCP flows on the same bottleneck [6]. This unfairness encourages abuse by selfish users by increasing the number of concurrent flows, a user can grab larger bandwidth share at the bottlenecks. We need a different type of congestion control–one that controls the aggregate throughput of the DMS flows such that their combined throughput is TCP-friendly [1]. We call such aggregate congestion control as task-level congestion control. Aggregate congestion control methods exist in the literature [7], but do not apply to distributed media streaming [4].
In distributed multimedia streaming [3], the flows from multiple senders converge on their way to the receiver, forming a reverse tree(see Fig.1.).The DMS flows only share parts of their links, so they may experience different delay and congestion. The existing methods of aggregate congestion control, however, assume that the flows traverse through the same path and share the same bottleneck [9, 11]. We now illustrate the problem of congestion control in distributed media streaming through an example). A host R requests for some media content from senders Si. DMS flows fi from the senders travel through different IP level paths and join each other at routers A and B. We term routers like A and B as aggregation points.
Fig.1. Reverse Tree Topology in Distributed Media Streaming
Copyright © 2012 IJECCE, All right reserved
System Specifications
Hardware Specifications Soft ware Specifications
Process or
Intel Core i3-2310M(3M Cache, 2.5 GHz) Operating System Ubuntu 10.04(Linu x Version)
RAM 1 GB
Techniques C++,TCL Hard
Disk 500 GB Compac
t Disk 650 MB
Simulator Network Simulator Version 2(NS2) Graphic Card 500MB (Intel,AMD) and identifies the location of congestion by correlating the
one-way delays between sender/receiver pairs.
III. P
ROBLEMD
ISSERTATIONThe existing system issues are rate allocation, allocation of packets and selection of senders. The existence of multiple senders has brought a new dimension to classic problems in multimedia streaming. Another fundamental issue in multimedia streaming, TCP-friendly congestion control is addressed in this paper.
Additive increase, multiplicative decrease (AIMD) algorithm, with carefully adjusted increasing factor, regulates the throughput of the DMS flows on a bottleneck and produces a TCP-friendly flow aggregate [7,8]. If there are k DMS flows on a bottleneck, they are regulated such that, in ideal situation, each flow consumes 1/k of the bandwidth of a TCP flow in a comparable network condition. As a result, the flow aggregate consumes as much as one TCP flow and is friendly to TCP. We use only TCP Reno in this paper, but the scheme is applicable to other versions of TCP. It improves robustness by exploiting path-diversity among the senders, the receiver experiences average loss and congestion behavior of the paths.
Careful selection of senders and allocation of packets to different senders lead to significant reduction in bursty loss. In peer-to-peer settings with transient peers, the receiver can still receive and play parts of the media stream when one of the sending peers fails [10]. A distributed media streaming session contains multiple media flows (called DMS flows) from different senders. These flows may or may not pass through the same bottleneck. DMSCC tracks packet losses at the receiver as an indication of congestion and identifies the location of congestion by correlating the one-way delays between sender/receiver pairs. If there are k DMS flows on a bottleneck, they are regulated such that, in ideal situation, each flow consumes 1/k of the bandwidth of a TCP flow in a comparable network condition. Our method to control the aggregate throughput of DMS flows might be useful in other context as well, including controlling the throughput of parallel TCP connections. It improves robustness by exploiting path-diversity among the senders, the receiver experiences average loss and congestion behavior of the paths. Careful selection of senders and allocation of packets to different senders lead to significant reduction in bursty loss. In peer-to-peer settings with transient peers, the receiver can still receive and play parts of the media stream when one of the sending peers fails.
IV. S
YSTEMS
PECIFICATIONSWe first clarify our assumptions. Initially, we assume that the paths among the receiver and senders form a reverse tree rooted at the receiver, and this topology is known by the receiver. later, we assume that DMS flows on the same bottleneck link experience similar loss rate. This assumption is reasonable when active queue management schemes such as RED are used. Subsequently, we focus on links with high multiplexing factors, where loss rate is decided by the background traffic rather than the DMS flows. Finally, we can reasonably assume that the
number of senders in a DMS session is typically small (less than 10).Thus, scaling DMSCC to large number of senders is not an issue.
TABLE.I : SYSTEMSPECIFICATIONS
V. S
IMULATIOND
ETAILSC++ is a general-purpose programming language. It is regarded as a middle-level language, as it comprises a combination of both high-level and low-level language features. It was developed by Bjarne Stroustrup in 1979 at Bell Labs as an enhancement to the C programming language and originally named "C with Classes". It was renamed to C++ in 1983. C++ is widely used in the software industry. Some of its application domains include systems software, device drivers, embedded software, high-performance server and client applications, and entertainment software such as video games. Several groups provide both free and commercial C++ compiler software, including the GNU Project, Microsoft, Intel, Borland and others.
The language began as enhancements to C, first adding classes, then virtual functions, operator overloading, multiple inheritance, templates, and exception handling among other features. After years of development, the C++ programming language standard was ratified in 1998 as ISO/IEC 14882:1998. The current standard is the 2003 version, ISO/IEC 14882:2003. The next standard version (known informally as C++0x) is in development.
C++ is a statically typed, free-form and multi-paradigm, compiled language where compilation creates machine code for target machine hardware. C++ standard consists of two parts: the core language and the C++ standard library; the latter includes most of the Standard Template Library (STL) which is modified version of the C standard library. Many C++ libraries exists which are not part of the standard, using linkage specification, libraries can even be written in languages such as C, Fortran, Pascal, or BASIC. Which of these are supported is compiler dependent.
Copyright © 2012 IJECCE, All right reserved the features of the library are accessed by using the
#include directive to include a standard header. C++ provides 69 standard headers, of which 19 are deprecated.
The STL was originally a third-party library from HP and later SGI, before its incorporation into the C++ standard. The standard does not refer to it as "STL", as it is merely a part of the standard library, but many people still use that term to distinguish it from the rest of the library (input/output streams, internationalization, diagnostics, the C library subset, etc.).Most C++ compilers provide an implementation of the C++ standard library, including the STL. Compiler-independent implementations of the STL, such as STLPort, also exist. Other projects also produce various custom implementations of the C++ standard library and the STL with various design goals. C++ provides more than 30 operators, covering basic arithmetic, bit manipulation, indirection, comparisons, logical operations and more. Almost all operators can be overloaded for user-defined types, with a few notable exceptions such as member access (. and.*). The rich set of overload operators is central to using C++ as a domain specific language. The overload operators are also an essential part of many advanced C++ programming techniques, such as smart pointers. Overloading an operator does not change the precedence of calculations involving the operator, nor does it change the number of operands that the operator uses (any operand may however be ignored).
C++ introduces object-oriented (OO) features to C. It offers classes, which provide the four features commonly present in OO (and some non-OO) languages: abstraction, encapsulation, inheritance, and polymorphism. Objects are instances of classes created at runtime. The class can be thought of as a template from which many different individual objects may be generated as program runs.
A. Network Simulator
NS2Simulator Notes and Documentation (N&D) could be called the "main manual" for ns(Network Simulator) and is available in Postscript format. An HTML version (currently without diagrams) of ns N&D (now renamed ns Manual) is available.
A manual page for ns is included in the distribution of ns directory. There is a HTML-ized version. There is a ps version of the nam user-manual
which is available from the nam page. ASCII version is also available.
A graph within a graph is an “inset”, not an
“insert”. The word “alternatively” is preferred to the word “alternately” (unless you really mean something that alternates).
If you can't get ns to compile, if it crashes, or if you have any other similar problems, take a look at the ns-problems page before you ask on the mailing list.
If you have any general questions about ns or nam, you can send them to the ns-users mailing list. If you're not sure if your question has been asked before, check the Archive for the mailing list.
B.
Starting ns
We can start ns with the command 'ns <tclscript>' (assuming that you are in the directory with the ns executable, or that your path points to that directory), where '<tclscript>' is the name of a Tcl script file which
defines the simulation scenario (i.e. the topology and the events). You could also just start ns without any arguments and enter the Tcl commands in the Tcl shell, but that is definitely less comfortable. For information on how to write your own Tcl scripts for ns.
Everything else depends on the Tcl script. The script might create some output on stdout, it might write a trace file or it might start nam to visualize the simulation, or all of the above.
C. Starting nam
We can either start nam with the command 'nam <nam-file>' where '<nam-<nam-file>' is the name of a nam trace file that was generated by ns, or you can execute it directly out of the Tcl simulation script for the simulation which you want to visualize.
D. Creating output files for XGRAPH
One part of the ns-allinone package is 'xgraph', a plotting program which can be used to create graphic representations of simulation results. In this section, an example show you a simple way how you can create output files in your Tcl scripts which can be used as data sets for xgraph. On the otherhand, it will also show you how to use traffic generators.
E. Topology and traffic sources
Initially, we create the following topology.
set n0 [$ns node] set n1 [$ns node] set n2 [$ns node] set n3 [$ns node] set n4 [$ns node]
$ns duplex-link $n0 $n3 1Mb 100ms DropTail $ns duplex-link $n1 $n3 1Mb 100ms DropTail $ns duplex-link $n2 $n3 1Mb 100ms DropTail $ns duplex-link $n3 $n4 1Mb 100ms DropTail
Fig.2. Topology
proc attach-expoo-traffic { node sink size burst idle rate } { #Get an instance of the simulator
set ns [Simulator instance]
#Create a UDP agent and attach it to the node set source [new Agent/UDP]
$ns attach-agent $node $source
#Create an Expoo traffic agent and set its configuration parameters
set traffic [new Application/Traffic/Exponential] $traffic set packetSize_ $size
$traffic set burst_time_ $burst $traffic set idle_time_ $idle $traffic set rate_ $rate
# Attach traffic source to the traffic generator $traffic attach-agent $source
#Connect the source and the sink $ns connect $source $sink return $traffic
Fig.3. Creating an Expoo traffic agent
Copyright © 2012 IJECCE, All right reserved The procedure creates a traffic source and attaches it to
the node, then it creates a Traffic/Expoo object, sets its configuration parameters and attaches it to the traffic source, before eventually the source and the sink are connected.
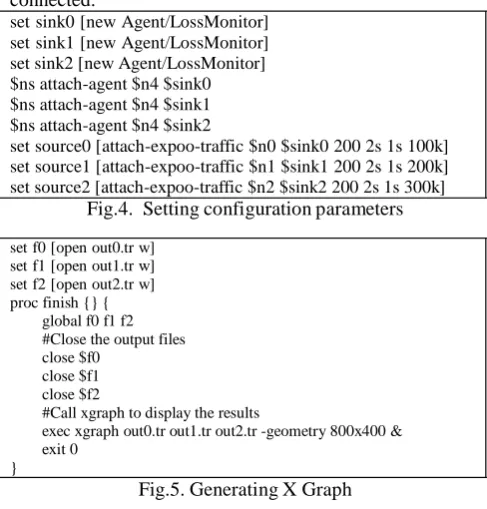
set sink0 [new Agent/LossMonitor] set sink1 [new Agent/LossMonitor] set sink2 [new Agent/LossMonitor] $ns attach-agent $n4 $sink0 $ns attach-agent $n4 $sink1 $ns attach-agent $n4 $sink2
set source0 [attach-expoo-traffic $n0 $sink0 200 2s 1s 100k] set source1 [attach-expoo-traffic $n1 $sink1 200 2s 1s 200k] set source2 [attach-expoo-traffic $n2 $sink2 200 2s 1s 300k]
Fig.4. Setting configuration parameters
set f0 [open out0.tr w] set f1 [open out1.tr w] set f2 [open out2.tr w] proc finish {} {
global f0 f1 f2 #Close the output files close $f0
close $f1 close $f2
#Call xgraph to display the results
exec xgraph out0.tr out1.tr out2.tr -geometry 800x400 & exit 0
puts $f2 "$now [expr $bw2/$time*8/1000000]" #Reset the bytes_ values on the traffic sinks $sink0 set bytes_ 0
$sink1 set bytes_ 0 $sink2 set bytes_ 0 #Re-schedule the procedure $ns at [expr $now+$time] "record" }
Fig.6. Calculating the Bandwidth
This procedure reads the number of bytes received from the three traffic sinks. Then it calculates the bandwidth (in MBit/s) and writes it to the three output files together with the current time before it resets the bytes_ values on the traffic sinks. Then it re-schedules itself.The 'record' procedure is called, and afterwards it will re-schedule itself periodically every 0.5 seconds. Then the three traffic sources are started at 10 seconds and stopped at 50 seconds. At 60 seconds, the procedure is called 'finish'.
}
Fig.5. Generating X Graph
Finally, the procedure returns a handle for the traffic source. This procedure is a good example how reoccurring tasks like attaching a traffic source to several nodes can be handled. Now we use the procedure to attach traffic sources with different peak rates to n0, n1and n2 and to connect them to three traffic sinks on n4 which have to be created first. In this example we use Agent/Loss Monitor objects as traffic sinks, since they store the amount of bytes received, which can be used to calculate the bandwidth.
F. Recording output files
Now we have to open three output files. The following lines have to appear 'early' in the Tcl script. These files have to be closed at some point. We use a modified 'finish' procedure to do that. It not only closes the output files, but also calls xgraph to display the results.
Now we can write the procedure which actually writes the data to the output files.
proc record {} {
global sink0 sink1 sink2 f0 f1 f2 #Get an instance of the simulator set ns [Simulator instance]
#Set the time after which the procedure should be called again
set time 0.5
#How many bytes have been received by the traffic sinks? set bw0 [$sink0 set bytes_]
set bw1 [$sink1 set bytes_] set bw2 [$sink2 set bytes_] #Get the current time set now [$ns now]
#Calculate the bandwidth (in MBit/s) and write it to the
Graph 1. Output graph of the example with 5 node topology
In graph 1. We can see, the bursts of the first flow peak at 0.1Mbit/s, the second at 0.2Mbit/s and the third at 0.3Mbit/s. Now you can try to modify the 'time' value in the 'record' procedure. Set it to '0.1' and see what happens, and then try '1.0'. It is very important to find a good 'time' value for each simulation scenario. Note that the output files created by the 'record' procedure can also be used with gun plot.
VI. R
ESULTS ANDA
NALYSISThe implementation can be proceded through C++ programming and OTcl languages using Network Simulation (Version2) simulator tool. In this simulation we are simulating with 250 nodes. We are calculating number of packets is dropped during packet transmission time. We constructed Simulation 2 in ns-2.28 to validate our design. Fig. 7 shows a topology with four senders S0, S1, S2, and S3, and one receiver R. DMS flows converge on the way to R in the order of S0, S1, S2, and S3. Besides fi, the senders also send CBR probes to the receiver using UDP, at 40 bytes per packet, 20 packets per seconds.
files
Copyright © 2012 IJECCE, All right reserved Fig.7. Topology of simulation 2
Fig.8. Nam output screen with 250 nodes.
Fig. 9. packet drop Due to Congetion control in nam.
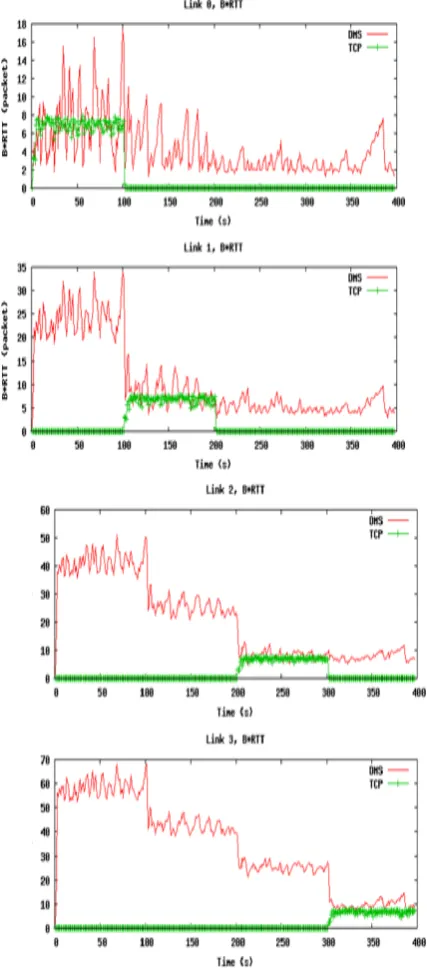
The sample length for one-way delay records is 20 (one second in length) for correlation computation; according to Rubenstein et al. This length gives nearly 90% of accuracy in correlation test. All links are configured with bandwidth of 5Mbps, delay of 20ms, and default RED setting in ns-2.28. Background traffic may congest link l0, l1, l2 or l3 to produce bottleneck. The background traffic consists of 20 TCP Reno flows on every bottleneck. The RTTs of background TCP flows are set to120ms.
Graph 2. Respective graphs with different number of flows.
Copyright © 2012 IJECCE, All right reserved Graph 4. Packet drop represented Graph.
Graph 5. Sending packet rate represented graph.
Graph6. Receiving packet rate represented graph.
Graph 7. Packet drop represented graph
Graph 8. Packet drop represented graph
VII. C
ONCULSIONIn this paper, we evaluate the performance of a congestion control scheme, DMSCC (Distributed Multimedia (Video) Streaming Congestion Control). Our sheer emphasis in this paper is answering the question will the congestion control scheme is TCP friendly [5]. For this evaluation we used a reverse tree topology and for the performance analysis we used NS2 (Network Simulator-Version2) tool. The outputs using NS2 is visualized using nam (The Network Animator–nam is a Tcl/TK based animation tool for viewing network simulation traces and real world packet traces. It is mainly intended as a companion animator to the ns simulator).
A
CKNOWLEDGMENTThis study was fully supported by the National Institute of technology, Tiruchirappalli. Besides, the authors would thank SASTRA University Thanjavur, Faculty of Science and Technology, IFHE University, Hyderabad.
R
EFERENCES[1] L. Ma and W. T. Ooi,“Congestion Control in Distributed Media Streaming”in TMH Publications & Tutorials, vol. 5, no. 2, Fourth Quater, 2006.
[2] J. Apostolopoulos, T. Wong, W. Tan, and S. Wee,“On Multiple Description Streaming with Content Delivery Networks,”in Proceedings of IEEE INFOCOM’02, New York, NY, June 2006.
[3] M. Hefeeda, A. Habib, B. Botev, D. Xu, and B. Bhargava, “PROMISE: Peer-to-Peer Media Streaming Using Collect cast,”in Proceedings of ACM International Conference on Multimedia (MM’03), Berkeley, California,USA, November 2005.
[4] L. Ma and W. T. Ooi, “Retransmission in Distributed Media Streaming, “in Proceedings of the 15th International Workshop on Network and Operating System Support for Digital Audio and Video (NOSSDAV), Stevenson, Washington, USA, June 2005. [5] J. Widmer, R. Denda, and M. Mauve,“A Survey on
TCP-Friendly Congestion Control,” in IEEE Network Magazine, Special Issue on Control of Best Effort Traffic, vol. 15, no. 3, May 2004.
[6] M. Sinfgh, P. Pradhan, and P. Francis, “MPAT: Aggregate TCP Congestion Management as a Building Block for Internet QoS,” in Proceedings of IEEE International Conference on Network Protocols (ICNP’04), Berlin, Germeny, October 2004.
Copyright © 2012 IJECCE, All right reserved
Applications,” in Proceedings of IEEE INFOCOM’04, Hong Kong, China, March 2004.
[8] T. J. Hacker, B. D. Noble, and B. D. Athey,“Improving Throughput and Maintaining Fairness Using Parallel TCP,” in Proceedings of IEEE INFOCOM’04, Hong Kong, China, March 2004.
[9] S. Floyd, M. Handley, J. Padhye, and J. Widmer,
“Equation-Based Congestion Control for Unicast Applications,” in ACM SIGCOMM’00, Stockholm, Sweden, August 2005.
[10] D. Rubenstein, J. Kurose, and D. Towsley, “Detecting Shared Congestion of Flows Via End-to-end Measurement,” in IEEE/ACM Transactions on Networking, vol. 10, June 2002.
[11] H. Han, S. Shakkottai, C. Hollot, R. Srikant, and D. Towsley, “Overlay TCP for Multi-Path Routing and Congestion Control,” in ENS-INRIA ARC-TCP Workshop, Paris, France, November 2006.
A
UTHOR’
SP
ROFILEP. Chakradhar
He is an Assistant Professor at Information and Communication Engineering Department, School of Computing, SASTRA University. He received his B.Tech. degree in the computer science and engineering from JNTU, Hyderabad and M.Tech. degree in the Computer Science from National Institute of Technology, Trichy. His area of research intrest is computer networks mainly focuses on data routing, data security and distributed data streaming.
Email: [email protected]
P. Pavan Kumar
He is Faculty Associate in Computer science Department at Faculty of science and Technology, IFHE University. He received his B.Tech. degree In Information Technology from JNTU, Hyderabad and M.Tech. degree in the computer science from National Institute of Technology, Trichy.
His area of research intrest is computer Architechture, Real-time Scheduling in Multicore Technology, Computer Networks mainly focuses on data routing, data security and distributed data streaming. Email: [email protected]