Development of the Effort Estimation Model
Using Fuzzy Decision Tree
Amit Kumar
#1, Sumeet Kaur Sehra
#2, Dr. Yadwinder Singh Brar
#3, Dr. Navdeep Kaur
#4 #1 Research Scholar, #2 Assistant Professor, Computer Science and Engineering,Guru Nanak Dev Engineering College, Ludhiana, Punjab, India
#3
Professor, Electrical Engineering, Guru Nanak Dev Engineering College, Ludhiana, Punjab, India
#4 Associate Professor, Computer Science and Engineering, Sri Guru Granth Sahib world University, Fatehgarh
Sahib, Punjab, India
Abstract— In the field of software engineering, the way of Effort Estimation consists of two steps working phenomenon, first one is for the development of the estimation model for the current dataset or repository and the second one is towards the reliability of this developed model. Effort Estimation can be elaborated in terms of a required managerial activity to estimate the realistic and accurate amount of effort(expressed normally in Person-Hours, Person-Month) for the project or the set of projects. It’s also defined as efficiency that relies on the realistic utilization of the amount of modality or resources in the development of projects. In our work, we selected an integrated concept i.e. Fuzzy concept with Decision Tree to estimate the effort. Triangular membership function is used to quantify the attributes of Desharnais dataset and C4.5 decision tree is used to develop the effort model. Normally, if we apply C4.5 Decision tree on such large datasets without any tool then it took 3 to 4 month to construct an effort model, we have tried weka tool for this dataset but this tool only supports categorical target class so we made a tool ‘C4.5 data statics calculator’ which takes an excel dataset file as an input and induces a decision tree. The result from C4.5 decision tree is compared to all the methods that have been applied to this dataset in past. By our work, we found that C4.5 decision tree gives far better estimation model than other models.
Keywords— decision making, fuzzy logic, fuzzy set., membership function, weka j48, machine learning, entropy, information gain, gain ratio, C4.5 decision tree.
I. INTRODUCTION
In the field of software engineering, the way of Effort Estimation consists of two steps working phenomenon, first one is for the development of the estimation model for the current dataset or repository and the second one is towards the reliability of this developed model. Effort Estimation can be elaborated in terms of a required managerial activity to estimate the realistic and accurate amount of effort(expressed normally in Person-Hours, Person-Month) for the project or the set of projects. It’s also defined as efficiency that relies on the realistic utilization of the amount of modality or resources in the development of projects. As the name suggests, effort estimation yields the estimated effort for the particular project either by analysis of the previous completed familiar projects or by the different explicit estimation models like (e.g., Empirical/Expert[1] based, Analytical[2] based etc.). Effort Estimation is a decisive activity to effective management of both the software and web
based projects. Effort Estimation contributes a vital part in the project development cycle which binds itself into a series of justifiable (i.e. each stage consists of verification and validation process) stages required for effective project development[3].
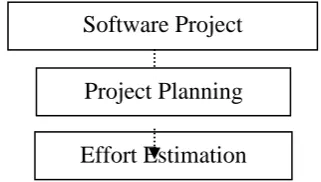
Fig. 1. Relationship of effort estimation and software
project management
Figure 1 describes the basic relationship with effort estimation and project management i.e. software project management (SPM)[4] is an activity that helps to the project managers to bind and efficient utilize all resources in all stages of development process. SPM[4] contains project planning in which planning to a project is made in terms of (cost/budget, time/schedule, resource availability/allocation, manpower, technical skills availability, financial status of organization). Effort estimation is a sub-part of project planning. Reliable and accurate effort estimation yields proper planning and proper planning makes the development process strong and non-vulnerable. If we omit estimation part from planning phase then this may yield to the number of consequences, as IBM’s 2008 survey[5], due to absence of estimation, 40% of the total processes have only met the quality requirement and 39% have met the scheduled budget. Genecea’s 2012 report narrates that due to absence of the estimation process in development, 25% projects only got the required profit success[2].
A. Fuzzy Logic
Fuzzy theory[6], [7] has gained access when Zadeh in 1965, introduce them firstly to handle the uncertainty in data. Fuzzy logic[6], [7] binds itself into fuzzy sets which have wide variety of application areas like medicine, robotics, artificial intelligence[8] etc. fuzzy sets can be characterized as:
They provide the representation of the cases into limited fuzzified cases.
Software Project
Management
Project Planning
They enable decision makers to make decision in any vague or uncertain environment where input domain isn’t clear.
Any component in the fuzzy set consists of its degree that identifies it into fuzzy set. Suppose any non-empty set ‘S’, a fuzzy set ‘A’ that have its membership degree to ‘S’ can be illustrated as:
µA :S [0,1] (1)
Where ‘S’ is also said to be ‘Universe of Discourse’[9] whose elements are mapped between a range from zero to one and µA(e) is defined as the
element ‘e’ consists of its membership degree to fuzzy set ‘A’ for each e∈E. In place of µA(e), we can also
use A(e). Suppose S{e1,e2………ei} is an finite non
empty set then fuzzy set ‘A’ from ‘S’ can be shown as: A = (µ1/e1, µ2/e2, µ3/e3……., µi/ei) (2)
Where µn/en, n1 to i shows µn consists of its
membership degree to en. Our work is depend on the
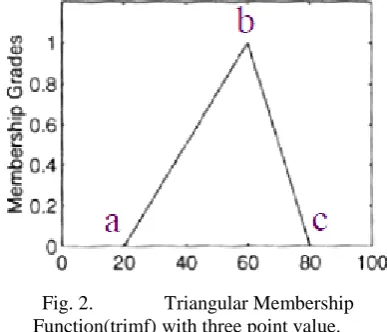
triangular membership function i.e. TMF. Matlab[7] provides an easy user interface for fuzzify the set of elements into the membership function or fuzzy set. TMF[7] consists of three straight lines to form a triangle based representation.
Fig. 2. Triangular Membership Function(trimf) with three point value. In the figure 2, the three ponits are used to create a triangular shaped curve. ‘a’ shows left corners and ‘b’ shows middle value of the triangle with ‘c’ right value and ‘x’ is an element from universe.
trimf x: a, b, c =
0 x < 𝑎 x − a b − a a ≤ x ≤ b c − x c − b b ≤ x ≤ c
0 x < 𝑐
B. Decision Trees
As the name states, A Decision Trees[7], [10]–[12] are decision oriented data mining tools that use a graphical tree shaped like structure or multiple level of decision along with their potential outcomes. Objective of the decision tree is prediction by dividing observation into mutually exclusive and exhaustive sub groups. Every branch of the decision tree shows a potential occurrence or decision. Structure of the decision tress shows how one option leads to the next. Main aim of the Decision Trees[7], [10]–[12] is to extract the answer from the complex or uncertain
environment. Tree structure allows us to model a complex situation with its potential outcomes in terms of solutions and shaped it in a simply understandable format that describes the relationship among different decisions.
There are three types of elements of the decision tress in terms of nodes-
Decision node (Root node)
Chance node/Inner node (Option oriented node)
Leaf node (Result oriented node)
Root node represents the main problem of any uncertain situation. Final result of the problem will be extracted on the basis of the root node. This node in the decision tree is represented by the rectangle having rounded corners. Chance node or Inner node are Option oriented nodes, these nodes consist of some criteria or condition specific requirement and branches from these nodes also consist of possible outcomes. Chance nodes are represented by the rectangle in Decision Tree[7], [10]–[12]. Leaf nodes are said to be result oriented node, consist of decision regarding the problem or situation. These are generally represented by the triangle. We have now discussed about the Decision Trees[7], [10]–[12] and its components, now the next thing is how to design Decision Trees[7], [10]–[12] from the given complex problem or situation. Our experiment is based on C4.5 decision tree techniques which is one of the latest technique in Decision Trees[7], [10]–[12]. C4.5 decision tree is based on the following working procedure:
Entropy- Assume we have a dataset ‘T’, then Entropy of this dataset can be illustrated by H(T)-
H T = − np=1d p ∗log2 d(p) (3)
Where d(p) is a proportion of the number of cases in a class to the total number of records in the dataset. It only deals with the target variable or attribute of the dataset.
Information Gain- It deals with only independent attributes or feature. It shows the amount of information (in bits) that can be extracted from a attribute. Assume we have a dataset ‘T’ and current attribute ‘C’ then total information can be extracted from ‘C’ is illustrated as-
H C, T = Ctk
t ∗ n
k=1 H tk (4)
Where tk is the number of cases in k
th outcome of ‘C’
attribute and Ct shows the total number of cases in ‘C’
and H tk shows the entropy of the kth outcome of attribute ‘C’. if we subtract this information to the entropy of the previous dataset then we can get information gain of ‘C’ attribute-
IG(C,T)=H(T)-H(C,T) (5)
dataset is required to calculate gain ratio then-
Is C, T = − nk=1dC p ∗log2 dC(p) (6) This is the same equation as we have in entropy but for current attribute ‘C’. Now , if we divide this splitting information from information gain of current attribute ‘C’ by equ. 5, then we can get gain ratio for attribute ‘C’ as-
GR(C, T) =IG(C,T)I
s C,T (7)
II. LITERATURE SURVEY
Although the era of effort estimation consists of a number of researches that either represents a new approach for estimation or they suggest some integrated concepts for estimation but the main motto of these researches can be seen in the reliability of the techniques in terms of accuracy that it provides.
Quinlan J.[10] elaborated a concept for ID3 algorithm for decision making and applied this on weather data. He also defined the consequences regarding the disadvantages of ID3 algorithm.
Schofield C. and Shepperd M.[13] proposed an integrated approach as Fuzzy logic[6], [7] with analogy concept for effort estimation. They use 275 completed projects for analysis and the main focus was to find the most similar cases for a new project based on similar feature or characteristics. They found that this integrated approach is a competing concept with other methods.
Finnie et al.[14] compared the three approaches on their performance on dataset that has 297 projects and out of three techniques i.e. neural network, Case base reasoning and regression model only neural network performs well and regression analysis performs worst.
Sheppered J. and Lefly M.[15] described different techniques for estimation like as Neural network, Nearest neighbour, and Least squares regression(LSR). They worked on Finnish dataset and they found, although there is no techniques that provides the best results but genetic programming proves itself as a competing technique among other techniques.
Huang et al.[6] described an integrated approach for software cost estimation along with information of the risk assessment. They applied fuzzy Decision Tree[7], [10]–[12] concept on Cocomo’s 61dataset and they found that the usability and performance of this techniques is far better than other techniques.
Reddy S. and Raju K.[16] proposed Gaussian membership function(GMF) for estimating effort value of Cocomo’s 61 dataset and they found that the accuracy results are good as comparison to other techniques.
Ferrucci et al.[5] experimented the concept of genetic programming on Desharnais[18] dataset. This dataset is available publically on promise datasets. Main dataset is divided by 3 sub datasets by 3 fold estimation and they found that the genetic
programming provides more accuracy as comparison to case base reasoning and regression analysis.
Malathi S. and Sridhar S.[17] experimented their work by fuzzy based analogy techniques on three dataset name as Nasa 63, Nasa 63 and Desharnais[18]. And result comparision is done with neural network approach by which they found that analogy with fuzzy based concept is more suitable for these three datasets. Batra G. and Trivedi M.[9] performed their experiment by two techniques as Gaussian and trapezoidal membership function both on Cocomo’61 dataset by which they found that the Gaussian membership function gives better accuracy as comparison to trapezoidal function.
Hssina et al.[11] experimented two decision tree methods (ID3 and C4.5) on a small dataset i.e. weather dataset and they found that the accuracy of C4.5 is far better than ID3.
III.METHODOLOGY
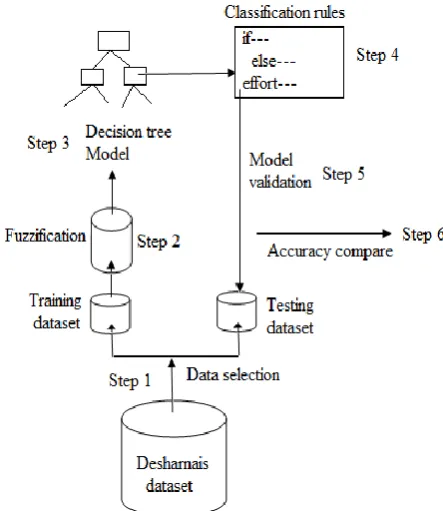
A number of steps have been adopted in our methodology; all the steps are represented by fig 3.
Fig. 3. Overview of Proposed Methodology
A. Dataset Selection
B. Techniques Selection
Although we have already mentioned the technique in introduction part but we have also used two sub concepts of our main technique. Our main technique for experiment is ‘C4.5 decision tree’ and two sub concepts are ‘C4.5 Average prediction’ and ‘C4.5 probabilistic prediction’. These two are slightly differ from each other i.e. in average prediction, leaf node will only induce the average of all competing values but in probability prediction the leaf node will be induced by the most accurate value from the competing values for that node. This accuracy is calculated when we test our model by testing dataset.
Fig. 4.Working of the two sub-concepts of C4.5 Decision Tree
C. Tool Selection
To development an estimation model for Desharnais[18] dataset we made ‘C4.5 data statics calculator’ tool in which an excel file is used as an input and this tool performs level by level calculation for the number of attributes and you only need to write down the responses from this tool at the end of the level.
D. Membership Function Selection
In our work, we have used Triangular membership function(TMF)[7] to quantify the target variable of the Desharnais[18] dataset as shown in figure 5.
Fig. 5. Fuzification by Triangular Membership Function via Matlab
IV.EVALUATION CRITERIA
In order to test the accuracy of our model, we have selected two criterion i.e. MMRE(Mean Magnitude of Relative Error) and Pred(25). Before elaborating the concept of MMRE first of all we have to calculate MRE for each and every project in the dataset as-
MRE =Actual Effort ~ Estimated Effort
Actual Effort (8)
Then MMRE can be calculated as- MMRE =1
𝑛 MREk
𝑛
𝑘=1 (10)
Where n is the total number of cases in the current dataset. Pred(25) shows the percentage of the total number of observations that are <=25% of the actual effort value. That means if we have an actual effort 50 unit then estimated effort must be in 38.5-62.5 range as-
Pred(25) =1𝑛 1 if MREk ≤ 25%
Otherwise 0
𝑛
𝑘=1 % (11)
V. RESULTS AND DISCUSSION
As we have already discussed about our two sub concepts of C4.5 decision tree in section 3. By our work, we found that C4.5 probabilistic prediction works far better than other methods that have been applied to Desharnais[18] dataset till date.
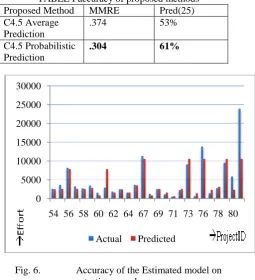
TABLE I accuracy of proposed methods Proposed Method MMRE Pred(25) C4.5 Average
Prediction
.374 53% C4.5 Probabilistic
Prediction
.304 61%
Fig. 6. Accuracy of the Estimated model on testing sample
Figure 6 shows the testing samples that are tested by our estimation model. Result of the C4.5 probabilistic prediction technique is also compared with the number of models that have been already applied on this dataset and are mentioned in our literature review and we found that based on MMRE this technique performs better than these models.
0 5000 10000 15000 20000 25000 30000
Fig. 7. Accuracy comparison with other models
VI.CONCLUSION AND FUTURE WORK
Clearly we have found a model that shows best prediction results as comparison to other models. Although we have mentioned the two accuracy criterion for our work but for comparison we used only MMRE, this is because MMRE is a strong comparison metrics i.e. it shows the actual deviation of the estimated value from the actual effort value but Pred(25) only show the predictions that are <=25% of actual, it does not indicates about the prediction’s deviation.
In our work, we have used a combinational approach for estimation i.e. Decision tree with Fuzzy logic[6], [7], future work can be done as the combination of another approach or methodology with decision tree to reduce the relative error and to increase the accuracy of the estimation process because accuracy is the central part of the estimation.
REFERENCES
[1] Basavaraj M. and Shet K. (2008), "Empirical validation of Software development effort multipliers of Intermediate COCOMO Model", Journal of Software, vol. 3, NO. 5, ISSN: 1796-217X, pp. 65-71.
[2] Lijin B. and Malathi S. (2014), "An Efficient Method for the Estimation of Effort in Software Cost", International Journal of Advance Research in Computer Science and Management Studies, Vol. 2, No. 2, ISSN: 2321-7782, pp. 330-335.
[3] Capretz L., HO D., and Nassif A. (2012), "Analyzing the
Non-Functional Requirements in the Desharnais Dataset for Software Effort Estimation", 11th International Conference for Upcoming Engineers (ICUE), DOI: 10.1186/1687-3963-2013-1.
[4] Fisher D. and Srinivasan K. (1995), "Machine Learning
Approaches to Estimating Software Development Effort", IEEE Transactions on Software Engineering, vol. 21, NO. 2, ISSN: 0098-5589, pp. 126-137.
[5] Ferrucci F., Gravino C., Oliveto R. and Sarro F. (2010),
"Genetic Programming for Effort Estimation: an Analysis of the Impact of Different Fitness Functions", 2nd International
Symposium on Search Based Software Engineering, DOI 10.1109/SSBSE.2010.20, pp. 89-98.
[6] Chiu N., Haung S. and Lin C. (2006), "Fuzzy Decision Tree Approach for Embedding Risk Assessment Information into Software Cost Estimation Model", Journal of Information Science and Engineering, ISSN: 1016-2364, pp. 297-313.
[7] Elyassami S. and Idri A. (2011), "Applying Fuzzy ID3
Decision Tree for Software Effort Estimation", International Journal of Computer Science Issues, vol. 8, NO. 4, ISSN: 1694-0814, pp. 131-138.
[8] Garcia S., He F.,Luengo J. and Saez J. (2013), "A Survey of Discretization Techniques Taxonomy and Empirical Analysis in Supervised Learning", IEEE Transactions on Knowledge and Data Engineering, vol. 25, NO. 4, ISSN: 0098-5589, pp. 734-750.
[9] Batra G. and Trivedi M. (2013), "A Fuzzy Approach for Software Effort Estimation", International Journal on Cybernetics & Informatics, vol. 2, NO. 1, ISSN: 1694-0784, pp. 9-15.
[10] Quinlan J. (1986), "Induction of Decision Trees", Kluwer Academic Publishers, pp. 81-106.
[11] Erritali M., Ezzikouri H., Hssina B. and Merbouha A. (2014),
"A comparative study of decision tree ID3 and C4.5", Special Issue of International Journal of Advance Computer Science and Applications, vol. 3, NO. 10, ISSN: 2156-5570, pp. 13-19.
[12] Bowyer K., Chawla N., Hall L. (1998), "Combining Decision
Trees Learned in Parallel", Distributed Data Mining Workshop at International Conference of Knowledge Discovery and Data Mining, DOI: 10.1145/347090.347091. [13] Schofield C. and Shepperd M (1997), "Estimating Software
Project Effort Using Analogies", IEEE Transactions on Software Engineering, vol. 23, NO. 12, ISSN: 0098-5589, pp. 736-743.
[14] Desharnais J., Finnie G. and Witting G. (1997), "A
comparison of Software Effort Estimation Techniques”, Elsevier Science Inc., ISSN: 0164-1212, pp. 281-289.
[15] Lefly M. and Shepperd M. (2003), "Using Genetic
Programming to Improve Software Effort Estimation Based on General Data Sets", The Genetic and Evolutionary
Computation Conference, DOI:
10.1017/S1351324908004919, pp. 2477-2487.
[16] Raju K. and Reddy S. (2009), "An Improved Fuzzy Approach
for COCOMO’s Effort Estimation using Gaussian Membership Function", Journal of Software, vol. 4, NO. 5, ISSN: 1796-217X, pp. 452-459.
[17] Malathi S. and Sridhar S. (2012), "Estimation of Effort in Software Cost Analysis for Heterogeneous Dataset using Fuzzy Analogy", International Journal of Computer Science and Information Security, vol. 10, NO. 10, ISSN: 1947-5500.
[18] http://promise.site.uottawa.ca/SERepository/datasets/desharnai
s.arff
0.64
0.420.580.62 0.72
0.3060.3990.3820.320.31 1.724
0.304
0.00 0.20 0.40 0.60 0.80 1.00 1.20 1.40 1.60