Volume 01, No. 11, November 2015
P
age
35
Activated Carbon from Coconut Shell using Fluidized Bed
Reactor and its Simulation
S. N. Saha* & G. P. Dewangan**
*Professor, Department of Chemical Engineering, Guru GhasidasVishwavidyalaya, (Central University) Bilaspur (C.G.), India
**Assistant Professor, Department of Chemical Engineering, Guru GhasidasVishwavidyalaya, (Central University) Bilaspur (C.G.), India
ABSTRACT
Simulation has been done on the production of chemically activated carbon from coconut shell by pyrolysis using fluidized bed reactor. The effect of process variables such as void fraction, particle size, sphericity, fluidizing velocity, fluidized bubbling bed wake, char density on the design of fluidized bed reactor leading to production and quality of activated carbon have been studied and dealt with in the present paper . The established mathematical equations describing the Fluidized Bed Reactor have been listed for its simulation. MATLAB programming has been done resorting to the real life data obtained from industries fluidized bed reactor for production of activated carbon.
KEYWORDS: Activation, Pyrolysis, Activated carbon, Coconut shell, Fluidized bed reactor, MATLAB programming, Simulation .
INTRODUCTION
Activated carbon is known as a unique and effective agent for purification and recovery of trace material. During the last two to three decades, treatment with active carbon has become an important unit process for separations and purifications in the food, pharmaceuticals, sugar, chemical and other processing industries. Nowadays it is used in widely varied industries like portable and industrial waste water treatment, soft drink, semiconductor, gold recovery, petrochemical, solvent recovery, domestic and waste disposal, air conditioning, fridge deodorization. Activated carbon is an amorphous form of elemental carbon and is prepared by destructive distillation of any one of a variety of carbonaceous raw materials, including wood, coal or coconut shell. It is produced by activation process which is nothing but heating the char in an atmosphere of superheated steam and removal of the tar blocking the micro fine structure of the char. The average ultimate analysis of the coconut shell pyrolysis products express C 48%, O 45.5%, H 5.8%, N 0.3%, S 0.4% which is comparable with other carbon rich bio mass like groundnut shell, walnut shell, peanut shell or almond shell. Bulk density, hardness, and particle size distribution are the most important physical characteristics of activated carbon for better rate of adsorption kinetics. There are mainly three forms of activated carbon –granular irregular shaped size ranging from 0.2 to 5 mm;
pelletized extruded and cylindrical shaped with size range from 0.8 to 5 mm and powdered
Volume 01, No. 11, November 2015
P age
36
Volume 01, No. 11, November 2015
P
age
37
solid driven by wake, fraction of total bed occupied by bubble not including wake using the
MATLAB programming.
IMPORTANT PARAMETERS OF FBR
Fluidization velocity: As the char density decreases with reaction time, the fluidizing velocity also decreases. The Iodine Number, i.e., mg. of iodine absorbed per gm. of carbon indicating the extent of micro pore distribution in carbon, increases with the increase of fluidizing velocity up to some critical limit like 8 times the minimum fluidizing velocity beyond which the iodine number falls as still the fluidizing velocity increases.
Particle size: Iodine number increases with increase of particle size because of the lower reaction rate owing to the less macro pore on the chars. During the reaction the density of solid particle reduces up to say 20% of the original value, particle size remaining virtually almost same.
Bed height: Because ofthe slugging behavior with poor gas – solid contact, as the bed height decreases, the Iodine number increases.
Bed temperature: Lower activation temperature of a fluidized bed predicts the higher Iodine number. At a particular bed temperature as the reaction time increases, the Iodine number also increases. Better activation is expected to be available at relatively lower bed temperature, with no significant improvement at higher bed temperature.
Pressure drop: Beyond the minimum fluidization condition as the fluidization velocity increases, the pressure drop decreases, leading to the non-homogeneous expanded bed with rising of the gas bubbles.
Bed expansion ratio: At a particular fluidizing velocity the bed expansion ratio is defined as the ratio of the average fluidized bed height and the initial static height of the fixed bed.
The nature of trend of the variation of two of the above parameters namely particle diameter, minimum fluidization velocity dealt with in this present paper is comparable with the nature of curves on different systems reported elsewhere (2,3,6,7,10,19).
Volume 01, No. 11, November 2015
P
age
38
Figure1 : Two-stage FBR for activation
MATHEMATICAL EQUATIONS DESCRIBING THE FBR
Kunii and Levenspiel proposed the Bubbling Bed Modelhaving the bubble phase and emulsion phase in the FBR comprehensively follows the mathematical expressions (1).The fluidized bed consists of three regions namely bubble, cloud and emulsion with the wake being the part of the cloud region which is intermediate between bubble and emulsion phase. Solid mass of the fluidized bed,
= ρcAchs(1 −∈s) = ρcAch(1−∈) (1)
where,Ac is the bed cross-sectional area,hs is the static bed height , h is the bed height, ∈s is the static bed porosity, ∈ is the expanded bed porosity , and ρcis the density of the bed particles.
The pressure drop,
Δp=g(ρc- ρg)(1−ε)h, (2)
whereρg is fluid density,ε is void fraction of the fluidized bed.
For the FBR, in order to calculateϵ s, the following mathematical equation isapplicable:
ϵ s = 1 − ). (3)
where, r is the particle radius.
Minimum fluidization velocity,umf can be computed from the mathematical expression
umf=[ (ΦDp)2/150μ ] [g(ρc− ρg)] [(ϵmf3/1 − ϵmf)], (4)
where, μ is gas viscosity measured as for a homogeneous fluid, quantified property inverse of fluidity, g is gravitational acceleration, ρcis char particle density, ρg is fluidizing gas density. This expression is valid for small char particles with Reynold’s number less than 20.
For large char particles with Reynold’s number higher than 1000, the equation to be applicable is, umf2=(ΦDp/1.75) (ρc− ρg)/ρg).gϵ mf3 (5)
Spherical particle surface area, AS = 2 (6)
The sphericity, being the ratio of sphere surface (AS) to particle surface (Ap) both at same
Volume 01, No. 11, November 2015
P
age
39
The sphericity for spherical particle is 1 and for non-spherical particle, it is less than 1.
The void fraction, ϵ can be considered to be a time average value envisaging that the upper surface of the fluidized bed is considered as usually uneven and more or less oscillating.
The void fraction at minimum fluidizing condition ϵmf=
(8)
The mathematical equation for the bubble rise velocity can be formulated as
u
br = 0.711( , (9)where, the notation is the bubble diameter measured as the diameter of sphere having the same volume as the spherical cap bubble.
The absolute rise velocity of bubble in the bubbling bed model can be manipulated by
u
b=(uo – umf)+
0.711(,
whereuois superficial fluid velocity.(10)
For fast moving large bubbles, gas enters lower fraction of bubble, leaving at the top of the same, subsequently is swept around and returning to the bubble itself. Surrounding the bubble this region of circulation is termed as cloud. The shape of the lower part of the bubble being concave results because pressure in the lower portion of the bubble is less than in the surrounding emulsion phase, leading to unstable partial collapse of bubble and the turbulent mixing. This turbulence forms the wake.
By material balance for solid particles crossing any horizontal plane of the FBR, considering the emulsion and wake, neglecting the cloud, the equation for downward flowing solid velocityin the emulsion is established as
u
s(1 – δ – αδ) =αδu
b, (11)where,δ is the fraction of the bed occupied by the bubbles and α is the volume ratio of the wake to bubble.δ value has been kept below 0.5 with the indication of possible conditions of rising bubbles in the bed, however, for small slow bubbles near the bottom of the bed of FBR, 0.1<δ<0.2.
Hence,
u
s=
,
(12)
where,usis mean downward velocity of solid in emulsion phase and (1 – δ – αδ) is the bed fraction of the emulsion phase including the cloud.
Computing the material balance of gas flow in the FBR, one can find the following relation: uo =δub+ϵ mfαδub+ϵmf(1 – δ – αδ)ue,
(13) ue being the upward velocity of gas through the emulsion phase.
u
e= (u
mf/ϵ
mf ) –u
s(14)
The bubble fraction occupied in the bed is equated by the mathematical expression as follows:
δ
=
(15)
Ignoring the wake at the condition of ub>>umf, the following simplified relation is valid for FBR :
δ =
(16)
The frequency of bubbles passing the tip of a probe used for recording is given by
Volume 01, No. 11, November 2015
P
age
40
where, h is the height between two successive bubbles registered on the probe .
Eventually the mathematical manipulated expression for the approximate bubble diameter, db = 1.5/n(uo – umf) (18)
And bubble velocity,
ub = uo - umf+ 22.26db1/2 (19) uo=1.3umffor small slow bubbles near the bottom of the bed. (20)
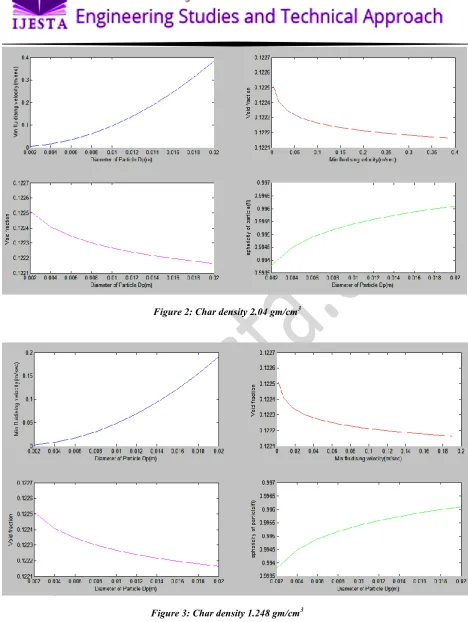
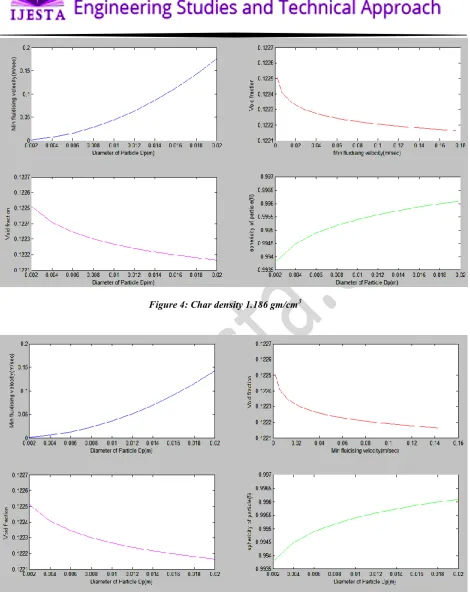
SIMULATED RESULT
Volume 01, No. 11, November 2015
P
age
41
Figure 2: Char density 2.04 gm/cm3
Volume 01, No. 11, November 2015
P
age
42
Figure 4: Char density 1.186 gm/cm3
Volume 01, No. 11, November 2015
P
age
43
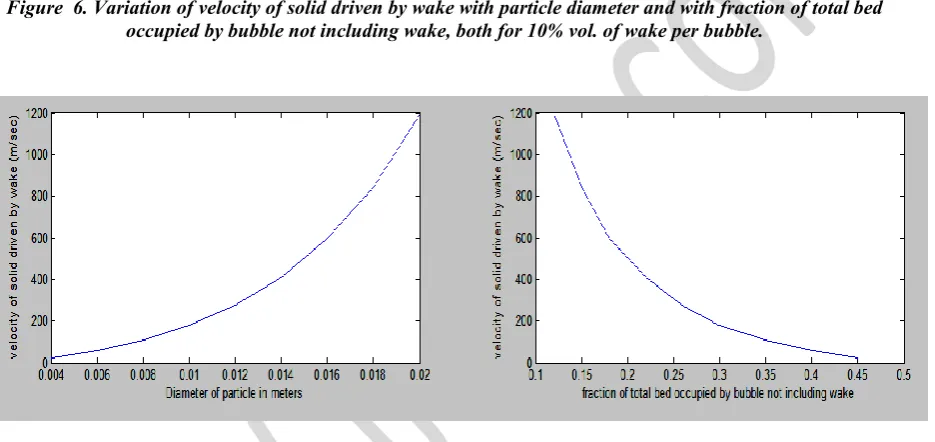
Figure 6. Variation of velocity of solid driven by wake with particle diameter and with fraction of total bed occupied by bubble not including wake, both for 10% vol. of wake per bubble.
Figure 7.Variation of velocity of solid driven by wake with particle diameter and with fraction of total bed occupied by bubble not including wake, both for 20% vol. of wake per bubble.
CONCLUSION
Volume 01, No. 11, November 2015
P
age
44
leading to smooth regular variation can be explained owing to the cause of the factor of frequency of bubbles passing the tip of a probe used for recording in the FBR.The simulated data would be helpful in designing and operation of FBR for more cost effective industrial production of activated carbon.
REFERENCES
i. Kunii, D., Levenspiel,O. Fluidization Engineering; John Wiley & sons, Inc., New York,1969.
ii. Saha, S.N. and Chanda, B.C., “Heat Transfer Study of Fluidised Bed Gas
Combustion” Ind.Chem.Engg.inc. Res. Trans. JI. Vol 14. No. 2. 1982
iii. Saha ,S.N. and Chanda, B.C., “Heat Transfer Study of Fluidised Bed Coal
Combustion” Ind. JI of Power and River Valley Development, 1985,Vol 35, Nos. 3&4.
iv. Kirubakaran, C. J., Krishnaiah, K.,Seshadri, S. K., “ Experimental Study of the Production of Activated Carbon From Coconut Shells in a Fluidized Bed Reactor”, Ind. Eng. Chem. Res. 1991,30, 2411-2416.
v. Laine, J and YunesS.,“Effect of the preparation method on the pore size distribution of activated carbon from coconut shell”, Carbon, 30, 1992, 601-604.
vi. Saha,S.N. and Banerjee, R., “Modelling and Simulation for Desulphurization of Fluidised Bed Coal Combustion”, Proc. Ind. ChemEngg. Cong. Kharagpur,1994, Dec 14-17,
vii. Saha S.N., “Mathematical Modeling and Simulation of Fluidized Bed Sulphur
Retention”, Proc., IIChE Golden Jubilee Cong., Delhi, 1997. Dec 14-18,
viii. Sai, P.M. Satya et al., "Production of Activated Carbon from Coconut Shell Char in a Fluidized Bed Reactor", Ind.Eng.Chem.Res.,1997, 3625-3630.
ix. Arriagada R, García R, Molina-Sabio M and Rodríguez- ReinosoF.,“Effect of steam
activation on the porosity and chemical nature of activated carbons from Eucalyptus globulusand peach stones”, Microporous Materials, 1997, 8, 123-130
x. Saha, S.N. “Nitrogen Pollution Control by Using Fluidized Bed Bio Reactor”, Proc.
49th Canadian Chem. Engg.Conf., Saskatoon. Canada, October, 3-6, 1999
xi. Saha,S.N., “Mathematical Modelling and Simulation of fluidised Bed Gasifier”, Proc.,
Ind. Chem. Engg. Cong. ’99, Chandigarh,1999, Dec 20-23.
xii. Li,Yong., Zhang, J. and Fan, Liangh-Sih, “ Numerical simulation of gas-liquid-solid
fluidization systems using a combined CFD-VOF-DPM method: bubble wake behavior”, Chem. Eng. Sc., 1999, 54, 5101-5107.
xiii. Tam, Man and Michael Antal. "Preparation of Activated Carbons from Macadamia Nut Shell and Coconut Shell by Air Activation", Ind. Eng. Chem. Res.,1999, 38, , 4268-4276
xiv. Kersten, S.R.A., Wang,X., Prins, W, van Swaaij, W.P.M., “ Biomass pyrolysis in a
Volume 01, No. 11, November 2015
P
age
45
xv. Wei, Su, et al. “Preparation of Microporous Activated Carbon from Raw Coconut Shell by Twostep Procedure”, Chinese Journal of Chemical Engineering, 2006,14.2, 266-269 .
xvi. Zhang, Jieling, et al. "Product Analysis and Thermodynamic Simulations from the Pyrolysis of Several Biomass Feedstocks." Energy and Fuels 21, 2007, 2373-2385. xvii. Sundaram,E. and Natarajan, E., "Pyrolysis of Coconout Shell: An Experimental
Invetigation." The Journal of Engineering Research 6.2, 2009, 33-39.
xviii. A Special Report, “Activated carbon-a techno-commercial profile”, Chemical
Weekly, April 20, 2010.
xix. Saha, S.N., “Elements of Fuel Combustion & Energy Engineering”, DhanpatRai Pub.
Ltd., New Delhi, 2013.
xx. Singh, Ravi I., Brink, A., Hupa, M., “CFD Modeling to study fluidized bed combustion and gasification”, App. Th. Eng., 2013, 52, 585-614.
xxi. Saha,S.N. and Gadhewal, R. “Numerical Analysis of 3D Fluidized Bed Coal
Combustion”, Int. Jl. of Comp. & Math. Sc., 2015, Vol. 4, No.7.
xxii. Saha, S.N. and Dewangan, G.P. “Modeling and Simulation of Fluidized Bed Catalytic
Reactor Regenerator”, Int. Jl. of Engg. Tech. Sc. and Res., 2015, Vol. 2, No. 9.
xxiii. Stravropoulos, G.G., Zabaniotone, A.A., “Minimizing Activated Carbon Production Cost”, Fuel Process Technol.,2009, 90(7-8), 952-957.
xxiv. Tchoffor, Placid, Davidson, K.O., Thunman, Henrik, “Production of Activated