Improving the Quality of Education in Higher Schools
by Developing the Students Capabilities using Data
Mining Techniques
Ahmed Ashraf1*, Hazem M. El-Bakry2, Yehia El-Mashad3, Samir Abd-Elrazik4 and Mohammed El-Desouky5 1,2,4Information Systems Dept., Faculty of Computer and Information Sciences, Mansoura University, Mansoura, EGYPT.
5Computer science Dept., Faculty of Computer and Information Sciences, Mansoura University, Mansoura, EGYPT. 3Delta University, EGYPT.
Date of publication (dd/mm/yyyy): 26/10/2017
Abstract – The main objective of this research work is to develop the performance of education in higher schools e-learning systems. This is accomplished with the aide of data mining (DM) techniques. The proposed model is applied on different students. Data is collected using online school tests, reports and quizzes. This paper applies SVM with accuracy 89%, Decision tree with accuracy 89%, M5-Rules with RMS error equal to 1.4621 and Linear Regression with RMS error equal to 2.0017, 3.0089 and 3.6057. Once getting both first and second grades, the presented results show a high predictive accuracy. Not only past student's evaluations affected in their academic achievement, but also other factors like father's and mother's jobs and absences. Briefly, student performance can be improved depending on predictive results and enhancing school systems.
Keywords – Data Mining, Educational Systems, Classification, Regression, Decision Trees.
I. INTRODUCTION
Students have to learn in anywhere by any way. Electronic learning (E-Learning) is the employment of computers and web to help both learners and educators to learn anytime and anywhere without restrictions. E-learning has created new markets for education. It is far from the traditional trend of education which depends on the tremendous revolution of information technology. The use of Internet, computers and networks for learning purposes is called E-learning [1]. Usual E-learning systems offer knowledge and evaluation for learners but our proposed system aims to ensure that students received educational content correctly by monitoring his handling of the course content and communicate directly with him to direct it to the correct way. On the other hand, as a result of the evolution of information systems, attention towards Data Mining is constantly increasing [2]. Making decisions and achieving goals need to real information. So the student's information must be very close to reality. Examples are grades, social and demographic data. Because of the limited human ability to predict, an alternative tool to analyze a big data to make a decision is needed. Student learning is the best area for applying data mining applications because of the available data like databases, pages on web and all web process [19-52]. There are many questions concerning the field of E-Learning that can be answered with techniques using Data Mining algorithms: Which type of students who have a credit hours system? Who need to study the course again? How to increase the number of our students? How to
handle system's errors? How to prevent student converting to another E-Learning system? What are the methods of predicting student performance? How to improve the student's performance and achievements? The main points of this paper are to predict and enhance the student's performance as well as improve his achievement [3].
II. MATERIALS AND METHODS
It is known that the secondary education consists of three years. Students study many educational materials like Sciences, Historical, Geometric and Mathematics. The method of evaluation of tests varies, but a 20-point grading is often used, Starting from o and ending with 20. Students are evaluated on three levels: the first evaluating (G1N), the second evaluating (G2N) and the last evaluation (G3N) as shown in table 1. In order to keep pace with the development of information technology in learning we developed website to make e learning system instead of sheets system. The traditional systems have many disadvantages such as lack of data and lack of credibility. The database was built from three dimensions data registration on our website questionnaires and results are tested for each year. We designed our site to get special data divided into four sections grades, related feature, social and demographic which affect student performance [4]. During the preprocessing step some variables had to be ignored due to the lack of discriminative value.
III. DATA MINING MODELS
There are many analytics tools (Classification and Regression Tree) used for extracting the most useful variables from the dataset. The output of each tool is the difference between them (classification is a discrete and regression is a continuous). The classification shows the result as percentage while in regression as Root Mean Squared [5]. Classifications to be good should present a low Correct Classifications, while regression should present a low global error. All of these results come from using the equations:
𝛷(𝑖) = {1 , 𝑖𝑓 𝑦𝑖= 𝑦̂𝑖
0 , 𝑒𝑙𝑠𝑒 (1)
PCC = ∑ 𝛷(𝑖)
𝑁 × 100(%) 𝑁
𝑖=1 (2)
The dataset records is tested and applied on various classification algorithms using WEKA an Open source tool such as:
- Linear Regression (finding the best-fitting straight line through the point).
- SVM Support Vector Machines. - C4.5.
- M5-Rules Algorithm.
3.1 C4.5
The most important feature in Decision tree (DT) is the use of a tree structure as simple representation for a set of rules that diG1 Suish values hierarchically [6]. It is a useful tool for the classification [7]. DT Algorithm is to discover the behavior of each attribute [8]. Tree classification algorithm is used to make the prediction and understood the critical distribution of the data is easily [9].
3.1.1 Confusion Matrix
A confusion matrix (an error matrix) is a specific table layout that allows visualization of the performance of an algorithm, typically a supervised learning one (in unsupervised learning it is usually called a matching matrix) [10]. This matrix used in the field of machine learning and specifically the problem of statistical classification. In the table layout rows and columns have a role, each row represents the instances in an actual class and each column of the matrix represents the instances in a predicted class [11].
Figure 1 shows the prediction outcome using a confusion matrix. The main objective from confusion matrix is to describe classification model performance which applied to set of known data.
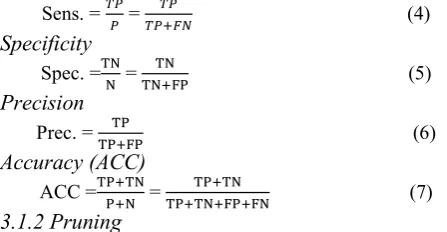
Sensitivity
Sens. = 𝑇𝑃𝑃 = 𝑇𝑃+𝐹𝑁𝑇𝑃 (4)
Specificity
Spec. =TNN = TN+FPTN (5)
Precision
Prec. = TP+FPTP (6)
Accuracy (ACC)
ACC =TP+TNP+N = TP+TN+FP+FNTP+TN (7)
3.1.2 Pruning
One of the most important techniques in machine learning is a pruning which used to remove a section of the tree to reduce the size of decision trees. A tree with a lot of branching is a big problem so we need to reach to the optimal size by removing the nodes that do not provide important information [12].
3.2 Linear Regression
Regression used as statistical analysis tools [13]. To explain the link between a dependent and independent variables we have to use regression analysis, taking into consideration that variable based on a sample from a given community [14]. Regression model can be written as.
𝑦𝑖= 𝛽0 + 𝛽1𝑥1+ 𝛽2𝑥2+ ⋯ . 𝛽𝑛𝑥𝑛+ 𝜀𝑖 (8)
Where,
- β0 : Intercept. - βk : Coefficient.
- K : Independent variable. - εi : Error term.
3.3.
SMO
SMO solves the SVM QP problem by dividing it into QP sub-problems then the smallest one, including two Lagrange multipliers [15].
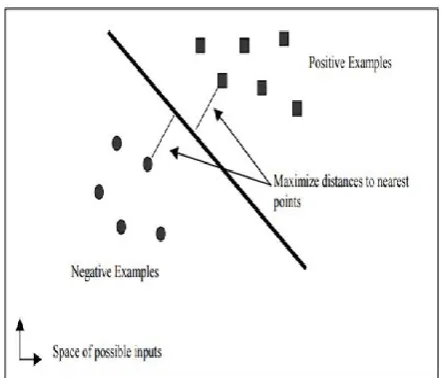
As shown in the figure 2 in the linear case, the margin is defined by the distance of the hyper plane to the nearest of the positive and negative examples. The output of a linear SVM written as:
U =𝑤⃗⃗ . 𝑥 – b (9) Where,
- w : The normal vector. - x : The input vector.
The separating hyper plane is the plane u = 0. The nearest points lie on the planes u = ± 1. The margin M is thus
M =|| 𝑤 ||1
2 (10)
3.4. M5-Rules Algorithm
M5 algorithm is one of the common methods for generating rules from the trees. The M5 builds regression trees whose leaves are consist of multivariate linear models, and the nodes of the tree are chosen over the attribute that maximizes the expected error reduction as a function of the standard deviation of output parameter [16]. The association rule and the classification rule are the only two rule algorithm type [17]. The important of using Rule algorithms in data mining application : It offer simple and clear results, active in undirected data mining, deal with huge amount of data, using a simple computation. Create M5 tree in three steps: generates a regression tree using the training data, and calculates a linear model for each node of the tree generated, tries to simplify the regression tree deleting the nodes of the linear models whose attributes do not increase the error and reduces the size of the tree without reducing the accuracy.
IV. SIMULATION RESULTS
Classification has been performed using C4.ss (Sequential Minimal Optimization), Linear Regression and M5-Rules Algorithm m on mathematical dataset in weka tool.
4.1.
Results for Classification using J48
J48 is applied on the data set and the confusion matrix is generated for class gender having two possible values i.e. PASS or FAIL.
Confusion Matrix
𝛼 𝛽
102 28 | 𝛼 = Fail 15 250 | 𝛽 = Pass
For above confusion matrix, TP for class 𝛼 = ’Fail’ is 102 while FP is 28 whereas, for class 𝛽 = Pass, TP is 250 and FP is 15 i.e. diagonal elements of matrix 102 + 250 = 352 (the correct instances) and other elements 15 + 28 = 43 (the incorrect instance).
4.2.
Results for Classification using SVM
SVM is applied on the data set and the confusion matrix is generated for class gender having two possible values i.e. PASS or FAIL.
𝛼 𝛽
106 24 | 𝛼 = Fail 19 246 | 𝛽 = Pass
For above confusion matrix, TP for class 𝛼 = ’Fail’ is 106 while FP is 24 whereas, for class 𝛽 = Pass, TP is 246 and FP is 19 i.e. diagonal elements of matrix 106 + 246 = 352 (the correct instances) and other elements 24 + 19 = 33 (the incorrect instances).
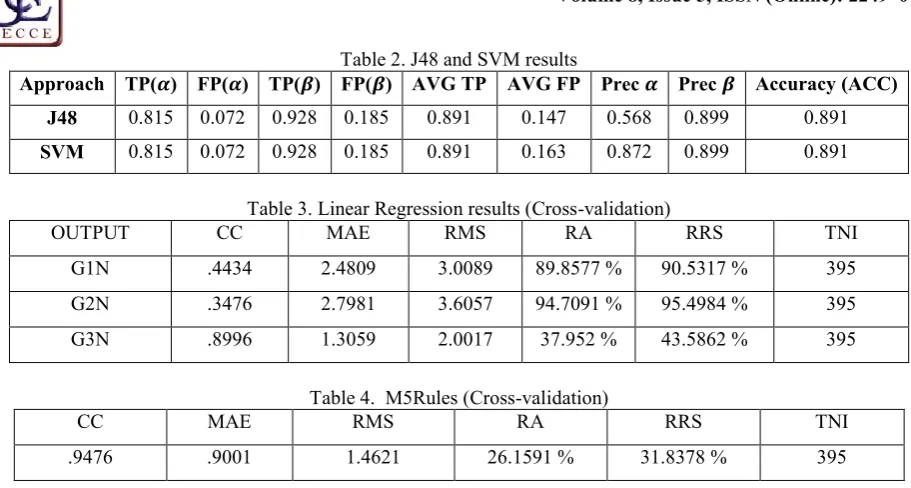
Table 2 shows the results of J48 and SVM, we notice that both have the same high accuracy which equal to 0.981.
4.3.
Results for Classification using Linear Regression
To apply linear Regression, preprocessing must apply to some variables (convert nominal variables to numerical variables) [18]. Linear Regression will be applied to the available dataset on three ways:
1. All variables in dataset (G3N is the output).
2. All variables in dataset except G3N, G2N (G1N is the output).
3. All variables in dataset except G3N (G2N is the output).
Regression Results:
1. Linear Regression Model
G3N =
.53 school + .2568 * age .4192 * Fjob + .5391 * Fjob -.2845 * activities + .3167 * romantic + .4022 * famrel + .1355 * Walc +.0474 * absences + .1687 * G1N + 0.9718 * G2N + .7893
2. Linear Regression Model
G1N =
.8726 * sex + .2222 * F edu + .5466 * M job + .8306 * Mjob – 1.2776 * Mjobth + 1.8858 * M job + 1.0861 * Fjob + .9411 * Fjob + .6673 * study time – 1.2542 * failures + 2.0633 * school sup + 0.9542 * famsup + 1.2838 * higher + .2502 * free time - .4451 * 274out - .216 * health + 6.1228
3. Linear Regression Model
G2N =
.8958 * sex -.2264 * age + .687 * famsize + .3074 * Medu +.9718 * Mjob - 1.5888 * Mjob + 2.2183 * Mjob + 1.4052 * Fjob -.9341 * guardian -.4422 * travel time + .5564 * study time - 1.4591 * failures + 1.4613 * school sup +.8055 * famsup +.6754 * internet +.7634 * romantic -.4796 * goout -.2518 * health + 13.2063
Table 3 shows Correlation coefficient (CC), Mean absolute error (MAE), Root mean squared error (RMS, Relative absolute error (RA), Root relative squared error (RRS) and Total Number of Instances (TNI). We notice that RMS has a low values (2.0017 for G3N, 3.0089 for G1N and 3.6057 for G2N).
4. Results for Classification using M5 Rules
Rule: 1IF
G2N > 10.5 THEN
G3N =
0.0439 * age + 0.201 * Mjob - .1484 * travel time - .0236 * activities + .022 * romantic +.0256 * famrel -.1054 * Walc +.003 * absences +.0124 * G1N + 1.041 * G2N - 1.0993
[203/15.592%]
Rule: 2 IF
absences > 1 G2N > 7.5 THEN
G3N =
-.038 * age - .2381 * famsize + .046 * Pstatus - .0259 * Medu - .1884 * Fedu - .0369 * Mjob + .039 * Mjob - .0618 * Fjob + .0326 * reason + .0461 * schoolsup + .0745 * romantic + .0912 * famrel + .0314 * Walc + .0074 * absences + .199 * G1N + .8447 * G2N + .389 [97/20.84%]
Rule: 3 IF
absences <= 1 G2N > 6.5 THEN
G3N =
-1.4169 * age - 1.3755 * reason - .3079 * activities + .0343 * absences + 1.1151 * G2N + 20.2863 [38/87.272%]
Rule: 4 IF
absences > 1 THEN
G3N =
.3999 * age -.2253 * Medu + .6979 * Mjob - .2776 * failures + 0.0455 * absences +.7721 * G2N - 5.2655 [34/21.977%]
Rule: 5
G3N =
+ 0 [23]
It is noticed that RMS has a low values (1.4621).
V. CONCLUSION
It has been presented some ways to predict grades of students in Mathematics course for secondary schools based on previous student grades in first or/and second year and other attributes. The presented model has been tested by using four data mining methods (SVM, Decision tree M5-Rules and Linear Regression). Simulation results have proven that a high predictive accuracy can be achieved when applying Decision tree and SVM Techniques. While low Root mean squared error is obtained when applying M5-Rules and Linear Regression Techniques.
REFERENCES
[1] Dr. P. Nagarajan. Dr. G. Wiselin Jiji, “ONLINE EDUCATIONAL SYSTEM (e- learning), International Journal of u- and e- Service, Science and Technology Vol. 3, No. 4, December, 2010. [2] Turban E.; Sharda R.; Aronson J.; and King D., 2007. Business
[3] Luan J., 2002. Data Mining and Its Applications in Higher Education. New Directions for Institutional Research, 113, 17–36. [4] Pritchard M. and Wilson S, 2003. Using Emotional and Social Factors to Predict Student Success. Journal of College Student Development, 44, no. 1, 18–28.
[5] Witten I. and Frank E., 2005. Data Mining: Practi-cal Machine Learning Tools and Techniques with Java Implementations. Morgan Kaufmann, San Francisco, CA.
[6] Breiman L.; Friedman J.; Ohlsen R.; and Stone C., 1984. Classification and Regression Trees. Wadsworth, Monterey, CA. [7] Ihsan A. Kareem 1, Mehdi G. Duaimi, 2014, Improved Accuracy for Decision Tree Algorithm Based on Unsupervised Discretization, IJCSMC, Vol. 3, and Issue. 6, June 2014, pg.176 – 183.
[8] Gaganjot Kaur, Amit Chhabra, Improved J48 Classification Algorithm for the Prediction of Diabetes, International Journal of Computer Applications (0975 – 8887) Volume 98 – No.22, July 2014.
[9] Nadali, A; Kakhky, E.N.; Nosratabadi, H.E., "Evaluating the success level of data mining projects based on CRISP-DM methodology by a Fuzzy expert system," Electronics Computer Technology (ICECT), 2011 3rd International Conference on , vol.6, no., pp.161,165, 8- 10 April 2011.
[10] Stehman, Stephen V. (1997). "Selecting and interpreting measures of thematic classification accuracy". Remote Sensing of Environment. Volume 62, Issue 1, October 1997.
[11] Powers, David M. 2011, Evaluation: From Precision, Recall and F-Factor to ROC, Informedness, Markedness & Correlation, Technical Report SIE-07-001.
[12] Trevor Hastie, Robert Tibshirani, and Jerome Friedman. 2001, the Elements of Statistical Learning. Springer, pp. 269-272. [13] K. Hrona, P. Filzmoserb and K. Thompsonc. 2009, Linear
regression with compositional explanatory variables, Journal of Applied Statistics Vol. 00, No. 00, January.
[14] Cody S. Ding, 2006, using Regression Mixture Analysis in Educational Research, Volume 11 Number 11, December 2006. [15] John C. Platt, Sequential Minimal Optimization: A Fast Algorithm
for Training Support Vector Machines, Technical Report MSR-TR-98-14 April 21, 1998.
[16] Dolado, J.J., Rodriguez, D., Riquelme, J., Ferrer-Troyano, F., & Cuadrado, J.J. (2007). A Two Stage Zone Regression Method for Global Characterization of a Project Database. Available at: http: //www.cc.uah.es/drg/b/DolRodetAlIdea07.pdf (accessed 5.7.12). [17] Angelina Njegus1, Vanja Nikolie2, Verka Jovanovi, 2015,
Angelina Njegus1, Vanja Nikolie2, Verka Jovanovi, 2015 THE SELECTION OF OPTIMAL DATA MINING METHOD FOR SMALL-SIZED HOTELS, International Scientific Conference of IT and Business-Related Research.
[18] Hastie T.; Tibshirani R.; and Friedman J., 2001. The Elements of Statistical Learning: Data Mining, Infer - ence, and Prediction. Springer-Verlag, NY, USA.
[19] Ahmad Ashraf, Hazem M. El Bakry, Samir M. Abd El-razek, and Yehia El-Mashad “Handling big data in e-learning,” International Journal of Advanced Research in Computer Science & Technology, vol. 3, issue 1, Jan. -March 2015, pp. 47-51. [20] N. S. Abu El-Ala, H. M. El-bakry, S. A. Abd El-Hafeez “Personal
Cloud-based Learning Environment,” International Journal of Computer Science and Engineering, vol. 8, No. 4, April 2016, pp. 122-127.
[21] H. El-Bakry and M. Hamada, Enhancing Adaptive Mobile E-Learning by using Cloud Computing, in “Active and Collaborative Learning: Practices, Problems and Prospects”, M. Hamada, (Ed.), pp. 139-165, NOVA Science Publisher, ISBN: 978-1629480664, Dec. 2013.
[22] A.M. Riad, Hazem M. El-Bakry, and Samir M. Abd El-razek, “Virtual Investigation of Patients for Medical E-Learning,” International Journal of Computer Science and Information Security, vol. 10, no. 7, August, 2012, pp. 6-10.
[23] Samir M. Abd El-Razek, Waeil F. Abd El-Wahed and, Hazem M. El-Bakry, “MUVES: A Virtual Environment System for Medical Case Based Learning,” International Journal of Computer Science and Network Security, vol. 10, no. 9, September 2010, pp. 159-163.
[24] Mohammed Yaqub, A. M. Raid, and Hazem M. El Bakry, “Online Social Learning Suggestion System Based On Student Behavior,” International Journal of Information Science and Intelligent
system, vol. 4, No. 1, Jan. 2015, pp. 43-64.
[25] Ahmad Ashraf, Hazem M. El Bakry, Samir M. Abd El-razek, and Yehia El-Mashad “Handling big data in e-learning,” International Journal of Advanced Research in Computer Science & Technology, vol. 3, issue 1, Jan.-March 2015, pp. 47-51. [26] M. Yaqub, A.M. Raid and H. El-Bakry, “IMPROVING
E-LEARNING PERFORMANCE THROUGH SOCIAL
COMMUNICATIONS,” International Journal of Intelligent Computing and Information Science, Vol. 14, No.4, October 2014, pp. 73-85.
[27] Mohammed Yaqub, A. M. Raid, H. M. El-Bakry, Haitham A. EL-Ghareeb “Online Social Learning Suggestion System Based On Student Behavior,” International Journal of Advance Foundation and Research in Computer, vol. 1, issue 10, October 2014, pp. 7-18.
[28] Mohammed Khaleel, Hazem M. El Bakry, and Ahmed A. Saleh, “Developing E-learning Services Based on Cache Strategy and Cloud Computing,” International Journal of Information Science and Intelligent System, vol. 3, No. 4, October 2014, pp. 45-52. [29] Mohammed Yaqub, A.M. Raid, and H.M. El-Bakry, “Open Social
Learning Network,” International Journal of Computer Engineering and Intelligent Systems, vol. 5, No. 7, July 2014, pp. 1-12.
[30] Ahmed A. Saleh and Hazem M. El-Bakry, “Adaptive E-Learning Based on Learner's Styles,” Bulletin of Electrical Engineering and Informatics, vol. 2, No. 4, December 2013, pp. 240-251. [31] Ahmed A. Saleh and Hazem M. El-Bakry, “ A Novel Adaptive
Mobile E-Learning Model Based on Developed Learner's Styles,” Bulletin of Electrical Engineering and Informatics, vol. 2, No. 2, June 2013, pp. 141-157.
[32] Ahmed A. Saleh and Hazem M. El-Bakry, “A Novel Adaptive Mobile E-Learning Model,” International Journal of Computer Applications, vol. 63, No. 14, Feburary 2013, pp. 12-25. [33] N.S. Abu El-Ala, W.A. Awad and H.M. El-Bakry, “Cloud
Computing for Solving E-Learning Problems,” International Journal of Advanced Computer Science and Applications, vol. 3, No. 12, December 2012, pp. 135-137.
[34] Hazem El-Bakry, and Mohamed Hamada, “Adaptive E-Learning for Data Encoding and Computer Networks based on Learner’s Styles,” International Journal of Computer Networks and Security, vol. 22, issue 12, December 2012, pp. 333-342. [35] A.M. Riad, Hazem M. El-Bakry, and Samir M. Abd El-razek,
“ Design of Virtual Environment for Medical E-Learning,” Global Advanced Research Journal of Engineering, Technology and Innovation, vol. 1, no. 6, September 2012, pp. 138-147. [36] A.M. Riad, Hazem M. El-Bakry, and Samir M. Abd El-razek,
“Simulation of Medical Consultation on Virtual Patient,” International Journal of Computational Linguistics and Natural Language Processing, vol. 1, issue 3, October 2012, pp. 60-64. [37] Ahmed A. Saleh, Hazem M. El-Bakry, and Taghreed T. Asfour,
“Design of Adaptive E-Learning for Logic Operations," International Journal of Education and Information Technologies, issue 2, vol. 4, 2010, pp. 49-56.
[38] Hazem M. El-Bakry, and Nikos Mastorakis, "Realization of E-University for Distance Learning," WSEAS Transactions on Computers, issue 1, vol. 8, Jan. 2009, pp. 48-62.
[39] Mohammed Yaqub, A.M. Raid, H.M. El-Bakry, and Nikos Mastorakis, “Improving E-Learning Performance Through Social Communications,” Proc. of the 11th International Conference on
Educational Technologies (EDUTE '15) Dubai, United Arab Emirates, February 22-24, 2015, pp. 129-137.
[40] A.M. Riad, Hazem M. El-Bakry, and Samir M. Abd El-razek, “ Design and Evaluation of Medical E-Learning Model,” the 3rd
WSEAS International Conference on Bioscience and Bioinformatics (ICBB '12), Montreux, Switzerland, December 29-31, 2012, pp. 265-272.
[41] Ahmad Ashraf, Hazem M. El Bakry, Samir M. Abd El-razek, Yehia El-Mashad, and Nikos Mastorakis, “Enhancing Big Data Processing in Educational Systems,” Proc. of the 11th
International Conference on Educational Technologies (EDUTE '15) Dubai, United Arab Emirates, February 22-24, 2015, pp. 176-181.
[42] Hazem M. El-Bakry, Ahmed A. Saleh, Taghreed T. Asfourand, and Nikos Mastorakis, “A New Adaptive E-Learning Model Based on Learner's Styles,” Proc. of 13th WSEAS Int. Conf. on
SCIENCE and ENGINEERING (MACMESE '11), Catania, Sicily, Italy, November 3-5, 2011, pp. 440-448.
[43] Samir M. Abd El-Razek, Hazem M. El-Bakry, and Wael F. Abd El-Wahed, “Design of Virtual Environment for Medical E-Learning,” Proc. of ICI10–10thInternational Conference on
Information at Delta University for Science and Technology, Gamassa, EGYPT, December 4-6, 2010, pp.
[44] Ahmed A. Saleh, Hazem M. El-Bakry, Taghreed T. Asfour and Nikos Mastorakis “Adaptive E-Learning Framework for Digital Design," Proc. of 9th WSEAS International Conference on
Telecommunications and Informatics, Italy, May 29-31, 2010, pp. 176-182.
[45] Ahmed A. Saleh, Hazem M. El-Bakry, Taghreed T. Asfour and Nikos Mastorakis “Adaptive E-Learning Tools for Numbering Systems," Proc. of 9th WSEAS International Conference on
Applications of Computer Engineering (ACE'10), Penang, Malaysia, March 23-25, 2010, pp. 293-298.
[46] Hazem M. El-Bakry, and Nikos Mastorakis “Activation of Informal Learning with E-learning Technology" Proc. of
EDUCATION and EDUCATIONAL TECHNOLOGY
CONFERENCE 2009 (EDU'09), University of Genova, Genova, Italy, October 17-19, 2009, pp. 245 -247.
[47] Ahmed A. Saleh, Hazem M. El-Bakry, Mahmud Atta Alla and Nikos Mastorakis “ON THE WAY TO MODELING: A CASE STUDY IN MANAGING MODEL TRANSFORMATIONS IN MDA," Proc. of 9th WSEAS International Conference on
DISTANCE LEARNING and WEB ENGINEERING (DIWEB '09), Budapest, Hungry, September 3-5, 2009, pp. 89-103. [48] Hazem M. El-Bakry, and Nikos Mastorakis “Modular Networks
for Active E-learning,” Proc. of 9th WSEAS International
Conference on Applied Informatics and Communications (AIC'09), Moscow, Russia, August 26-28, 2009, pp. 373-382. [49] Hazem M. El-Bakry, and Nikos Mastorakis “E-Learning and
Management Information Systems for E-Universities,” Proc. of 13th WSEAS International Conference on Computers, Rodos,
Greece, July 22-25, 2009, pp. 566-574.
[50] Hazem M. El-Bakry, and Nikos Mastorakis “Advanced Technology for E-Learning Development,” Proc. of Recent Advances in Applied Mathematics and Computational and Information Sciences, Houston, USA, April 30-May 2, 2009, pp. 501-522.
[51] Hazem M. El-Bakry, and Nikos Mastorakis, " Realization of E-University for Distance Learning, " 8th WSEAS International
Conference on DISTANCE LEARNING and WEB ENGINEERING (DIWEB '08), Santander, Cantabria, Spain, September 23-25, 2008, pp. 17-31.
[52] Ahmed Ashraf, Hazem M. El-Bakry, Yehia El-Mashad, Samir Abd-Elrazik, Mohammed El-Desouky, “Improving Secondary School Student Performance using Data Mining Techniques," International Journal of Advanced Research in Computer Science & Technology, vol. 5, issue 3, July-September 2017, pp. 13-20.
Fig. 1. Confusion matrix
Fig. 2. A linear SVM (Support Vector Machine)
Table 1. The preprocessed student related variables Data type :Attribute
Gender of student : G1 S age of student : G1 N School of student: G1 S student’s address : G1 S parent: G1 S
Education of mother : G1 N job of mother : G1 S Education of father : G1 N job of father: G1 S Guardian : G1 S Size of family : G1 N Relationships family : G1 N Reason to attend this school : G1 S Travel time : G1 N
Studying time for week: G1 N Past failures No : G1 N
Other educational support : G1 S Family support : G1 S
Activities : G1 S Extra classes : G1 S Internet available: G1 S Nursery: G1 S
Looking forward to joining higher education : G1 S In relationship : G1 S
Free time: G1 N
Going out after school : G1 N Alcohol: G1 N
Health: G1 N Absences : G1 N G1N : G1 S ( C4.s )
G1N : G1 N (M5Rules and Linear Regression) G2N : G1 S ( C4.s )
G2N : G1 N (M5Rules and Linear Regression) G3N : G1 S ( C4.s )
Table 2. J48 and SVM results
Approach TP(𝜶) FP(𝜶) TP(𝜷) FP(𝜷) AVG TP AVG FP Prec 𝜶 Prec 𝜷 Accuracy (ACC) J48 0.815 0.072 0.928 0.185 0.891 0.147 0.568 0.899 0.891
SVM 0.815 0.072 0.928 0.185 0.891 0.163 0.872 0.899 0.891
Table 3. Linear Regression results (Cross-validation)
OUTPUT CC MAE RMS RA RRS TNI
G1N .4434 2.4809 3.0089 89.8577 % 90.5317 % 395
G2N .3476 2.7981 3.6057 94.7091 % 95.4984 % 395
G3N .8996 1.3059 2.0017 37.952 % 43.5862 % 395
Table 4. M5Rules (Cross-validation)
CC MAE RMS RA RRS TNI