http://www.sciencepublishinggroup.com/j/ajss doi: 10.11648/j.ajss.20180604.12
ISSN: 2330-8559 (Print); ISSN: 2330-8540 (Online)
Circuit Weight Training on Stable and Unstable Surfaces:
Differences in Energy Cost, Blood Lactate and Rate of
Perceived Exertion
Liliane Cunha Aranda
1, *, Jeferson Macedo Vianna
1, Elder Sousa Dutra
1,
Francisco Zacaron Werneck
2, Jefferson da Silva Novaes
1, Jorge Roberto Perrout de Lima
1,
Victor Manuel Machado de Ribeiro dos Reis
31
Department of Sports, Federal University of Juiz de Fora, Juiz de Fora, Brazil
2Studies and Research Laboratory of Exercise and Sport - Sports Centre, Federal University of Ouro Preto, Ouro Preto, Brazil
3
Research Center in Sports Sciences, Health Sciences & Human Development, Vila Real, Portugal
Email address:
*
Corresponding author
To cite this article:
Liliane Cunha Aranda, Jeferson Macedo Vianna, Elder Sousa Dutra, Francisco Zacaron Werneck, Jefferson da Silva Novaes, Jorge Roberto Perrout de Lima, Victor Manuel Machado de Ribeiro dos Reis. Circuit Weight Training on Stable and Unstable Surfaces: Differences in Energy Cost, Blood Lactate and Rate of Perceived Exertion. American Journal of Sports Science. Vol. 6, No. 4, 2018, pp. 137-143. doi: 10.11648/j.ajss.20180604.12
Received: August 11, 2018; Accepted: August 30, 2018; Published: October 11, 2018
Abstract:
Unstable surfaces have been used in resistance training, but there are no studies that compared energy cost between stable and unstable surfaces in circuit weight training. This study compared energy cost, post-exercise peak blood lactate and perceived exertion rate between stable surface and unstable surface. Twenty healthy men (24.65 ± 3.48 years, 1.79 ± 0.08 m, 80.61 ± 9.14 kg and 11.86 ± 3.49% body fat) participated in the study. Test and retest of 15 maximum repetitions were performed on stable and unstable surfaces to define workload. The circuit weight training consisted of one set of 15 repetitions at 80% of 15 maximum repetitions in bench press, back squat, rowing bent prone, dead-lift, shoulder press, elbow extension and elbow flexion. Energy cost was measured by indirect calorimetry during and post-circuit weight training. Peak blood lactate and perceived exertion rate were measured post-exercise. Total energy cost was higher on unstable surface compared to stable surface (70.7 ± 10.0 vs. 66.6 ± 7.8 kcal; p = 0.01), as was perceived exertion rate (8.1 ± 0.9 vs. 7.6 ± 1.3; p = 0.02). However, peak blood lactate was higher on stable than unstable surfaces (13.6 ± 2.6 vs. 12.5 ± 1.9 mmol·L−1; p = 0.05). In conclusion, circuit weight training on unstable surfaces can be performed with less weight in comparison to stable surfaces, thereby lowering mechanical stress on joints and bones, while still providing a higher metabolic impact.Keywords:
Circuit Method, Resistance Training, Energy Expenditure1. Introduction
The effectiveness of resistance training to provide high energy cost (EC) during and especially after the training has been proven in several studies [1-4]. Such experiments show that during resistance exercise, EC changes according to various factors related to the training methodology and the use of additional equipment [5, 6]. Among them, it can be
mentioned exercises performed on unstable surfaces (US) [6] and the circuit weight training (CWT) [4, 7].
activated, compared with that on a traditional stable surface (SS), as it increases activation of the stabilizing muscles of the trunk [8, 9]. An increased activation would represent an additional stress to the musculoskeletal system, which could lead to an increase in EC. In addition, the CWT consists of a greater volume of training and reduced recovery interval between resistance exercises as opposed to non-circuit workout, and these are essential factors to increase EC [10-12].
A previous study compared, in ten trained men, the acute effect of the CWT with the traditional method (three consecutive sets for each muscle group) on EC and peak blood lactate (PBL) [13]. The results showed that the EC was similar in both protocols, except anaerobic EC was higher in the traditional method, together with PBL, due to consecutive sets and a subsequent increase in lactate production. In contrast, another study compared the PBL post- three different CWT in 11 women. The results were significantly higher in circuits with aerobic intervals between resistance exercises compared to other circuits [14]. However, the comparative measure of EC and PBL on different platforms of instability in CWT is still unknown.
The utilization of US during resistance training can change, EC, PBL and rate of perceived exertion (RPE), due to the degree of imbalance generated by the body. Previous experiments found a higher RPE assessed by the Borg scale in exercises performed on a Swiss ball compared with SS [15]. In contrast, a more recent study did not find a significant difference in RPE assessed by the OMNI_RES scale in the bench press exercise on a Swiss ball vs. traditional bench press. It is noteworthy that the studies above verified the responses after a single resistance exercise [6].
Thus, training methods performed in unstable surfaces may be an additional tool for professionals, as long its effects on metabolism are proven. Therefore, this study aimed to
compare the acute effect of CWT on EC, PBL and RPE on SS and US. It was hypothesized that EC, PBL and RPE would be higher in the unstable condition of exercise.
2. Methods
2.1. Subjects
Twenty healthy, recreationally active men (24.65 ± 3.48 years, 1.79 ± 0.08 m, 80.61 ± 9.14 kg and 11.86 ± 3.49% body fat) with previous experience in resistance training (6.25 ± 4.61 years) participated in the study. The sample was selected in a non-probabilistic way and inclusion criteria were: men aged between 19 and 30 years, who had not suffered any type of musculoskeletal injury, responded negatively to all items of the Physical Activity Readiness Questionnaire (PAR-Q) and who had been involved in resistance training for more than 12 months. The sample excluded subjects who consumed drugs, alcohol and/or who smoked and had previous experience in resistance exercise on US. The research was approved by the Ethics Committee for Human Research (Protocol no 204.521/2013). All subjects signed the Informed Consent in accordance with Resolution 196/96 of the National Health Council.
2.2. Experimental Design
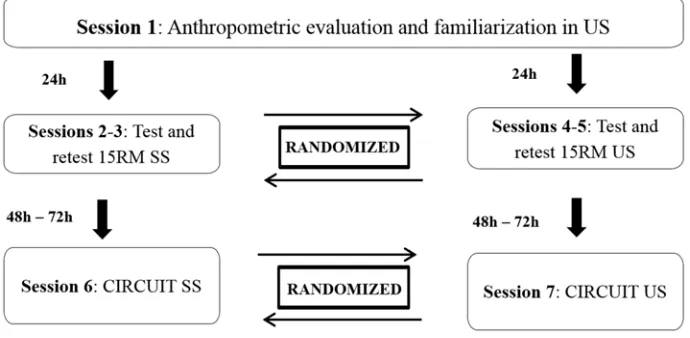
The research was conducted across seven testing sessions. In session 1, after measurement of anthropometric variables, the subjects underwent a series of familiarization with the US, performing three sets of 15 repetitions at approximately 60% of maximum RPE. In sessions 2, 3, 4 and 5, the volunteers were submitted to test and retest of 15 maximum repetitions (15RM) on both surfaces [16]. In sessions 6 and 7, EC, PBL and RPE were registered during the CWT on both surfaces, illustrated in Figure 1.
Figure 1. A summary of the study.
2.3. Procedures
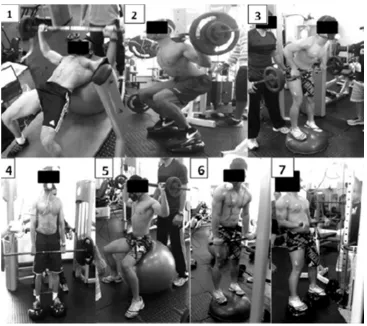
The CWT was conducted on SS vs US in the following exercise order: 1) bench press on a bench (traditional exercise) (Righetto Fitness Equipment, Bench Press, São
rowing bent prone (traditional exercise) vs. rowing bent prone on a Bosu ball (Sport Balance Trainer – 55 cm, San Diego, USA); 4) dead-lift (traditional exercise) vs. dead-lift on two balance disks (Pretorian, Balance Cushion, São Paulo, Brazil), one under each foot; 5) shoulder press on a bench (traditional exercise) vs. shoulder press on a Swiss ball; 6) elbow extension (traditional exercise) vs. elbow extension on a Bosu ball and 7) elbow flexion (traditional exercise) vs. elbow flexion on two balance disks (Pretorian, Balance Cushion, São Paulo, Brazil), one under each foot (Figure 2). The subjects performed 15 repetitions for each CWT in a
random order, exercising at 80% of 15RM without rest between exercises. The pace of the metronome was set at 40 bpm for all exercises and the total time of the circuit was 7 minutes and 25 seconds on both surfaces. The intervals between randomly assigned CWT sessions were a minimum of 24 and maximum of 72 hours. Testing was performed under the supervision of a certified professional. Subjects were instructed to maintain the same food intake for 24 hours prior to each testing and refrain from coffee, tea or any other thermogenic substance.
Figure 2. Sequence of resistance exercises in the circuit weight training on unstable surfaces.
2.4. 15RM Test
Due to differences of the maximum loads between the two exercise conditions, 15RM was assessed for each subject in the two conditions in random order. To lower the estimation error for 15RM test, the following strategies were used: (i) familiarization prior to testing in order to let the participant become aware of the data collection routine; (ii) orientation about the technique and cadence of exercise, that was 40 bpm = 20 repetitions per minute (Metronome EMT-888 Tuner, São Paulo, Brazil); (iii) use of verbal orientation and (iv) the weights were previously checked on a precision scale. The load used for the determination of 15RM was accomplished through the use of 2, 5, 10, 15, 20 and 25 kg bars and disks (Righetto Fitness Equipment, São Paulo, Brazil). The range of motion was assessed by visual inspection by a certified professional to determine the start and end positions in each
exercise. After obtaining the weight for the first exercise, a 10-minute interval was adopted before moving on to the next exercise. The order of execution of the exercises was the same as the CWT, as shown in Figure 2.
The retest aimed to assess the reliability of the load. The heaviest weight obtained on both days with less than 5% difference was considered the 15-RM. In the case of a large discrepancy, subjects were tested again.
2.5. Measures of EC, PBL and RPE
Pre, during and post-exercise exercise, VO2, VCO2 and
ventilation were continuously measured using a portable open-circuit gas-exchange analyzer (COSMED K4b2, Rome, Italy) in order enable the calculation of ventilatory measures: VE, VO2, VCO2, ventilatory equivalents (VE/VO2,
VCO2/VO2). The equipment was calibrated for ambient air,
reference gases, time delay, and turbine before each testing. The measurements were done at rest (10 minutes) with volunteers in a supine position, throughout the exercise (CWT) and at recovery (10 minutes) with volunteers again in a supine position. Aerobic EC was calculated using the following formula: aerobic EC = (((mean exercise VO2 ×
body weight)/1000) × 4686) × exercise time. Anaerobic EC was calculated using the excess post-exercise oxygen consumption (EPOC) using the formula: anaerobic EC (EPOC) = (((tau/60) × delta VO2)/1000) × 4686 [17], tau
being the mono-exponential curve time constant representing the recovery of VO2 after exercise. Tau represents the point
on the curve where VO2 reaches 63% of the peak value, that
is, the time it takes to recover 63% of peak VO2. VO2 delta is
the difference between VO2 and peak VO2 of the final
recovery. Total EC was calculated using the formula: total EC = aerobic EC + anaerobic EC [18].
PBL was obtained at rest and immediately after exercise with individuals in a supine position. A sample of capillary blood was taken from the distal phalange of the index finger of the left hand to determine the concentration of blood lactate. The finger was cleaned before and after blood collection with cotton and 70% liquid alcohol to avoid contamination of the data. Collection was started immediately after exercise and repeated measurements were done every 90 seconds until PBL was found. This procedure was performed using a portable analyzer (Accutrend Plus, Roche Diagnostics, USA), previously calibrated with known reference lactate values.
OMNI-RES for specific use in resistance training was used for RPE Assessment. The RPE scale was explained to the volunteers before exercise. Each subject was asked to point out on the scale the number that represented the effort of the active muscles (peripheral fatigue) and another number which represented the overall body (central fatigue) immediately after completion of the exercise. Low and high perceptual anchors for OMNI-RES were established using a visual-cognitive procedure [19]. This procedure instructs the subject to cognitively establish a perceived intensity of exertion that is consonant with that depicted visually by the weight lifter at the bottom (i.e., low anchor, rating 0) and top (i.e., high anchor, rating 10) of the incline as presented in the OMNI-RES. Subjects were instructed to use their memory of the least and greatest effort that they had experienced while lifting weights to help in establishing the visual-cognitive link. The OMNI-RES was in full view of the subject at all times during the experimental protocol [20].
The tests were conducted in the laboratory of the Faculty of Physical Education and Sports of the Federal University of Juiz de Fora, always in the morning, with the room temperature between 20 and 25°C and relative humidity between 45% and 60%.
2.6. Statistical Analysis
To test differences in EC and PBL between exercise performed on SS and on US, it was used Student’s t-test,
after verification of the data normality assumption (Kolmogorov–Smirnov test, with Lilliefors significance correction). Differences in RPE between the two conditions were evaluated using the Wilcoxon test, after non-normal distribution of data was verified. To test correlations between continuous variables, we used the Pearson correlation. The effect size (ES) was calculated by Cohen’s “d” [21]. The sample size calculation was performed using G-POWER software, considering the comparison of a continuous variable between two paired samples and using a confidence level of 95%, 80% power and ES 0.70. The results are presented as mean ± standard deviation. The analyses were performed in SPSS statistical software version 20.0 (IBM Corp., Armonk, USA), adopting a significance level of 5% (p ≤ 0.05).
3. Results
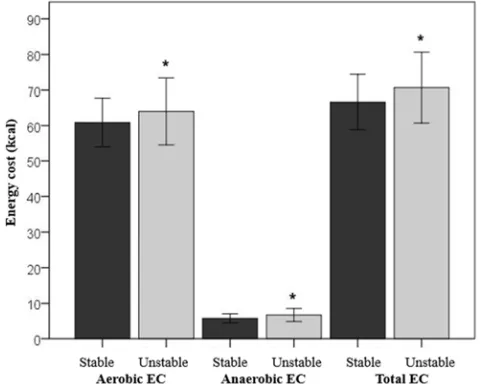
A significantly higher EC was observed during exercise performed on US when compared with that on SS. The exercises performed on US promoted greater aerobic EC (64.0 ± 9.4 vs. 60.9 ± 6.9 kcal; p = 0.03; ES = 0.38), anaerobic EC (6.7 ± 1.8 vs. 5.8 ± 1.3 kcal; p = 0.04; ES = 0.58) and consequently total EC (70.7 ± 10.0 vs. 66.6 ± 7.8 kcal; p = 0.01; ES = 0.46) compared with exercises on SS (Figure 3).
Figure 3. Mean and standard deviation of aerobic, anaerobic and total energy cost (EC) of a set of circuit weight training resistance exercises on stable and unstable surfaces (n = 20). Significant differences between the surfaces (p < 0.05).
During exercise, VO2 was significantly higher on US
compared with SS (23.4 ± 2.6 vs. 22.3 ± 1.7 mL·kg−1·min−1; p = 0.05; ES = 0.51). The 95% CI of the difference between the mean stable and unstable conditions was 0.4 to 5.8 kcal for aerobic EC, 0.1 to 1.8 kcal for anaerobic EC and 1.2 to 6.9 kcal for total EC. The ES observed for EC was of medium magnitude (ES < 0.80). There were no significant differences in peak VO2 between exercise on US vs. on SS
0.65).
The PBL post-exercise on SS was significantly higher, when compared with that on US (13.6 ± 2.6 vs. 12.5 ± 1.9 mmol·L−1; p = 0.05; ES = 0.49) (Figure 4). The 95% CI of the difference between the means of the PBL was 0.03 to 2.4 mmol·L−1.
Figure 4. Mean and standard deviation of the peak blood lactate fter the circuit weight training held on stable and unstable surfaces (n = 20).*Significant differences between the surfaces (p = 0.05).
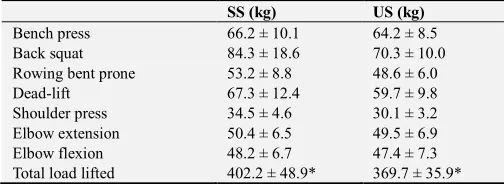
The total load lifted was significantly higher on SS compared with US (402.2 ± 48.9 vs. 369.7 ± 35.9 kg; p < 0.001). Table 1 illustrates the mean load of each exercise on SS and US. However, no relationship was observed between the total load and PBL either on SS (r = 0.34; p = 0.14) or on US (r = 0.16; p = 0.51).
Table 1. Mean and standard deviation of the total load lifted (kg) on stable and unstable surfaces (n = 20).
SS (kg) US (kg)
Bench press 66.2 ± 10.1 64.2 ± 8.5
Back squat 84.3 ± 18.6 70.3 ± 10.0
Rowing bent prone 53.2 ± 8.8 48.6 ± 6.0
Dead-lift 67.3 ± 12.4 59.7 ± 9.8
Shoulder press 34.5 ± 4.6 30.1 ± 3.2
Elbow extension 50.4 ± 6.5 49.5 ± 6.9
Elbow flexion 48.2 ± 6.7 47.4 ± 7.3
Total load lifted 402.2 ± 48.9* 369.7 ± 35.9*
SS – stable surface; US – unstable surface; *Significant differences between the surfaces (p < 0.001).
The RPE was greater on US when compared with that on SS (Figure 5). Exercises performed with instability promoted greater peripheral RPE (8.5 ± 1.1 vs. 7.9 ± 1.4; p = 0.02), central RPE (7.8 ± 1.2 vs. 7.3 ± 1.4; p = 0.02) and hence total RPE (8.1 ± 0.9 vs. 7.6 ± 1.3; p = 0.02). There was no significant correlation among the EC variables, PBL and RPE (p > 0.05).
Figure 5. Mean and standard deviation of perceived exertion after the circuit weight training performed on stable and unstable surfaces (n = 20). *Significant differences between the surfaces (p = 0.02).
4. Discussion
This is the first study comparing EC, PBL and RPE in CWT performed on SS vs. on US in healthy men. The results confirm the hypothesis that the CWT on US increases EC and RPE, when compared with the same method on SS. There were also significant differences in relation to PBL, however the largest results were in SS, probably due to the fact that the total load lifted higher in this condition of exercise.
The anaerobic contribution is usually ignored in EC estimations, leading to an overall underestimation of the actual EC of a given exercise. It can be observed that aerobic, anaerobic and total EC on US were greater, compared with that on SS. The recent research describes the oxygen uptake and total EC (including both aerobic and anaerobic contribution) response during three different CWT protocols of equivalent duration composed of free weight exercises, machine exercises, and a combination of free weight exercises intercalating aerobic exercise in men and women. The results showed EC higher in the combined exercise (259 ± 65 kcal), compared with free weight (203 ± 58 kcal) and machine (173 ± 48 kcal). The combined exercise produced the highest total EC but the lowest PBL and RPE [22]. The exercise protocol in that study differs from the present study because it comprised three sets of resistance exercises and our study was limited to one set. When extrapolating the results of our study for three series, we found values close to the findings described for free weight CWT.
total EC of 7.82 ± 3.1 kcal·min−1 was found for men [23]. We found a lower result in the present study in both surfaces. The PBL in men at 80% of 15RM in the afore mentioned was 20.7 ± 4.5 mmol·L−1, higher than that in the current study, possibly due to the greater number of sets performed. In contrast, a recent study comparing three different CWT through three sets of eight exercises identified a lower PBL value when the CWT was performed combined with running (5.8 ± 2.3), compared with that found in the CWT protocol with free weight (9.4 ± 3.2) and machines (10.7 ± 3.2) [22]. This shows that the accumulation of lactate is greater when performed in machines and with a higher load, as was done in the present study in SS (13.6 ± 2.6).
A similar intervention with the same variables as those in the present research, included a CWT using only the body weight of males and females on SS. Mean exercise EC was 289 ± 82.2 kcal in 28 minutes of activity (3 sets of the CWT), a value relatively close to the findings of the present research on a single circuit performed on SS (66.6 ± 7.8 kcal) and US (70.7 ± 10.0 kcal) over 7 minutes and 25 seconds. However, mean VO2 was higher compared with that in our study (27.8
± 5.4 mL·kg−1·min−1), likely due to the inclusion of more aerobic exercises. This idea is reinforced by the 6 mmol·L−1 PBL in that study, a lower result than our observations [24]. Indeed, in this study, the inclusion of single-joint exercises was done to develop a high level of intramuscular pressure, thereby restricting blood flow and consequently increasing the dependency of active muscle on anaerobic metabolism [24, 25].
The CWT is mainly characterized by the total absence or small rest intervals between sets, thereby featuring a high-intensity training. The acute effect of EC and PBL between the CWT and the traditional method was compared in a study [13] which found similarity for total and aerobic EC; however, anaerobic EC and PBL showed higher mean values in the traditional method (13.68 ± 3.4 kcal, about 12 mmol·L−1) relative to the CWT (12.3 ± 3.6 kcal, about 10 mmol·L−1). These findings may be due to the interval of 60 seconds between sets in two the training sessions. Contrary, in the present study, there was no interval between subsequent exertions, thereby explaining the higher anaerobic EC and PBL herein.
Despite the similar relative intensity in the two surfaces used in the present study (80% of 15RM) the absolute load was higher in the SS condition of exercise. Moreover, the highest total volume of load lifted by volunteers on SS produced a greater PBL in the CWT (p < 0.001).
The RPE is a variable used to obtain an estimate of exercise intensity and the degree of the subject’s tolerance for a certain action [20]. The central, muscular and full RPE in this study was higher on US compared with that on SS. This result reflects the increased difficulty that individuals experienced while performing the task on US. Corroborating with these findings, a previous study conducted in 14 trained subjects compared the bench press at 60% of 1RM on US (Swiss ball) and SS (flat bench). RPE using the Borg was significantly higher in exercises on US (p < 0.01). Others
describe higher RPE in push-up exercise and double leg hold, both performed on the Swiss ball, as compared with those on SS [15].
A study conducted only on SS in the CWT using the OMNI-RES scale found a lower result (5.9 ± 1.5) than our observations herein, probably due to the absence of load in CWT exercises [24].
According to the American College of Sports Medicine (ACSM), the daily EC recommended for physical activity is between 150 and 400 kcal [26]. Thus, the findings of this research show that resistance training practitioners with similar age, sex and anthropometrics to those studied herein, can use three CWT series in about 21 minutes to obtain an EC within the range recommended by the ACSM, both on SS and on US (ES was of medium magnitude < 0.80). The inclusion of a high-intensity CWT on US could be a tool for people seeking greater EC in little training time. Training with loads on US allows for lower overhead stress and may generate a high metabolic impact. Hence, this alternative type of exercise seems an acceptable alternative to traditional strength training.
In the current study, there was no electromyographic analysis, no goniometer assessment of the range of motion, and the absence of RPE anchorage. Moreover, no extrapolation of the data to other populations is enabled by the current analysis (i.e. sedentary, women, elderly or athletes).
5. Conclusion
The findings of this study showed that when circuit weight training is performed on a unstable surface, it elicits a higher energy cost and a higher rate of perceived exertion; when compared to the same training performed on a regular stable surface. These are promising data as a greater energy cost is often the major target of exercise programs. Moreover, the peak blood lactate was lower during exercise in the unstable surface, which may also be viewed as a pro factor to choose this type of exercise, Indeed, the lower lactic load may allow for a faster recovery post-training when the unstable surface is used.
In short, we conclude that circuit weight training on unstable surfaces can be performed with less weight as compared with stable surfaces, thereby lowering the mechanical stress on joints and bones, and still providing a high metabolic impact and potential greater benefits.
Acknowledgements
References
[1] S. Buitrago, N. Wirtz, U. Flenker, and H. Kleinoder. Physiological and metabolic responses as function of the mechanical load in resistance exercise. Appl Physiol Nutr Metab, vol. 39, pp. 345-350, March 2014.
[2] D. N. Vandenbrink, N. J. Petrella, E. V. Neufeld, B. A. Dolezal, and D. P. Maclennan. Metabolic responses to a loaded movement training workout. J Sports Med Phys Fitness, vol. 58, pp. 35-42, January 2018.
[3] M. J. Benton, G. T. Waggener, and P. D. Swan. Effect of Training Status on Oxygen Consumption in Women After Resistance Exercise. J Strength Cond Res, vol. 30, pp. 800-806, March 2016.
[4] R. L. Da Silva, M. A. Brentano, and L. F. Kruel. Effects of different strength training methods on postexercise energetic expenditure. J Strength Cond Res, vol. 24, pp. 2255-2260, August 2010.
[5] R. S. Pinto, R. Lupi, and M. A. Brentano. Metabolic responses to strength training: An emphasis on energy expenditure. Rev Bras Cineantropom Desempenho Hum, vol. 13, pp. 150-157, October 2011.
[6] P. Panza, J. M. Vianna, V. O. Damasceno, L. C. Aranda, C. M. Bentes, and J. Novaes. Energy cost, number of maximum repetitions, and rating of perceived exertion in resistance exercise with stable and unstable platforms. JEPonline, vol. 17, pp. 77-87, August 2014.
[7] A. R. Kelleher, K. J. Hackney, T. J. Fairchild, S. Keslacy, and L. L. Ploutz-Snyder. The metabolic costs of reciprocal supersets vs. traditional resistance exercise in young recreationally active adults. J Strength Cond Res, vol. 24, pp. 1043-1051, April 2010.
[8] J. M. Kohler, S. P. Flanagan, and W. C. Whiting. Muscle activation patterns while lifting stable and unstable loads on stable and unstable surfaces. J Strength Cond Res, vol. 24, pp. 313-321, February 2010.
[9] E. Zemkova. Instability resistance training for health and performance. J Tradit Complement Med, vol. 7, pp. 245-250, June 2016.
[10] S. Romero-Arenas, M. Martínez-Pascual, and P. E. Alcaraz. Impact of Resistance Circuit Training on Neuromuscular, Cardiorespiratory and Body Composition Adaptations in the Elderly. Aging Dis, vol. 4, pp. 256-263, October 2013.
[11] P. E. Alcaraz, J. Perez-Gomez, M. Chavarrias, and A. J. Blazevich. Similarity in adaptations to high-resistance circuit vs. traditional strength training in resistance-trained men. J Strength Cond Res, vol. 25, pp. 2519-2527, September 2011.
[12] V. M. Reis, R. S. Junior, A. Zajac, and D. R. Oliveira, Energy cost of resistance exercises: an uptade. J Hum Kinet, vol. 29, pp. 33-39, September 2011.
[13] R. R. Aniceto, R. M. Ritti-Dias, C. B. Scott, F. F. M. D. Lima, T. M. P. Prazeres, and W. L. D. Prado. Acute effects of different weight training methods on energy expenditure in trained men. Rev Bras Med Esporte, vol. 19, pp. 181-185, June 2013.
[14] B. L. Skidmore, M. T. Jones, M. Blegen, and T. D. Matthews. Acute effects of three different circuit weight training
protocols on blood lactate, heart rate, and rating of perceived exertion in recreationally active women. J Sports Sci Med, vol. 11, pp. 660-668, December 2012.
[15] P. Marshall, and B. Murphy. Changes in muscle activity and perceived exertion during exercises performed on a swiss ball. Appl Physiol Nutr Metab, vol. 31, pp. 376-383, August 2006.
[16] R. F. Bacurau, G. A. Monteiro, C. Ugrinowitsch, V. Tricoli, L. F. Cabral, and M. S. Aoki. Acute effect of a ballistic and a static stretching exercise bout on flexibility and maximal strength. J Strength Cond Res, vol. 23, pp. 304-308, January 2009.
[17] A. Cohen-Solal, T. Laperche, D. Morvan, M. Geneves, B. Caviezel, and R. Gourgon. Prolonged kinetics of recovery of oxygen consumption after maximal graded exercise in patients with chronic heart failure. Analysis with gas exchange measurements and NMR spectroscopy. Circulation, vol. 91, pp. 2924-2932, June 1995.
[18] C. B. Scott, B. H. Leighton, K. J. Ahearn, and J. J. McManus. Aerobic, anaerobic, and excess postexercise oxygen consumption energy expenditure of muscular endurance and strength: 1-set of bench press to muscular fatigue. J Strength Cond Res, vol. 25, pp. 903-908, April 2011.
[19] R. J. Robertson, F. L. Goss, N. F. Boer, J. A. Peoples, A. J. Foreman, I. M. Dabayebeh, and T. Thompkins. Children's OMNI scale of perceived exertion: mixed gender and race validation. Med Sci Sports Exerc, vol. 32, pp. 452-458, February 2000.
[20] R. J. Robertson, F. L. Goss, J. Rutkowski, B. Lenz, C. Dixon, J. Timmer, and J. Andreacci. Concurrent validation of the OMNI perceived exertion scale for resistance exercise. Med Sci Sports Exerc, vol. 35, pp. 333-341, February 2003.
[21] M. R. Rhea. Determining the magnitude of treatment effects in strength training research through the use of the effect size. J Strength Cond Res, vol. 18, pp. 918-920, November 2004.
[22] P. J. Benito, M. Alvarez-Sanchez, V. Diaz, E. Morencos, A. B. Peinado, R. Cupeiro, and N. Maffulli. Cardiovascular Fitness and Energy Expenditure Response during a Combined Aerobic and Circuit Weight Training Protocol. PLoS One, vol. 11, pp. 1-14, November 2016.
[23] Peinado, P. J. B., Sánchez, M. Á., Martínez, E. M., Coto, R. C., Molina, V. D., Lozano, A. B. P., & Montero, F. J. C. Aerobic and anaerobic energy expenditure in a circuit with loads at six different intensities. Rev Int Cienc Deporte, vol. 7, pp. 174-190, July 2011.
[24] K. M. Lagally, J. Cordero, J. Good, D. D. Brown, and S. T. McCaw. Physiologic and metabolic responses to a continuous functional resistance exercise workout. J Strength Cond Res, vol. 23, pp. 373-379, March 2009.
[25] L. A. Gotshalk, R. A. Berger, and W. J. Kraemer. Cardiovascular responses to a high-volume continuous circuit resistance training protocol. J Strength Cond Res, vol. 18, pp. 760-764, November 2004.