https://dx.doi.org/10.22161/ijels.4.3.34 ISSN: 2456-7620
Servqual model for the evaluation of the perceived
quality of social program services - FISE in the
Puno region
Dr. Juan Inquilla-Mamani
1, Dr. Gilberto Vilca - Cutipa
21Universidad Nacional del Altiplano Puno Perú.Professor - research assigned to the Registry of Researchers in Science and
Technology of the National System of Science, Technology and Technological Innovation - SINACYT -CONCYTEC Peru. 2Universidad Nacional del Altiplano Puno Perú. Head professor assigned to DINA and qualified by
- CONCYTEC – Peru.
Abstract— The purpose of the research is to assess the
level of quality perceived by users based on a "SERVQUAL Model" scale of the Social Energy Inclusion Fund (FISE) program implemented by the State in the Puno region. Method: a mixed study was carried out (quantitative - qualitative); of correlational descriptive type, in the Puno region of Peru. The statistical method SPSS v. 22, was used for processing, data processing and scientific tests. The materials used are documentary, electronic and statistical files of the program. Results: the research findings are evidenced in two aspects; First, the values of Alpha Crombach is statistically significant above 0.80, therefore, it means that the components and characteristics (attributes) analyzed allow to evaluate the quality of service offered by the FISE program. On the other hand, the analysis of the information collected through the Servqual questionnaire shows us that the variables that stand out in the user's decision process are reliability, responsiveness, security and empathy. Therefore, the service quality index (ICS) evaluated with the Servqual model is negative, the score reaches ( -1.03), which indicates that users expected a better service than that received from the FISE program in the Puno region. Keywords— Quality, components, perception, services and satisfaction.
I. INTRODUCTIÓN
Social programs, from the point of view of the State, constitute a set of strategies and direct and indirect actions with the population living in poverty and extreme poverty. From this perspective it is known that the user who has been admitted to a particular social program has had to meet certain selection criteria through a mechanism called targeting, this process is evaluated and validated by
SISFOH in the country. However, from the policy of the State, it has also been stated that for the improvement of the quality of goods and services, it is necessary and important to have a knowledge of the perception, positive or negative, that users of the services they receive may have. With an adequate evaluation, it is possible to determine how the State's efforts on the Social Inclusion Fund (FISE) in the Puno region are perceived. Therefore, it is important that social programs approach the measurement of user satisfaction, so that on the basis of this information the quality of service can be improved by the demands, needs and expectations of the population, so that, can help close existing gaps in the sector. This measurement requires the development of instruments that explore in a valid and reliable way those aspects related to quality that, after being analyzed and weighted, will allow making the improvement decisions that are deemed pertinent.
https://dx.doi.org/10.22161/ijels.4.3.34 ISSN: 2456-7620
management at different levels of government have been developed in several directions. First, there are those that analyze the efficiency of government from practical applications, which consider only certain ty pes of public spending. Then there are those studies that analyze the efficiency of the government in quantitative terms, using information on inputs (imputs) of government spending, but not of outputs (outputs). They are also found in the literature, efficiency analysis based on outputs only (Vásquez, E. 2013).
II. THEORETICAL FRAMEWORK 2.1.The Theory of the Factors in the Satisfaction of
the User / Client
Of the numerous existing definitions of customer satisfaction (Howard and Sheth, 1969, Hunt, 1977, Oliver, 1981, Churchill and Surprenant, 1982, Kotler and Dubois, 1993), the conception of satisfaction given by Evrard (1993) is adapted to the present study, that is, the client's satisfaction as "a psychological state resulting from a process of buying / going and consumption / use", because it is very general and does not include the reference base with which the client compares his experience of purchase and consumption, which is the subject of controversy among researchers. The satisfaction of the user / clien t is linked to each specific transaction, unlike the attitude toward a product or service that is general and can exist without there being a personal experience of purchase and consumption (Oliver, 1980, Evrard, 1993 Lewis and Mitchell, 1990). Perceived quality of service is similar to attitude towards a service (Boulding, Kalra, Staelin and Zeitharnl, 1993, Cronin and Taylor, 1992, Bitner, 1990, Churchill and Surprenant, 1982), and is not linked to each specific transaction as customer satisfaction, but it is a global or overall assessment of the service (Parasuraman, Zeitharnl and Berry, 1994).
Drucker (1990) observed that "quality is not what you put into a service; it's what the user gets from him and what he's willing to pay for. " It is understood that users do not buy a service for what the company offers, they do it to feel good or to solve their problems. It also notes that "users buy the benefits expectations that they think the organization will offer them" (p.21.). Cottle (1989) argues that the user, in the case of services, not only assesses the quality with respect to the service produced or the final product, but also the form in which it is supplied or delivered. The quality of services includes these two classifications, since they are part of what consumers expect and receive from a company (expectations and
perceptions). On the other hand, Parasuraman, Zeithmal and Berry (1990) define quality of service as the extent of the discrepancy or difference that exists between the expectations or desires of users and their perceptions.
2.2.Evaluati on of the quality of services
It is important to highlight that quality in services is an abstract and evasive concept, object of innumerable studies and investigations. The evaluation of quality in services is closely related to the expectation and satisfaction of the user, constituting the latter in the emotional and personal reaction to the service by the user. The services have their own characteristics such as intangibility, simultaneity and heterogeneity, characteristics that differentiate them from the products; thus, the quality control methods that are applied to the production of goods cannot be applied to obtain the quality of the services. Parasuraman, Zeithaml and Berry (1994), define the quality of service perceived as the global judgment of the client about the excellence or superiority of the service, resulting from the comparison between the expectations of the consumers (what they believe that the service companies must offer) and their perceptions about the results of the service offered. According to Schiffman and Lazar (2001), the SERVQUAL model is a powerful in-depth commercial research technique that allows a quality level measurement of any type of Service Company, allowing to know what expectations customers have and how they appreciate the service. Service, also g lobally diagnosed the service process object of study. These "gaps" are describid as follows:
Gap 1: indicates the discrepancy between the expectations of customers about a specific service and the perceptions or beliefs that managers form about what the consumer expects from that service.
Gap 2: measures the difference between managers' perceptions and specifications or quality standards.
Gap 3: calculates the difference between the specifications or standards of service quality and service provision.
Gap 4: measures the discrepancy between the provision of the service and external communication. All the mentioned deficiencies make that the service provided by the organization does not cover the expectations that the clients had placed in it, producing the service;
https://dx.doi.org/10.22161/ijels.4.3.34 ISSN: 2456-7620
Gap5 = f(Gap 1, Gap 2, Gap 3, Gap 4).
Yanhong and Kaye (1999) develop a longitudinal study with the same objective of the previous study in a course of Civil Engineering and another of Mathematics. However, this work focused on the version of SERVQUAL intended only for the evaluation of teaching characteristics, which are asked by students. Based on the original SERVQUAL model, Oh (1999) exposes a hypothesis to measure the quality of service and user satisfaction, including new measurement variables such as the in tention to repurchase and mouth-to-mouth communication, generating a model of its own, which Analyzes by means of structural equations, differentiating from SERVQUAL by not including the measurement of expectations. In the same line there are studies of (Flores, 2003; Inquilla, 2017) using the Servqual model through a Likert scale questionnaire to collect the estimates of the users (student, teachers and non-teaching staff) with respect to the dimensions or academic-administrative quality service attributes offered by universities. In both studies, the inefficiency and treatment of the administrative staff were found among the indicators of greatest dissatisfaction; information about agreements, scholarships and others; the equipment of the classrooms; and the teacher's mastery over the subject he or she dictates.
Salazar Luna, G. (2006), conducted an investigation with the purpose of evaluating the "quality of service received by patients seen in two private clinics in Metropolitan Lima" (whose names we will keep in reserve). The sample population of the study was 30 patients who attended the Dental Clinic A and 30 patients who attended the Dental Clinic B in October 2005. The SERVQUAL scale adapted to the dental field was used to measure the quality of service in the two clinics, through the difference between expectations and satisfaction. In the Dental Clinic A, the dimension of tangible aspects and the dimension of empathy obtained the lowest SERVQUAL scores, while the dimension of reliability and the dimension
of safety obtained the highest scores in the five evaluated dimensions. In the Dental Clinic B, the dimension of security and the dimension of empathy obtained the lowest SERVQUAL scores, while the dimension of tangible aspects and the dimension of reliability obtained the highest scores in the five evaluated dimensions.
2.3.The SERVQUAL Model and its applicability The purpose of the SERVQUAL model is to measure the quality of the service from the perspective of the user / client. It consists of two estimates: the analysis of perceptions, of 22 items and the analysis of expectations, also of 22 items. (Parasuraman, Zeithaml, & Berry, 1993). The responses of the users are measured through the Likert scale. The same author, using the data from a trial, improved the descriptive measures such as the means and standard deviations of the SERVQUAL items, as well as the reliability coefficients (alpha coefficients), by means of the scores obtained as a result of the difference between perceptions and expectations for the five proposed dimensions, that is, tangibility, reliability, responsiveness, security and empathy (Feigembaum, AV (1986).) These changes allowed the instrument to be refined and re-examined and confirmed its reliability and validity. once the instrument has been refined, they suggest that the revision of SERVQUAL can be conceptualized in the following way:
Dónde:
• Q*i is the overall perceived quality of the customer i in the "Revised SERVQUA L”; • k is the number of attributes, 22 in this case; • Pijis the perception of the result of client i with
respect to attribute j;
• E*ijis the revised expectation of quality of service of the attribute j for the client i.
https://dx.doi.org/10.22161/ijels.4.3.34 ISSN: 2456-7620
The SERVQUA L scale is a Service Quality Model developed by Parasuraman, et al. (1990) whose purpose is to improve the quality of service offered by an
organization. It uses a standard questionnaire that evaluates the quality of service along five dimensions: reliability, responsiveness, security, empathy and tangible elements. It consists of a multiple response scale designed to understand the expectations of customers regarding a service. It allows to evaluate, but it is also an instrument for improvement and comparison with other organizations.
Summary of quality dimensions (Servqual)
CRITERIA DEFINITIONS
ELEMENTS TANGIBLES
Appearance of physical facilities, equipment, personnel and materials communication systems.
RELIABILITY Ability to execute the promised service reliably and carefully.
ATTENTION TO THE USER
AND SECURITY
Possession of the required skills and knowledge of the execution of the service and absence of danger, risks or doubts.
CAPACITY OF ANSWER
Provision to help customers and provide them with a fast, accessible and easy to contact service.
EMPATHY
Attention consideration, respect, friendliness of the contact staff, make the effort to know the users and their needs, know how to listen.
2.4.Social Energy Inclusion Fund (FISE)
The Social Energy Inclusion Fund (FISE) is created with Law N ° 29852 in April of 2012, with the purpose of bringing less polluting energy to more vulnerable populations throughout the country. At present it has four purposes:
The massification of natural gas for homes and vehicles.
The expansion of the energy frontier using renewable energy.
Promotion for access to LPG (domestic gas balls) in vulnerable urban and rural sectors.
The compensation mechanism of the residential electricity tariff.
Beneficiaries
The fund is aimed at people who belong to the vulnerable sector of Peru, whether in the rural or rural-urban sector. Each of the three purposes of the FISE will have a specific beneficiary profile. That is, the requirements to receive the benefit in the massification of natural gas can be very different from those established in the expansion of the energy frontier.
Users of the FISE Discount Voucher
It is a discount coupon of 16 soles that is used to buy a domestic gas balloon (LPG) of up to 10 kg with a reduced price. The voucher has a validity period of two (2) months and can only be exchanged in authorized places, can be beneficiaries of the voucher:
Residential electricity users with average annual consumption less than or equal to 30 KWh and who have LPG cooking.
Residential electricity users with average annual consumption less than or equal to 30 KWh and who do not have LPG cooking.
People who are included in strata 1 to 5 of SISFOH and do not have residential electricity service but do have a LPG stove.
People who are included in strata 1 to 5 of the SISFOH and who do not have residential electricity service or a LPG stove, but have access to LPG consumption facilities.
The requirements to access this benefit
The average monthly consumption calculated on the basis of the last 12 months must be less than or equal to 30 kw.h. and you must have a kitchen with LPG. Register in the list of beneficiaries FISE of the Electrical Distributor, for it you will have to deliver all the requirements that this indicates you in the informative notice. This notice will arrive at your address along with your electricity bill. The documents that you must deliver are the following:
National Identity Document (DNI).
An affidavit of possession and use of LPG cooker and balloon, authorizing its verification.
Present the electricity consumption receipt. The list of registered users in the provisional
service request. This requirement only applies to provisional and collective supplies.
Form of exchange of the FISE voucher
https://dx.doi.org/10.22161/ijels.4.3.34 ISSN: 2456-7620
it. The beneficiary can take his LPG gas ball of 10 kilos with 16 new soles of discount. To do this, the beneficiary must carry his / her ID and must also sign on the back of the voucher. If you had electricity service you should show your receipt. And if another person must attach a copy of the ID of the beneficiary or present the original DNI.
In the perspective of modernization of the program, a digital FISE voucher is being implemented, it is a code printed on the beneficiary's electricity bill, which represents the traditional Vale FISE. The difference is that the traditional voucher (or physical voucher) was attached to the electricity bill and was exchanged manually. The Digital FISE voucher is printed on the same receipt and exchanged with a text message through a cell phone. This process is applied in the geographical area where the Authorized Agents have fixed or mobile telephony coverage to exchange the FISE Digital Voucher; otherwise, the distribution of FISE Discount Vouchers (physical) will continue, in accordance with current regulations.
Authorized agents
The Authorized Agents are the places where you can make the exchange of the voucher to buy a LPG balloon, you must be in the list of Hydrocarbon Companies, as authorized to sell bottled LPG to the final consumer. Have an agreement signed with the Electric Distribution Company. For beneficiaries who have electricity supply, they should request:
FISE discount voucher
DNI (National Identity Document) Electricity consumption receipt
For beneficiaries who do not have electricity, they should request:
FISE discount voucher
The Authorized agent can exchange the FISE discount voucher to another person who is not the holder and / or beneficiary, but in that case the person making the exchange must attach a copy of the beneficiary's DNI or present the original DNI of said beneficiary. The authorized agent must have a record that, in these cases, allows the name and ID of the beneficiary of the FISE and of the person who represents the exchange or purchase of the gas balloon with the discount voucher to be consigned.
Electric distribution companies
The obligations of the Electric Distributors are to issue the FISE discount voucher in order to distribute it to the FISE Beneficiaries, the Electric Distributors, within the first 20 calendar days of the month, they will present the
FISE liquidations to the Administrator (Osinergmin), adapt their commercial system in order to facilitate the distribution and control of the granting of the FISE Discount Voucher. The referred beneficiaries must deliver to the electricity distribution companies the following:
The National Identity Document (DNI).
An affidavit of possession and use of LPG cooker and balloon, authorizing its verification.
Present the electricity consumption receipt. The list of registered users in the provisional
service request. This requirement only applies to provisional and collective supplies.
Electrical distribution companies must verify the accuracy of the information given in the previous number, for which they will carry out confirmatory inspection visits.
Electric distribution companies must purge their respective database ensuring that duplicities in the benefit are avoided, since the holder of the supply can only receive a FISE discount voucher per month.
III. METHODOLOGY
3.1.Materials.
Panel data review of the FISE Program Review of books, magazines, Internet, among
others
Monitoring reports and annual reports of the FISE program.
Database of ENAHO / INEI / ENDES, (2015-2017)
The statistical package SPSS v. 22
3.2.Method.
This research is of a mixed nature (quantitative and qualitative) and has a non - experimental - transversal design of a descriptive - correlational nature, given that the information has been taken in the natural context of the population to then make the pertinent analyzes (Hernánd ez, et al. to 2010). In order to measure the levels of satisfaction of the perceived quality and based on it, the components or factors that are related to the quality of service were determined.
3.3.Procedure and data analysis
https://dx.doi.org/10.22161/ijels.4.3.34 ISSN: 2456-7620
have been processed in Statistical Software SPSS v. 22. The independent variables are the components and characteristics (attributes) of quality of the services that will be quantified based on the answers obtained from the agents or actors that use the services. In addition to the components of the SERVQUAL Model to measure the perceived quality and the dependent variable is the perceived quality of the services offered by the FISE program, which will also be measured based on the answers given by the users. For the case of the study, a simple random sample was used among the users of the FISE program, taking into account the number of beneficiaries by provinces in the Puno region.
Definition of the study sample
Error range 5.0%
Population size 91720
Confidence level 95%
Value of Z (value of confidence level) 95% Variance (value to replace in the formula) 1.960
Sample size 283
αc= Value of confidence level e2=Error range
N=Population size universe
IV. RESULTS
4.1.Socioeconomic, sociodemographic and socio-educational characteristics of the beneficiaries of the FISE program in the Puno region.
The distribution of the user population of the FISE program, according to socioeconomic aspects, behaves as follows: 54.04% are in extreme poverty or the poorest in the region. While 21.09% corresponds to the second quintile, another group of beneficiaries of the FISE program are in the third quintile with 12.00% and finally, the beneficiary group that is in the fourth quintile represents 10.07%, the latter is considered as filtering . To know the distribution of income within the Puno region, we used the Quintiles de Ingresos (ENAHO, 2018) method, which divides the population into four more or less equal groups. The first quintile groups the poorest, that is, those with the least income and the fourth quintile, the ones with the highest income (see Table 01).
The data reveal that in the province of Moho the beneficiaries of the FISE program are poorer, they are located in the first quintile (100%), and in the province of Sandia only 20% of the beneficiaries correspond to the first quintile (poorest) and 40% are located in the fourth quintile. Another important aspect that can be o bserved is that, in Carabaya province, FISE users are in quintiles I, II and III respectively. In the Puno region, beneficiaries of the FISE program are generally characterized by having both the very poor and the less poor.
Table n ° 01. Quintile of the poverty index of FISE beneficiaries, according to provinces of the Puno region
More poor Second quintile Third quintile
Fourth quintile
Puno N° 7 1 2 0 10
% PROVINCE 70,0% 10,0% 20,0% 0,0% 100,0%
Huancané N° 17 12 3 2 34
% PROVINCE 50,0% 35,3% 8,8% 5,9% 100,0%
Azangaro N° 15 10 4 3 32
% PROVINCE 46,9% 31,3% 12,5% 9,4% 100,0%
Malgar N° 11 7 2 1 21
% PROVINCE 52,4% 33,3% 9,5% 4,8% 100,0%
San Antonio de Putina
N° 39 10 7 8 64
% PROVINCE 60,9% 15,6% 10,9% 12,5% 100,0%
Sandia N° 1 1 1 2 5
% PROVINCE 20,0% 20,0% 20,0% 40,0% 100,0%
Carabaya N° 11 7 4 0 22
% PROVINCE 50,0% 31,8% 18,2% 0,0% 100,0%
Chucuito N° 4 0 2 3 9
% PROVINCE 44,4% 0,0% 22,2% 33,3% 100,0%
https://dx.doi.org/10.22161/ijels.4.3.34 ISSN: 2456-7620
% PROVINCIA 54,5% 16,4% 12,7% 16,4% 100,0%
Lampa N° 2 2 0 1 5
% PROVINCE 40,0% 40,0% 0,0% 20,0% 100,0%
Moho N° 2 0 0 0 2
% PROVINCE 100,0% 0,0% 0,0% 0,0% 100,0%
Yunguyo N° 15 3 2 4 24
% PROVINCE 62,5% 12,5% 8,3% 16,7% 100,0%
Total N° 154 62 34 33 283
% TOTAL REGIÓN 54,4% 21,9% 12,0% 11,7% 100,0%
Source: ENAHO and statistics of the FISE 2018 program
The Social Energy Inclusion Fund (FISE) was created as an Energy Compensation System, which provides security to the system, as well as a scheme of social compensation and universal service for the most vulnerable sectors of the population. Households located in the provinces and districts with the highest level of poverty, according to the latest poverty map published by the INEI.
Table No. 02. Age of the beneficiaries of the program FISE in the Puno region
Age groups Frequency Percentage
20 - 30 28 9,9
31 - 40 66 23,3
41 - 50 112 39,6
51 A MÁS 77 27,2
Total 283 100,0
Source: own elaboration of the researcher based on the surveys
The results by age groups show that the beneficiary population of the program is mostly concentrated in the range of 20 - 30 years of age with 9.9%, followed by the age group of 31 - 40 years with 23.03%, in greater percentage the age groups 41 - 50 years of age are located and 27.2% are those that are in the age group of 51 or more. It should be mentioned that in the case of socio-educational information of the user population of the FISE program, the highest percentage are those who have completed initial level or Wawa Wasi with
27.9%, another segment of the population have incomplete primary education 26.9%, while 24.4% of the user population have reached the full primary level. Therefore, the population that is in the primary levels is the majority (see table 03).
Table No. 03. Socio-educational information of the beneficiaries
of the FISE program.
Level of education reached N° %
No level 25 8,8
Initial or Wawa Wasi 79 27,9
Incomplete primary 76 26,9
Complete primary 69 24,4
Incomplete secondary 12 4,2
Completed secondary 17 6,0
Superior non-university incomplete 4 1,4 Superior non-university complete 1 ,4
Total 283 100,0
Source: own elaboration of the researcher based on the surveys
https://dx.doi.org/10.22161/ijels.4.3.34 ISSN: 2456-7620
Source: own elaboration based on statistical data of the FISE 2018 program.
Households located in the regions, provinces and districts with the highest level of poverty, according to the latest poverty map published by the INEI. Level of consumption: Residential users with average monthly consumption equal to or less than 30 kWh / month (12 months) who have a LPG stove. The program to promote the use of LPG (domestic gas) for vulnerable populations encourages the use of less polluting energy resources to replace firewood or dung in order to reduce the impact on the health of these populations. The operation of this program is based on:
• Strategic alliances and coordination with different public and private actors,
• Use of cutting-edge information technology and communications platforms.
The Energy Needs Census made it possible to collect information in a dynamic way and obtain the geographical location through the Global Positioning System (GPS) and upload photographs that allow its validation, by the residents of the designated districts. The FISE is aimed at expanding the energy fron tier in the
vulnerable segments of the population that is, bringing energy to localities or population centers that do not have an energy supply, through supplies of hydrocarbons, natural gas, and renewable energies, among others. The final uses in lighting, cooking, heating, cooling and / or productive uses.
4.2.Analysis of components and quality characteristics of the services offered by the FISE Puno region program.
Based on the available information, the corresponding analyzes were carried out in order to identify the level of quality that users attribute to each of the components in the service quality scale. For this, the linear regression analysis was applied, using the dependent variable global quality perceived, calculated with the average of all the items of the scale, and the set of attributes of each of the five service quality dimensions as independent variables. This analysis allows us to recognize to what extent the dependent variable, perceived global quality can be explained by the attributes of the dimensions of the scale.
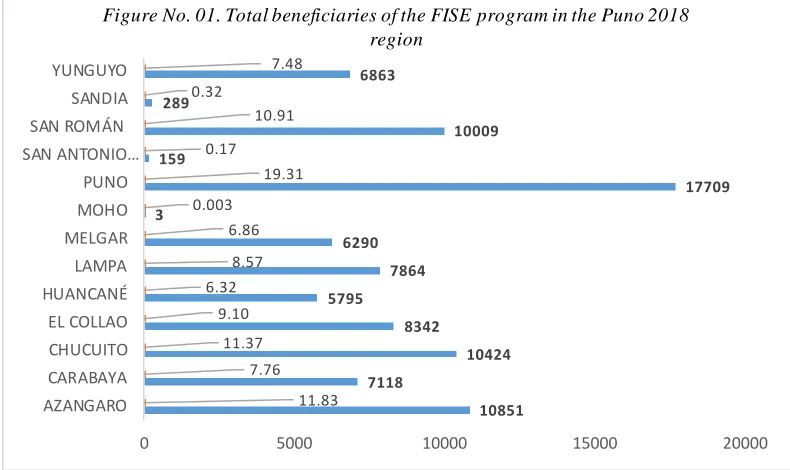
10851 7118
10424 8342
5795 7864 6290 3
17709 159
10009 289
6863
11.83 7.76 11.37 9.10 6.32
8.57 6.86 0.003
19.31 0.17
10.91 0.32
7.48
0 5000 10000 15000 20000
AZANGARO CARABAYA CHUCUITO EL COLLAO HUANCANÉ LAMPA MELGAR MOHO PUNO
SAN ANTONIO…
SAN ROMÁN SANDIA YUNGUYO
https://dx.doi.org/10.22161/ijels.4.3.34 ISSN: 2456-7620
Table 04. Components and quality characteristics of the services of the FISE Puno region
Components
Expecte d value (a)
Perceived value
(b) Gap
(b-a)
Average Desv.
Estand.
Average Desv. Estand.
TANGIBILITY 4.12 0.601 3.30 0.476 -0.82
SECURITY 4.33 0.574 2.85 0.428 -1.48
RELIABILITY 4.90 0.505 2.60 0.497 -2.30
ANSWER'S CAPACITY
3.87 0.584 3.09 0.490 -0.78
EMPATHY 3.96 0.471 3.03 0.265 -0.93
Source: own elaboration of the researcher based on the 2018 surveys
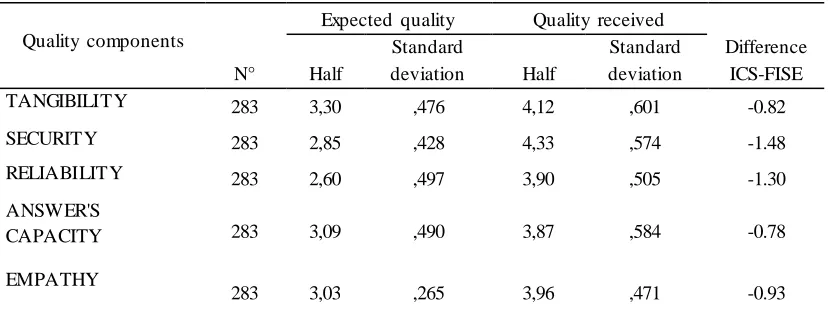
When analyzing the quality components in the FISE program, presented in Table 04, the differences in the values between the perceived and expected quality in the different components are evidenced: Component tangibility (-0.82), followed by the Safety component (-1.48) ), while the Reliability component presents a gap of (-2.30); On the other hand, the components that would be better qualifying the services are: the response capacity and empathy (-0.78 and -0.93). Likewise, the highest average in the expected values is located in the Reliability component (4.90), followed by the Security component with a value of (4.33) and the Tangibility component has an average of (4.12). On the other hand, in the perceived values, the component with the highest average is: the Response capacity (3.09), and the component with the lowest average corresponds to the Reliability component (2.60).
4.3.Reliability analysis of quality components This analysis will allow us to verify its conclusions and estimate an index of reliability of each scale or dimension. The reliability of the attributes of the instrument (quality component or attribute), subject to working conditions or data collection on quality of service, is the probability that it will work correctly ("internal consistency" without failure) during the period of studying time. Thus, reliability is a fundamental aspect of the quality of all types of measuring instruments. For this reason, it is especially interesting to quantify this reliability, so that it is possible to make estimates about the quality of service provided by the FISE program. To determine the reliability of the quality of service measurement instrument, the results of the scoring matrix were subjected to a reliability analysis, calculated through the SPSS v. Program. 22 the
reliability coefficient for political-economic measuring instruments, given that the questionnaire used to collect data is composed of questions or items with several response alternatives with ordinal variables. The calculation of the reliability measurement process was used the Crombach test. From the variances, Cronbach's alpha is calculated as follows:
Donde:
is the variance of item i,
is the variance of the total values observed and
is the number of questions or items.
4.4.Quality measurement procedure
To calculate the Reliability coefficients of the instrument, we proceeded as follows:
The items that will be subjected to the analysis were selected
The scores or values obtained for each item allow us to find the mean and then the value of the variance and standard deviation of the items.
Based on the correlations between the items, the standardized Cronbach's alpha is calculated as follows:
Donde:
https://dx.doi.org/10.22161/ijels.4.3.34 ISSN: 2456-7620 is the average of the linear correlations
between each of the items (we will have [k (k-1)] / 2 pairs of correlations).
The desirable thing to create a reliable scale is that the items are highly correlated with each other. The maximum level of correlation is reached when the items X1, ..., Xk are all equal. The Cronbach's alpha is not a statistic to use, so it is not accompanied by any p -value that allows rejecting the hypothesis of reliability in the scale. However, the closer to its maximum value 1, the greater the reliability of the scale. In addition, in certain contexts and by tacit agreement, it is considered that alpha values higher than 0.7 or 0.8 (depending on the source) are sufficient to guarantee the reliability of the scale.
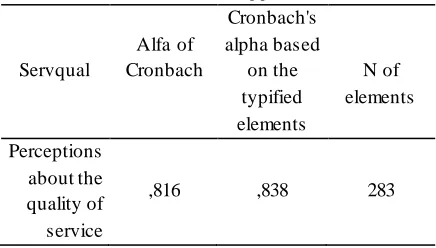
Table No. 05. Reliability analysis of the instrument SERVQUAL applied
Servqual
Alfa of Cronbach
Cronbach's alpha based
on the typified elements
N of elements
Perceptions about the quality of service
,816 ,838 283
Source: own elaboration of the researcher based on survey data
The truth is that the criterion established and indicated by different authors (Oviedo & Campo -Arias, 2005) is that a value of Cronbach's alpha, between 0.70 and 0.90, indicates a good internal consistency for a one-dimensional scale, therefore, it can be argue that the internal validity of the instrument is very good (0.816). Cronbach's alpha appears like this, frequently in the literature, as a simple and reliable way to validate the construct of a scale and as a measure that quantifies the correlation between the items that make up this scale. Authors such as (Gadermann, Guhn, & Zumbo, 2012) even report that Cronbach's alpha has been cited in 76% of cases of Social Science articles to demonstrate the validity of the tests.
Hypothesis 1:
The components and characteristics (attributes) of the services that allow validating the evaluation of perceived quality is associated with the tangible elements, security, reliability, response capacity and empathy offered by the FISE social program in the Puno region.
Ho: Fc ≤ Ft; The components and characteristics (attributes) of the Servqual model do not allow to evaluate the perceived quality of the services offered by the FISE program in the Puno region.
Ha: Fc> Ft; The components and characteristics (attributes) of the Servqual model allow to evaluate the perceived quality of the services offered by the FISE program in the Puno region.
According to the results of validity analysis of the measuring instrument, they are very positive and reliable. The values of Alpha Crombach is statistically significant above 0.80, therefore, it means that the components and characteristics (attributes) analyzed if they allow to evaluate the quality of service offered by the FISE Puno program. Based on these considerations, we can assume that the quality attributes considered in the model are valid at a convergent-type construct level, that is, the items of the Servqual model survey.
Table No. 06. Lik ert scale to measure the quality perceived by the user.
Likert scale (Servqual)
Meaning
Satisfaction score range
1 Very unsatisfied 01 – 20
2 Dissatisfied 21 – 40
3 Neither satisfied, nor dissatisfied
41 – 80
4 Satisfied 81 – 100
5 Very satisfied 101 - 105
Source: own elaboration of the researcher based on data from the 2018 survey
4.5.Analysis of the perceived and expected quality of the user on the services of the FISE program by dimensions
https://dx.doi.org/10.22161/ijels.4.3.34 ISSN: 2456-7620
service, the found values were 4.24 as an expected value on average that is equivalent to 84.04% of the total score. Using the data of the survey, the quality index was calculated, using the standards of SERVQUAL items, as well as the reliability coefficients (alpha coefficients mentioned above), by means of the scores obtained as a result of the difference between perceptions (service received) and expectations (expected service) for the five proposed dimensions, that is, tangibility, reliability, responsiveness, user service and security and empathy.
Once this procedure is concluded, the Service Quality Index (ICS) is calculated for each dimension, based on the items that comprise it, for comparison purposes, for which the following formula is used:
Dónde:
• Q*i is the overall perceived quality of the customer i in the "Revised SERVQUA L”; • k is the number of attributes, 22 in this
case;
• Pij is the perception of the result of client i with respect to attribute j;
• E*ij is the revised expectation of quality of service of the attribute j for the client i.
ICS global= Σi IC
The interpretation of the result of the index is based on the fact that, if it is a negative number, it indicates that the expectations (expected service) are greater than the perceptions (services received), if the number is positive, it indicates that the users' perceptions are above expectations, which means that the services offered by the program, if it is meeting your expectations with the percentage obtained.
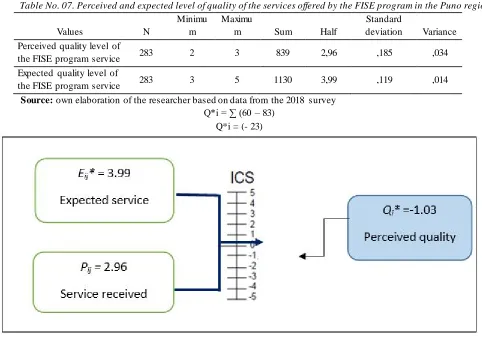
Table No. 07. Perceived and expected level of quality of the services offered by the FISE program in the Puno region.
Values N
Minimu m
Maximu
m Sum Half
Standard
deviation Variance Perceived quality level of
the FISE program service 283 2 3 839 2,96 ,185 ,034
Expected quality level of
the FISE program service 283 3 5 1130 3,99 ,119 ,014 Source: own elaboration of the researcher based on data from the 2018 survey
Q*i = ∑ (60 – 83) Q*i = (- 23)
Figure No. 02. Service quality index offered
https://dx.doi.org/10.22161/ijels.4.3.34 ISSN: 2456-7620
The analysis of the information collected through the Servqual questionnaire allows an overview of the service received and the quality of service criteria within the scope of the FISE program. In this regard, it should be noted that users, on the other hand, develop habits of conduct influenced by the need when choosing the service to perform. Regarding the variables that intervene in the decision process of the user, it is important to emphasize the importance that is given to the proximity to their homes. Therefore, the ICS evaluated with the Servqual model is negative, the score reaches (-1.03), which indicates that users expected a better service than what was
received, these results are shown in greater detail (see figure 2).
Regarding the construct of quality of service, we observe how basically the service provision activity is developed from five large dimensions that we have identified as: Tangibility, Security, Reliability, Resp onse Capacity and Empathy. Finally, we identified the need to analyze the items of specific scale that allow a diagnosis of the service provided by agents authorized by the FISE program. Regarding the comparison measurement procedure, it has become clear that it is useful, for this type of services, to measure expectations.
Table No. 08. Index of differences between users' perceptions and expectations about quality services offered by the FISE program.
Quality components
N°
Expected quality Quality received
Difference ICS-FISE Half
Standard
deviation Half
Standard deviation
TANGIBILITY 283 3,30 ,476 4,12 ,601 -0.82
SECURITY 283 2,85 ,428 4,33 ,574 -1.48
RELIABILITY 283 2,60 ,497 3,90 ,505 -1.30
ANSWER'S
CAPACITY 283 3,09 ,490 3,87 ,584 -0.78
EMPATHY
283 3,03 ,265 3,96 ,471 -0.93
Source: own elaboration of the researcher based on data from the 2018 survey
In this perspective, it is important to consider an analysis of service quality, taking into account each dimension and the indicators that it encompasses. The observation is basically focused on five large dimensions that we have identified as: Tangibility, Reliability, User Attention and Safety, Response Capacity and Empathy .
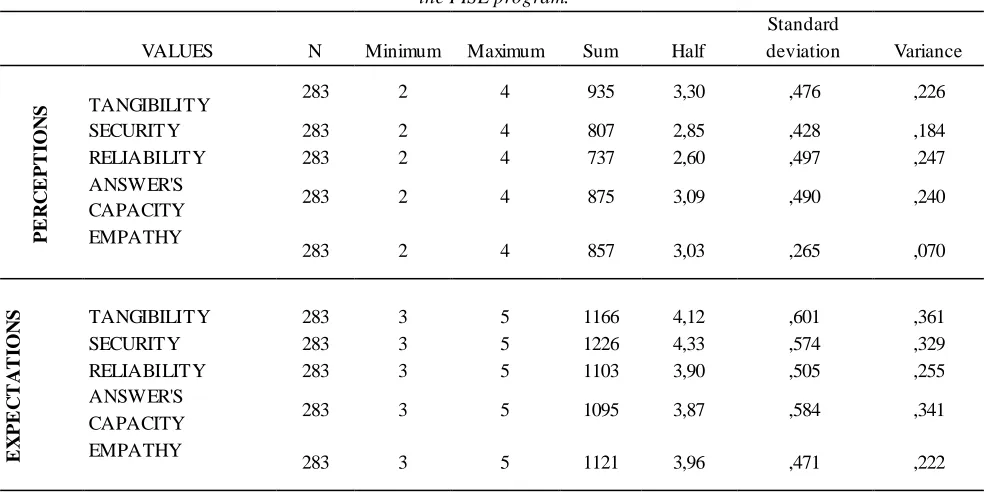
4.6.Analysis of descriptive statistics of the perceptions and expectations of users
In this part of the research content we describe a set of variables and try to synthesize their characteristics in numerical indexes that adequately represent this set of
https://dx.doi.org/10.22161/ijels.4.3.34 ISSN: 2456-7620
Table No. 09. Statistical values descriptive of the perceptions and expectations of the users about the quality services offered by the FISE program.
VALUES N Minimum Maximum Sum Half
Standard
deviation Variance
P
E
R
C
E
P
T
IO
N
S TANGIBILITY
283 2 4 935 3,30 ,476 ,226
SECURITY 283 2 4 807 2,85 ,428 ,184
RELIABILITY 283 2 4 737 2,60 ,497 ,247
ANSWER'S
CAPACITY 283 2 4 875 3,09 ,490 ,240
EMPATHY
283 2 4 857 3,03 ,265 ,070
E
X
P
E
C
T
A
T
IO
N
S TANGIBILITY 283 3 5 1166 4,12 ,601 ,361
SECURITY 283 3 5 1226 4,33 ,574 ,329
RELIABILITY 283 3 5 1103 3,90 ,505 ,255
ANSWER'S
CAPACITY 283 3 5 1095 3,87 ,584 ,341
EMPATHY
283 3 5 1121 3,96 ,471 ,222
Source: own elaboration of the researcher based on data from the 2018 survey
In table N ° 09, we have the results of the standard deviation, it is a measure of dispersion that allows us to evaluate the uncertainty of the data obtained by the sample; that is, it analyzes all those data that are far from our average to determine if our prediction or theory is far from the model that was built with the sample. With the distribution measures we want to know how much the perceptions on the quality of service received by users vary, for which a Likert scale has been used, taking into account the (ordinal) variables that vary their values from minus to more, that is, from very dissatisfied to very satisfied (1 to 5) to establish the level of satisfaction with the service received.
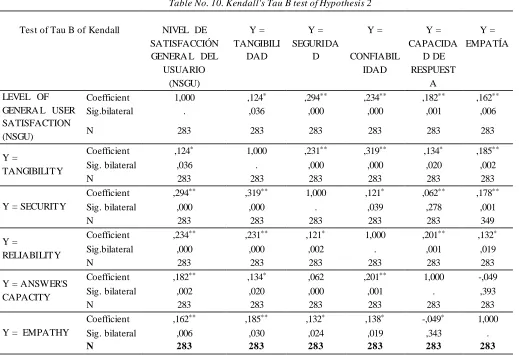
4.7.Analysis of Kendall's Tau_b Test of Hypothesis 2.
The Coefficient of the Tau test of Kendall shows us the degree of association between the independent variables (attributes and / or quality dimensions) with the dependent variable (level of general satisfaction of the user) on the quality of service of the program. The model of the equation is given by the following expression:
τ= (Sa – Sb) / [n(n -1) / 2] Where:
τ= Statistics of Kendall n = No. of cases in observed
Sa = Sum of the highest ranges Sb = Sum of lower ranges
Hypothesis 02:
The level of quality perceived by users about the offer of liquefied gas services that deliver the FISE program, is related to the characteristics of the components and the satisfaction of the service received.
Ho: Fc ≤ Ft; The perceived quality level of the liquefied gas service offer that is delivered by the FISE program is not associated with the attributes of the quality dimensions for the users.
Ha: Fc> Ft; The perceived quality level of the liquefied gas service offered by the FISE program is associated with the attributes of the quality dimensions for the users.
For the set of quality dimensions considered by the Servqual model, n attributes evaluated by m users are taken
https://dx.doi.org/10.22161/ijels.4.3.34 ISSN: 2456-7620
Table No. 10. Kendall's Tau B test of Hypothesis 2
Test of Tau B of Kendall NIVEL DE SATISFACCIÓN GENERA L DEL
USUARIO (NSGU)
Y = TANGIBILI
DAD
Y = SEGURIDA
D
Y =
CONFIABIL IDAD
Y = CAPACIDA
D DE RESPUEST
A
Y = EMPATÍA
LEVEL OF GENERA L USER SATISFACTION (NSGU)
Coefficient 1,000 ,124* ,294** ,234** ,182** ,162**
Sig.bilateral . ,036 ,000 ,000 ,001 ,006
N 283 283 283 283 283 283
Y =
TANGIBILITY
Coefficient ,124* 1,000 ,231** ,319** ,134* ,185**
Sig. bilateral ,036 . ,000 ,000 ,020 ,002
N 283 283 283 283 283 283
Y = SECURITY
Coefficient ,294** ,319** 1,000 ,121* ,062** ,178**
Sig. bilateral ,000 ,000 . ,039 ,278 ,001
N 283 283 283 283 283 349
Y =
RELIABILITY
Coefficient ,234** ,231** ,121* 1,000 ,201** ,132*
Sig.bilateral ,000 ,000 ,002 . ,001 ,019
N 283 283 283 283 283 283
Y = ANSWER'S CAPACITY
Coefficient ,182** ,134* ,062 ,201** 1,000 -,049
Sig. bilateral ,002 ,020 ,000 ,001 . ,393
N 283 283 283 283 283 283
Y = EMPATHY
Coefficient ,162** ,185** ,132* ,138* -,049* 1,000
Sig. bilateral ,006 ,030 ,024 ,019 ,343 .
N 283 283 283 283 283 283
*. The correlation is significant at the 0.05 level (bilateral). ** The correlation is significant at the 0.01 level (bilateral).
In order to establish the exact nature of the relationship, the Kendall Tau_b Coefficient was estimated. The values found in Table 10 can be established that there is a high and positive correlation, with a significance of less than (p = 0.05), in all the dimensions treated, this implies then, that as the attributes or components in the proposed dimensions improve, the level of general satisfaction (NSG) on the quality of services delivered by the FISE program in the Puno region will improve. When analyzing the values of Kendall's Tau b coefficients, the following detail is taken for dimensions: As for the attributes or quality components in the "Tangibles" component, the values of τ indicate that there is a high and positive correlation ( τ = 0.124 *), with a significance of (p = 0.036), which means that as the quality attributes in the dimension of tangible elements improve, the level of general satisfaction of the user improves in the same direction, that is, There is a relationship of agreement between both variables. On the other hand, in the
"Security" component, the value of (τ = 0.294 **) at a level of significance (p = 0.000), that is, 29.4% of the improvement in the level of general satisfaction of the user is addressed with the changes in security attributes.
https://dx.doi.org/10.22161/ijels.4.3.34 ISSN: 2456-7620
Therefore, considering the values obtained in the test, it can be concluded that the null hypothesis is rejected and the alternative hypothesis is accepted, that is, the level of quality perceived by users about the services of the FISE program is associated to the attributes and components of the silver quality dimensions in the study.
4.8.Factors or components of perceived and expected quality of the services of the FISE program.
Factor Analysis is a multivariate statistical technique whose main purpose is to synthesize the interrelations observed among a set of variables in a concise and safe way as an aid to the construction of new concepts and theories. To do this, it uses a set of unobservable random variables, which we will call common factors, so that all covariances or correlations are explained by these factors and any portion of the variance unexplained by the common factors is assigned to residual error terms that we will call unique factors or specific. Analyze the structure of the interrelations between a larg e number of variables, not requiring any distinction between dependent and independent variables. A Factor Analysis makes sense if two conditions are met: Parsimony and Interpretability. The model of the Factorial Analysis is given by X1, X2, ..., Xp the p variables object of analysis that we will suppose in all the following, that are typified.
A possible way of examining the correlation matrix is through Bartlett's sphericity test, which contrasts, under the multivariate normality hypothesis, if the correlation matrix of the observed variables, Rρ, is identity. If a correlation matrix is the identity it means that the intercorrelations between the variables are zero. If the nu ll hypothesis is confirmed (H0: │Rρ │ = 1o Rρ = I) it means that the variables are not intercorrelated.
Table No. 11. KMO and Bartlett test
Sampling adaptation measure of Kaiser-Meyer-Olkin. ,559
Bartlett's sphericity test
Approximate Chi-square 965,798
gl 210
Sig. ,000
Source: own elaboration of the researcher based on the survey
In Table No. 11, we have the inverse of the correlation matrix, KMO (Kaiser-Meyer-Olkin) and the Bartlett test. Bartlett's sphericity test is obtained from a transformation of the determinant of the correlation matrix. The statistic of said test is given by:
, where n is the number of individuals in the sample and λj (j = 1, ..., p) are the eigenvalues of R. Under the null hypothesis this statistic is distributed asymptotically according to a distribution χ2 with p (p-1) / 2 degrees of freedom. The Barltett Test was used to verify if the correlation matrix is an identity matrix, that is, if all the coefficients of the diagonal are equal to the unit and the diagonal ends equal to 0. The results of the test t hey indicate that the value of Chi2 reaches 965,798 and a degree of significance p = 0.000, implies that it is not an identity matrix, so it is possible to perform the factorial analysis with the available information. KMO is an index that takes values between 0 and 1 and is used to compare the magnitudes of the correlation coefficients observed with the magnitudes of the partial correlation coefficients so that the smaller the value, the higher the value of the partial correlation coefficients rij (p) and, therefore, less desirable is to perform a Factorial Analysis. Kaise, Meyer and Olkin advise that if KMO ≥0.75 the idea of performing a factor analysis is good, if 0.75> KMO ≥ 0.5 the idea is acceptable and if KMO <0.5 is unacceptable. Therefore, for the investigation it is acceptable to perform the factorial analysis because the value of the Kaiser-Meyer-Olkin sample adaptation measure is 0.559.
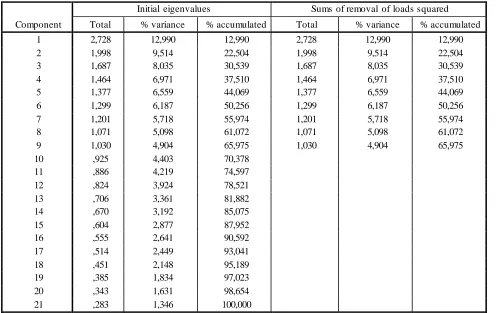
Extraction of Factors
As we have already pointed out, the purpose of Factor Analysis is to determine a reduced number of factors that can represent the original variables. Therefore, once it has been determined that the Factor Analysis is an appropriate technique to analyze the data, the appropriate method for extracting the factors should be selected. There are different methods each with their advantages and disadvantages. For the case of the present study, we have proceeded by the principal components method.
https://dx.doi.org/10.22161/ijels.4.3.34 ISSN: 2456-7620
included in the analysis are able to explain exactly 65.97% of the total variability, which can be considered as a very
acceptable percentage.
Table No. 12. Total variance explained
Component
Initial eigenvalues Sums of removal of loads squared
Total % variance % accumulated Total % variance % accumulated
1 2,728 12,990 12,990 2,728 12,990 12,990
2 1,998 9,514 22,504 1,998 9,514 22,504
3 1,687 8,035 30,539 1,687 8,035 30,539
4 1,464 6,971 37,510 1,464 6,971 37,510
5 1,377 6,559 44,069 1,377 6,559 44,069
6 1,299 6,187 50,256 1,299 6,187 50,256
7 1,201 5,718 55,974 1,201 5,718 55,974
8 1,071 5,098 61,072 1,071 5,098 61,072
9 1,030 4,904 65,975 1,030 4,904 65,975
10 ,925 4,403 70,378
11 ,886 4,219 74,597
12 ,824 3,924 78,521
13 ,706 3,361 81,882
14 ,670 3,192 85,075
15 ,604 2,877 87,952
16 ,555 2,641 90,592
17 ,514 2,449 93,041
18 ,451 2,148 95,189
19 ,385 1,834 97,023
20 ,343 1,631 98,654
21 ,283 1,346 100,000
Extraction method: analysis of main components.
Source: own elaboration of the researcher based on available data 2018
The commonality is a value obtained in the factorial analysis, for each of the original variables, by adding the squares of the correlations or loads of the retained factors with the variable for which it is calculated and which expresses the proportion of variance of the variable extracted or explained with m factors, where m is the number of factors retained. If m is equal to the total
number of variables, commonality will be equal to 1. In table No. 13, the factor is interpreted according to the variables most correlated with it. Consequently, the factors that have values above 0.70 are those that explain the variability in greater proportion, so the variables that obtain high values would explain the quality of academic and administrative service in the university.
Table No. 13. Analysis of Communalities
Items or variables Inicial Extracción
The authorized agents have updated equipment and modern appearance 1,000 ,718
The physical infrastructure of the agents authorized by the program is adequate 1,000 ,703 Employees of agents authorized by the program have a well-groomed appearance. 1,000 ,695 The appearance of the equipment in the agents authorized by the program are in
accordance with the services offered 1,000 ,625
https://dx.doi.org/10.22161/ijels.4.3.34 ISSN: 2456-7620
In the program the employees are educated and friendly with the users. 1,000 ,652 Employees demonstrate equality for all their users 1,000 ,632 When the program promises to do something for a certain date, it performs 1,000 ,659 When users have problems, program managers show a sincere interest in solving it 1,000 ,673 The program that belongs to them offers security and reliability 1,000 ,578 The program provides its services in the time it promises to do so. 1,000 ,632 The program that you belong to has your information always updated 1,000 ,737 Program employees communicate to users when a service will be completed. 1,000 ,616 The employees of the program offer a fast service to their users 1,000 ,442 The employees of the program are always willing to help users. 1,000 ,770 The employees of the program are always willing to answer the questions of the users. 1,000 ,752 The employees of the program give their users personalized attention. 1,000 ,692 The program has convenient work schedules to serve all its users. 1,000 ,549 The employees of the program are interested in knowing the needs of their users. 1,000 ,718 Employees of the program prioritize the interests of their users 1,000 ,637
Extraction method: analysis of main components.
Source: own elaboration of the researcher based on available data 2018
T test for Hypothesis 3
To these results were applied the Student's T-test, to establish if there are differences between the users' averages between the received service and the expected service and if the test values differ significantly from a known or hypothesized given value. The test calculates descriptive statistics for the contrast variables together with the t test. By default, the SPSS includes the 95% confidence interval for the difference between the mean of the contrast variable and the hypothesized value of the test. Posing the following statistical hypotheses:
The null hypothesis (Ho): There is no significant difference in users between the service received and the expected service of the FISE program
The Alternative Hypothesis (Ha): There is a significant difference in the users between the
service received and the expected service of the FISE program
The t-test procedure for a sample contrasts whether the mean of a single variable differs from a specified constate. Thus we can know if a certain sample comes from a population whose true mean is known. This procedure is applied to calculate the significance of the differences obtained by a sample of users of the academic and administrative services of the university, to compare the means of the received service in contrast to the expected service. The obtained result shows that the average of the service received by the users of the FISE program is significantly lower than the average of the expected service, since p = 0.000, since the average obtained is 2.96 and the expected average 3.99.
Table No. 14. Statistics for a sample
VARIABLES N Halp Typical deviation Typical error of the average General perception of the
service received 283 2.96 ,185 ,011
General expectation of
expected service 283 3.99 ,119 ,007
Source: own elaboration of the researcher based on the surveys
https://dx.doi.org/10.22161/ijels.4.3.34 ISSN: 2456-7620
Table No. 15. "T" test for a sample Test value = 0
t gl Sig. (bilateral)
Difference of means
95% Confidence interval for the difference
Lower Higher General perception of the
service received 269,653 282 ,000 2,965 2,94 2,99
General expectation of
expected service 565,000 282 ,000 3,993 3,98 4,01
Source: own elaboration of the researcher based on the surveys
4.9.Multiple Linear Regression Analysis of the hypothesis test
In order to determine the factors associated with the perceived quality of users about quality service, the following statistical hypothesis has been formulated:
Hypothesis 03:
The conditioning factors of the quality of services perceived by users are related to tangible attributes, reliability, security, responsiveness and empathy. Therefore, there is a direct and significant association between the factors included in the model with the quality perceived by the users of the FISE program.
Ho: Fc ≤ Ft; Factors such as tangible attributes, reliability, security, responsiveness and empathy are not determinants of the quality of service perceived by users of the FISE program.
Hi: Fc> Ft; Factors such as tangible attributes, reliability, security, responsiveness and empathy are conditioning factors in the quality of service perceived by users of the FISE program.
Table No. 16. Summary of the multiple linear regression model
Model R R square R squared corrected
Typical error of the
estimate
Change statistics
Durbin-Watson Change in
R square
Change in F
gl1 gl2 Significanc e Change
in F
1 ,546a ,657 ,741 ,171 ,657 614,651 5 267 ,000 1,670
To. Predictors: (Constant), AVERAGE COMPONENT AVERAGE, COMPONENT AVERAGE RESPONSE CAPACITY, AVERAGE COMPONENT SECURITY, COMPONENT AVERAGE RELIABILITY, AVERAGE COMPONENT TANGIBILITY
b. Dependent variable: General level of satisfaction of the service Source: own elaboration of the researcher based on available data 2018
The aforementioned factors turn out to be conditioning factors to explain the quality of the FISE program service at a value of (F = 0.000); On the other hand, the coefficient of determination is (R2 0.657), which implies that the variation in the quality of service is determined by the attributes considered. The value of the Durbin-Watson statistic measures the degree of autocorrelation between the residue corresponding to each observation and the previous one. If its value is close to 2, then the residuals are uncorrelated, if it approaches 5, they will be negatively auto correlated and if their value is close to 0 they will be positively auto correlated. In our case, it
takes the value 1,670, close to 2 which indicates the impropriety of the waste.
V. DISCUSSION
https://dx.doi.org/10.22161/ijels.4.3.34 ISSN: 2456-7620
(1981), which are researches that only study products, the classification of some of their aspects in instrumental dimensions is linked to dissatisfaction, and symbolic dimensions, linked to satisfaction, pose a certain ambiguit y , which makes the results obtained depend on the way in which it is resolved. Bitner, Booms and Tetreault (1990) and Silvestro and Johnston (1990), directly analyze the relationship of services with customer satisfaction and dissatisfaction, without previously classifying them in instrumental or symbolic dimensions.
Bitner, Booms and Tetreault (1990), in this study there are statistically significant relationships between the type of incident and the groups and categories, which include the aforementioned behaviors and events. Silvestro and Johnston (1990) does not validate the hypothesis that there are two different types of quality factors, hygienic and growth, proposing a new approach that supports the existence of 3 types of quality factors: hygienic factors (they are factors that are expected by the client, in which a failure in its provision will cause dissatisfaction to the client), growth factors (whose performance will lead to satisfaction in the client, and in which a failure in its provision will not necessarily cause dissatisfaction) and double factors Matsumoto threshold, (2014); Soliz, (2017), factors that are expected by the customer, in which a failure in their performance will cause dissatisfaction, and whose performance above a certain level will lead to customer satisfaction.
The application of the model is based on the evaluation of the direct user and allows us to know what dimensions compose the perceived quality according to the users (Rivera, 2015), since this is a multidimensional concept, according to the authors as (Parasuraman, 1988; Zeithalm, 1988; Teas, 1993; Cronin and Taylor 1994; Inquilla, 2017). And also, it explains the index of perceived quality in each evaluated dimension, that is, the degree to which each of these dimensions is related to the global level of quality perceived by the us er (Parasuraman, 1988). But, in addition, the Servqual scale also explains the relationship between perceived quality and the level of overall satisfaction resulting from the service experience provided by the FISE program, which is important because satisfaction constitutes the mediating element between quality and quality. user loyalty (Oliver, 1993; Cabello, E. & Chirinos, J. (2012) .The studies conducted by El-Khawas, (1998), Sanyal, (1995), Middlehurst and Woodhouse, (1995) and Lenn (1994). ), consider that the factors that condition quality vary from one country to another, however what these authors agree that some
aspects associated with continuous improvement, the introduction of competition elements, the logic of the market in the sector and the need to respond to the requirements of globalization are common in the world.
VI. CONCLUSIONS
The quality of service is what the user says from his perception, which is defined at the end of the delivery of the service. Consequently, the scale adapted to the Servqual model shows us an alpha Cronbach higher than 0.7, which indicates that both the instrument and its attributes are reliable and consistent to measure the quality of the service offered by the FISE program in the Puno region. Therefore, users associate the service quality of the program with five dimensions: tangible elements, reliability, user attention and security, responsiveness and empathy.
The overall quality level perceived by users is below the expected average according to the Servqual scale, that is, the user population is "moderately satisfied". Overall, the quality gaps revealed a need for improvement in the quality of the service in general and specified the areas with the greatest need for improvement, providing a reference to evaluate the results of the improvements that are implemented in the future and to measure the quality of service. The obtained result shows that the average of the service received by the users of the FISE program is significantly lower than the average of the expected service, since p = 0.000, since the average obtained is 2.96 and the expected average 3.99.
The factors considered in the study turn out to be conditioning factors to explain the quality of the service to the user at a value of (F = 0.000); On the other hand, the coefficient of determination is (R2 0.657), which implies that the variation in the quality of service is determined by the factors mentioned above; that is to say, the factors of quality of the services are conditioned to the tangible elements, reliability, attention to the user and security, responsiveness and empathy.
ACKNOWLEDGEMENTS
A special recognition to the National University of the Puno Highlands, in particular to the Vice-Rector for Research, for the support provided through the FEDU for the culmination of the research.