3302
Research Article
FORMULATION AND EVALUATION OF SOLID DISPERSION OF
ANTI-ARTHRITIC DRUG AS FLOATING MICROSPHERES
Rinu Varghese*, Shajan A, Leena Jacob
Department of Pharmaceutics, Nazareth College of Pharmacy, Othera, Thiruvalla-689546,
Kerala, India
ARTICLE INFO
ABSTRACT
Key words:
Floating microspheres, Ketoprofen,
Solid dispersion,
Solvent evaporation method
Arthritis is a form of joint disorder that causes inflammation in one or more joints. Ketoprofen is a NSAID commonly recommended for the relief of pain and inflammation in arthritis. One of the main side effects of Ketoprofen is gastric irritation. To avoid gastric irritation, Ketoprofen was formulated as solid dispersion by melt dispersion method using urea as car-rier. For sustained release and for prolonging the pain relief, solid disper-sion of Ketoprofen was finally formulated as floating microspheres by sol-vent evaporation method. HPMC K4M and EC were used as polymers in the formulation of floating microspheres. Seven formulations of floating microspheres were done by increasing the concentration of EC. Drug excip-ient compatibility studies were done by FTIR and DSC evaluations. Evalua-tion of solid dispersion was carried out by determining percentage yield, drug content, solubility determination and in vitro drug release studies. Characterization of floating microspheres was carried out by percentage yield, micromeritic properties, scanning electron microscopy, drug entrap-ment efficiency, in vitro buoyancy and in vitro drug release studies. F3 was found to be best formulation in terms of in vitro drug release studies. The kinetic study of the optimized formulation was carried out and found that the formulation undergo first order kinetics. The mechanism of drug release was found to be Higuchi model and Super case II transport. The stability studies were performed on optimized formulation F3 according to ICH guidelines.
INTRODUCTION
Arthritis is a form of joint disorder which involves inflammation in one or more joints. The most common forms of arthritis are osteoarthritis and rheumatoid arthritis. There are different forms of arthritis.[1,2]
Prevalence of Arthritis:
According to a prevalence study carried out in adult Indian population, 89.5% of re-sponse rate was obtained and 3393 persons was listed as possible cases of arthritis.
Preva-Journal of Global Trends in Pharmaceutical Sciences
An Elsevier Indexed Journal ISSN-2230-7346
*Address for correspondence
Rinu Varghese*
Department of Pharmaceutics,
Nazareth College of Pharmacy,
Othera,
Thiruvalla-689546,
Kerala, India
3303 lence of arthritis was found to be higher in
urban areas than in rural areas so it can be concluded that both osteoarthritis and rheuma-toid arthritis are common inflammatory and chronic arthritis which result in higher mobidi-ty in the patients.[3,4] Non Steroidal Anti in-flammatory Drugs are mainly used for the treatment of pain and inflammation in arthritis. Ketoprofen (2- aryl propionic acid derivative) is a NSAID which is used for the treatment of pain as well as inflammation in arthritis. Its plasma elimination half life is 2-2.5 hr. In or-der to maintain therapeutic plasma level drug must be administered at least thrice a day. The main side effect of NSAIDS is gastric irrita-tion. To avoid gastric irritation NSAIDS can be formulated as solid dispersion. For prolong-ing the pain relief and for sustained release solid dispersion of NSAIDS finally can be formulated as floating microspheres. Sustained delivery of drug is mainly done by oral route. Fluctuation of therapeutic concentration of drug in the body is decreased by sustained drug delivery system.
ORAL SUSTAINED DRUG DELIVERY SYSTEM
For decades, oral drug delivery is known as the most widely utilized route of administration among all the routes that has been explored for systemic delivery of drugs. Due to convenience of self administration and compactness oral route of administration is considered as the most widely accepted route. [5] Drugs that have short half lives and which are easily absorbed from the GIT will be elim-inated quickly from the systemic circulation. To achieve suitable therapeutic activity fquent dosing of these types of drugs is re-quired. To avoid this limitation, an attempt is made to develop oral sustained release formu-lation to release the drug slowly into the GIT. It also maintains an effective drug concentra-tion in systemic circulaconcentra-tion for a long time. [5, 6, 7]
Solid Dispersion
Solid dispersion is a method available to improve dissolution rate, solubility charac-teristics, bioavailability of poorly water solu-ble drugs and to avoid gastric irritation. In sol-id dispersion drug is dispersed in inert water-soluble carrier at solid state. [8] Various meth-ods are used for solid dispersion technique such as solvent evaporation, fusion, lyophiliza-tion, melt agglomeralyophiliza-tion, extruding and super-critical fluid technology.9 The various carriers
like mannitol, urea, citric acid, polyethylene glycols and polyvinyl pyrrolidone are used as water soluble carriers for solid disper-sions.[9,10,11]
GASTRORETENTIVE DOSAGE FORM
For long periods gastroretentive dos-age form can remain in the gastric region and thus it prolong the GRT of drugs.[12]
For the development of gastro retentive dosage forms FDDS is considerably an easy approach. Thus in the present study, formulation of gas-tro retentive dosage form is done by floating drug delivery system
FLOATING MICROSPHERES IN ARTHRITIS
Floating microspheres are gastro re-tentive drug delivery systems based on non effervescent approach. The drug is slowly re-leased at desired rate as the system floats over gastric contents, resulting in increased gastric retention with reduced fluctuations in plasma drug concentration. Prolonged gastric retention of floating microspheres improves bioavaila-bility, improves solubility of drugs and reduc-es drug waste. Thus floating microspherreduc-es are used in arthritis to improve therapeutic effect. The quantity of polymers and the solvent used for formulation modulates buoyancy and drug release from the dosage form.[12]
MATERIALS AND METHODS
MATERIALS
Ketoprofen was procured from Infinity Ram-pur, Sainia. HPMC K4M and Ethyl Cellulose were purchased from Chemdyes Corporation, Vadodara. Urea, Dichloromethane and Tween 80 were purchased from Spectrum Reagents and Chemicals Pvt. Ltd. Cochin. Methanol was procured from Sara Fine Chemicals, Ba-roda.
PREFORMULATION STUDY
Preformulation studies was carried out by identification of drug, organoleptic evaluation, melting point determination and by solubility determination [13, 14, 15, 16, 17]
Analytical Method
3304
b. Calibration Curve of Ketoprofen
Stock solution (100 µg/ml) of Keto-profen was prepared. [19] From the above stock solution 10 µg/ml, 20 µg/ml, 30 µg/ml, 40µg/ml and 50 µg/ml was prepared in a 100 ml volumetric flasks
C. Compatibility Studies
The compatibility studies were carried out by FTIR and DSC studies. [20]
FORMULATION OF SOLID DISPERSION OF KETOPROFEN
The solid dispersion of Ketoprofen was prepared by melt dispersion method. The ratio of drug and urea was kept constant in 7 formulations. 0.2 g of Ketoprofen and 0.2 g of urea (1:1) was melted together in a china dish. To accomplish a homogenous dispersion the mixture was heated at or above the melting point of the components. Then both the ingre-dients were mixed thoroughly. After mixing the china dish was put on ice bath to cool the mixture to acquire a congealed mass. [21]
EVALUATION OF SOLID DISPERSION
Determination of Yield
The % yield was calculated by using following equation. All the results were taken in a tripli-cate manner.[22]
% Yield =
Weight of prepared solid dispersion × 100 Theoretical Yield
Determination of Solubility
For the solubility determination of sol-id dispersion, 100 mg of solsol-id dispersion was taken in a test tube containing 10 ml phosphate buffer pH7.2. For few hr the tube was shaken occasionally and maintained at 25ºC. The satu-rated solution was centrifuged. The superna-tant was filtered and diluted with buffer. Then the solution was analyzed by UV Spectropho-tometer at 254 nm. All the results were taken in a triplicate manner.[23]
Drug Content
Solid dispersion equivalent to 80 mg of Ketoprofen was weighed and dissolved in phosphate buffer pH 7.4 in a 100 ml volumet-ric flask. Then the volume was made up to 100 ml with the buffer. The solution was analyzed by UV Spectrophotometer at 254 nm. All the results were taken in a triplicate manner.[ 22] In Vitro Dissolution Studies
Dissolution studies of Ketoprofen drug and Solid Dispersion was performed us-ing USP dissolution test apparatus II with the
paddle rotating at 50 rpm in 900 ml phosphate buffer (pH7.4) at 37 ± 0.5ºC. The solid disper-sion equivalent to 80 mg of Ketoprofen was taken for the dissolution test. 5 ml samples were withdrawn and the same volume was replaced with fresh dissolution medium. The samples were then analyzed by UV spectro-photometer at 254 nm.[22]
FORMULATION OF SOLID DISPERSION OF KETOPROFEN AS
FLOATING MICROSPHERES
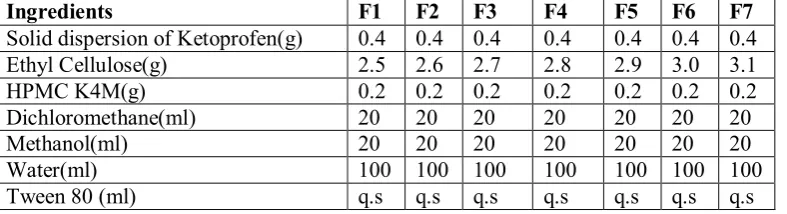
Floating microspheres were prepared by solvent evaporation method. Distilled water used as continuous phase. The solid dispersion of drug and polymers were weighed in differ-ent proportions. Seven formulations were pre-pared. Each formulation varied in EC concen-tration. The EC concentration was increased by 0.1 gm in each formulation. The solid dis-persion of drug and HPMC K4M concentra-tion was kept constant. The mixture of solid dispersion of drug and polymer was co dis-solved into previously cooled mixture of methanol: dichloromethane at room tempera-ture. The uniform solid dispersion of drug and polymer dispersion was obtained by stirring the mixture vigorously. The above organic phase was added to 100 ml distilled water which contains 0.01 % Tween 80. The temper-ature was maintained at 15– 20ºC. Then it was emulsified by stirring for 20 min. The micro-spheres formed was filtered and washed with water. Finally dried under vacuum. The for-mulation is given in Table No. 1[22,23]
EVALUATION OF FLOATING MICROSPHERES
Micromeritic Properties a. Particle Size
The particle size of floating microspheres was analyzed using optical microscopy meth-od.[22]
b. Bulk Density,Tapped Density, Com-pressibility Index, Hausner’s Ratio and Angle of Repose
Bulk Density, Tapped Density,
Compressibil-ity Index, Hausner’s Ratio and Angle of
Re-pose were determined to check the flow properties. [24]
Yield of Floating Microspheres
3305
% yield =
Actual weight of product × 100 Total weight of excipient and drug In Vitro Buoyancy
300 mg of floating microspheres was placed in 50 ml beakers and 20 ml of 0.1 M HCl containing 0.02 % Tween 80 was added. The beakers were shaken horizontally in a wa-ter bath at 37 ± 0.1 ºC. Floated particles was collected after 10 hr and dried in a desiccator to constant weight. All the results were taken in a triplicate manner. The % of floating mi-crospheres was calculated as [22]
Buoyancy (%) =
Weight of floating microspheres/Initial weight of floating microspheres x 100
Drug Entrapment Efficiency
The prepared floating microsphere was dissolved in a minimum amount of meth-anol. The drug was extracted into suitable aqueous media (0.1 N HCl) by evaporating methanol. The solution was then filtered through filter paper. The solution was diluted suitably and analyzed for drug content spec-trophotometrically at 254 nm. The blank was 0.1 N HCl. All the results were taken in a trip-licate manner [22]
Scanning Electron Microscopy
SEM analysis was carried out to study the surface morphology.[22]
In Vitro Drug Release Studies
The floating microspheres equivalent to 100 mg of drug was determined using pad-dle method at 100 rpm for 8 hr in 900 ml 0.1 N HCl. 5 ml of samples was withdrawn at differ-ent time intervals. The solution was replaced with 0.1 N HCl. The amount of drug release was analyzed at 254 nm by using UV Visible Spectrophotometer.[22]
KINECTIC MODELLING OF DISSOLUTION PROFILES
The various kinetic models such as Korsmeyer Peppas plot, Higuchi plot, Hixson Crowell plot, First order plot and Zero order plot was used to study the drug release kinetics of F3.The data obtained from in vitro drug release was plotted in various kinetic models. The best fit model was confirmed by the value of R2 which is near to 1. [25]
STABILITY STUDIES
Accelerated stability was performed on optimized formulation F3 according to ICH guidelines. The optimized formulation was stored in stability chamber in glass vials. Sta-bility studies on the optimized formulation
were performed by keeping the sample at Ac-celerated Condition. The optimized formula-tion was analyzed at initial, third and sixth month. The formulation was evaluated for pa-rameters like yield, in vitro drug release, in vitro buoyancy and drug entrapment efficiency at storage condition at 40 ± 5ºC/75 ± 5% RH.[26]
RESULTS AND DISCUSSIONS
Analytical Methoda. λmax of Ketoprofen
The sample 100 µg/ml was prepared and scanned between 200 – 400 nm. The drug showed maximum absorption at 254 nm so the
λmax was found to be 254 nm.
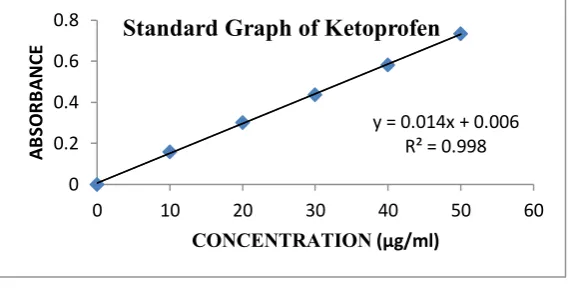
b. Calibration Curve of Ketoprofen
The various concentration of drug (10 µg/ml, 20 µg/ml, 30 µg/ml, 40 µg/ml, 50 µg/ml) was prepared and the standard graph was plotted. Standard calibration curve data of Ketoprofen is given in Table No. 2. From Fig. No. 1 y intercept and R2 value was found to be 0.014 and 0.998 respectively.
c. Compatibility Studies
1.FTIR
The results are given in the Table No. 3. FTIR spectrum of Ketoprofen is given in Fig. No.2. FTIR spectrum of Ketoprofen and ex-cipients are given in Fig. No.3. The FTIR spectrum of Ketoprofen and excipients was compared with the FTIR spectrum of Keto-profen. It was observed that there were no sig-nificant changes in characteristic peaks indi-cating compatibility between Ketoprofen and the excipients.
2.DSC
3306
Table No. 1: Formulation of solid dispersion of Ketoprofen as floating microspheres
Ingredients F1 F2 F3 F4 F5 F6 F7
Solid dispersion of Ketoprofen(g) 0.4 0.4 0.4 0.4 0.4 0.4 0.4 Ethyl Cellulose(g) 2.5 2.6 2.7 2.8 2.9 3.0 3.1
HPMC K4M(g) 0.2 0.2 0.2 0.2 0.2 0.2 0.2
Dichloromethane(ml) 20 20 20 20 20 20 20
Methanol(ml) 20 20 20 20 20 20 20
Water(ml) 100 100 100 100 100 100 100
Tween 80 (ml) q.s q.s q.s q.s q.s q.s q.s
Table No. 2: Standard calibration curve data of Ketoprofen
Sl. No. Concentration (µg/ml) absorbance
1 0 0
2 10 0.158
3 20 0.301
4 30 0.437
5 40 0.581
6 50 0.734
Table No. 3: Functional groups and observed peak values of FTIR spectrum
Sl.
No. Drug and Excipients
Functional Groups Ar.H
(cm-1) C-H deformation of aromatic rings (cm-1)
C-H defor-mation (cm-1)
C=C stretching of aro-matic ring ( can be as-signed as the presence of Keto group) (cm-1) 1 Ketoprofen 778.72 860-690 1282.18 1444.43
2 Ketoprofen+ HPMC K4M+ EC + Urea
710.04 860- 690 1282.06 1447.43
Table No. 4: In vitro dissolution studies of Ketoprofen and solid dispersion of Ketoprofen
SI. No. Time (min) % Cumulative drug release Ketoprofen Solid Dispersion
1 0 0 0
2 5 9.6 57.3
3 10 9.7 58.6
4 15 12.0 59.2
5 20 18.0 63.3
6 25 16.8 65.8
7 30 22.5 70.6
8 45 27.3 70.9
9 60 31.5 75.0
10 90 43.5 79.3
3307
Table No. 5: Particle size of floating microspheres of Ketoprofen
Sl. No. Formulation Particle size (µm) *Mean ± S.D1 F1 81.7 ± 0.100
2 F2 82.1 ± 0.150
3 F3 83.2 ± 0.150
4 F4 85.1 ± 0.200
5 F5 86.1 ± 0.100
6 F6 88.0 ± 0.150
7 F7 89.1 ± 0.100
*Each reading is an average of 3 determinations
Table No.6: Micromeritic properties of Ketoprofen floating microspheres
*Each reading is an average of 3 determinations
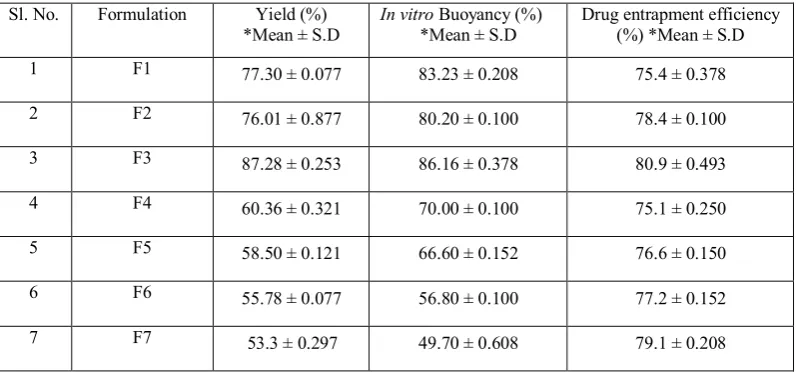
Table No.7: % Yield,
In Vitro
Buoyancy and Drug Entrapment Efficiency of Ketoprofen
Floating Microspheres
Sl. No. Formulation Yield (%)
*Mean ± S.D
In vitro Buoyancy (%) *Mean ± S.D
Drug entrapment efficiency (%) *Mean ± S.D
1 F1 77.30 ± 0.077 83.23 ± 0.208 75.4 ± 0.378
2 F2 76.01 ± 0.877 80.20 ± 0.100 78.4 ± 0.100
3 F3 87.28 ± 0.253 86.16 ± 0.378 80.9 ± 0.493
4 F4 60.36 ± 0.321 70.00 ± 0.100 75.1 ± 0.250
5 F5 58.50 ± 0.121 66.60 ± 0.152 76.6 ± 0.150
6 F6 55.78 ± 0.077 56.80 ± 0.100 77.2 ± 0.152
7 F7 53.3 ± 0.297 49.70 ± 0.608 79.1 ± 0.208
Sl. No.
Formu-lation
Bulk density* (g/cc) *Mean ± S.D
Tapped density (g/cc) *Mean ± S.D
Compressibility Index (%) *Mean ± S.D
Hausner’s ratio
*Mean ± S.D Angle of repose (
0)
*Mean ± S.D
1 F1 0.243 ± 0.003 0.282 ± 0.0015 12.61 ± 0.015 1.140 ± 0.002 29.60 ± 0.200
2 F2 0.251 ± 0.001 0.287 ± 0.002 14.22 ± 0.0152 1.131 ± 0.001 26.40 ± 0.305
3 F3 0.253 ± 0.004 0.291 ± 0.001 14.58 ± 0.015 1.171 ± 0.003 25.40 ± 0.152
4 F4 0.291 ± 0.001 0.340 ± 0.001 14.71 ± 0.064 1.172 ± 0.001 27.06 ± 0.015
5 F5 0.301 ± 0.001 0.341 ± 0.0015 13.77 ± 0.015 1.161 ± 0.002 29.14 ± 0.225
6 F6 0.309 ± 0.002 0.351 ± 0.009 12.49 ± 0.015 1.142 ±0.005 27.92 ± 0.055
3308
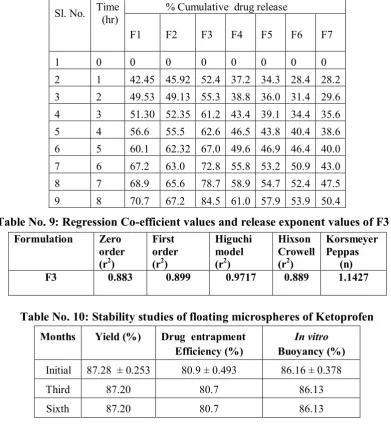
Table No. 8:
In vitro
dissolution studies of floating microspheres of Ketoprofen
Table No. 9: Regression Co-efficient values and release exponent values of F3
Table No. 10: Stability studies of floating microspheres of Ketoprofen
Months Yield (%) Drug entrapmentEfficiency (%)
In vitro Buoyancy (%)
Initial 87.28 ± 0.253 80.9 ± 0.493 86.16 ± 0.378
Third 87.20 80.7 86.13
Sixth 87.20 80.7 86.13
Table No. 11: Comparison of stability studies of
in vitro
drug release of Ketoprofen
floating microspheres
Months Time ( hr)
0 1 2 3 4 5 6 7 8
Initial 0 52.4 55.3 61.2 62.6 67.0 72.8 78.7 84.5
Third 0 51.0 54.0 60.0 62.0 66.0 71.0 78.0 84.0
Sixth 0 51.0 54.0 60.0 62.0 66.0 71.0 78.0 84.0
Sl. No. Time (hr) % Cumulative drug release
F1 F2 F3 F4 F5 F6 F7
1 0 0 0 0 0 0 0 0
2 1 42.45 45.92 52.4 37.2 34.3 28.4 28.2 3 2 49.53 49.13 55.3 38.8 36.0 31.4 29.6 4 3 51.30 52.35 61.2 43.4 39.1 34.4 35.6 5 4 56.6 55.5 62.6 46.5 43.8 40.4 38.6 6 5 60.1 62.32 67.0 49.6 46.9 46.4 40.0 7 6 67.2 63.0 72.8 55.8 53.2 50.9 43.0 8 7 68.9 65.6 78.7 58.9 54.7 52.4 47.5 9 8 70.7 67.2 84.5 61.0 57.9 53.9 50.4
Formulation Zero order (r2)
First order (r2)
Higuchi model (r2)
Hixson Crowell (r2)
Korsmeyer Peppas (n)
3309
Fig. No. 1: Standard Graph of Ketoprofen
Fig. No. 2: FTIR Spectrum of Ketoprofen
Fig. No. 3: FTIR spectrum of Ketoprofen+ HPMC K4M +EC + Urea
Fig. No. 4: DSC of Ketoprofen
y = 0.014x + 0.006 R² = 0.998
0 0.2 0.4 0.6 0.8
0 10 20 30 40 50 60
A
B
SO
R
B
A
N
C
E
3310
Fig. No. 5: DSC of Solid Dispersion of Ketoprofen
Fig. No. 6: DSC of Ketoprofen +HPMC K4M+ EC+ Urea
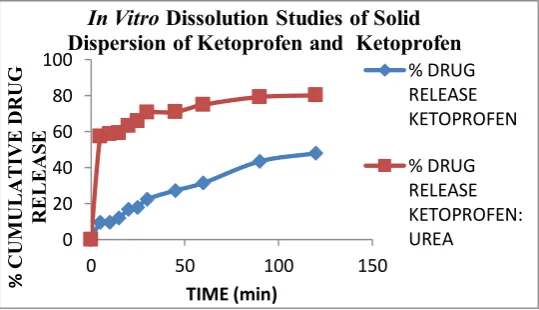
Fig. No. 7:
In vitro
dissolution studies of solid dispersion of Ketoprofen and Ketoprofen
Fig. No. 8: Microscopic view of floating microspheres of Ketoprofen
020 40 60 80 100
0 50 100 150
%
C
U
M
U
LA
TI
V
E
D
R
U
G
R
EL
EA
SE
TIME (min)
In Vitro Dissolution Studies of Solid Dispersion of Ketoprofen and Ketoprofen
% DRUG RELEASE KETOPROFEN
3311
Fig. No. 9: Comparison of particle size of floating microspheres of Ketoprofen
Fig. No. 10: Comparison of % yield of floating microspheres of Ketoprofen
Fig. No 11: Top view of
in vitro
buoyancy of floating microspheres of Ketoprofen
Fig. No. 12: Comparison of
in vitro
buoyancy of floating microspheres of Ketoprofen
7880 82 84 86 88 90
F1 F2 F3 F4 F5 F6 F7
P
A
R
TI
C
LE
S
IZE
(µm
)
FORMULATION
Comparison of Particle Size of Floating
Microspheres of Ketoprofen
PARTICLE SIZE
0 50 100
F1 F2 F3 F4 F5 F6 F7
Y
IE
LD
(%
)
FORMULATION
Comparison of % Yield of Floating Microspheres
of Ketoprofen
% YIELD
0 20 40 60 80 100
F1 F2 F3 F4 F5 F6 F7
IN
V
IT
RO
B
U
O
Y
A
N
C
Y
(%)
FORMULATION
3312
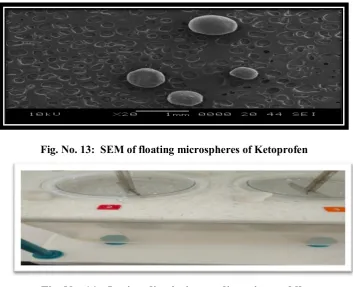
Fig. No. 13: SEM of floating microspheres of Ketoprofen
Fig. No. 14:
In vitro
dissolution studies using paddle
Fig. No. 15:
In vitro
dissolution study of floating microspheres of Ketoprofen
Fig. No. 16: F3- The optimized formulation of Ketoprofen floating microspheres
020 40 60 80 100
0 5 10
%
C
U
M
U
LA
TI
V
E
D
R
U
G
R
EL
EA
SE
TIME(hr)
3313
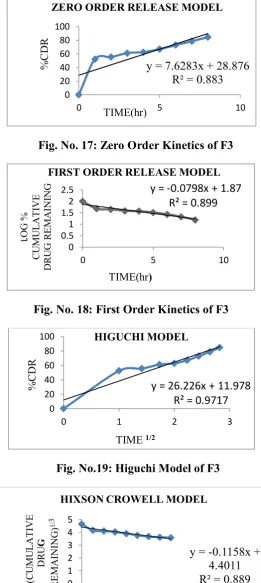
Fig. No. 17: Zero Order Kinetics of F3
Fig. No. 18: First Order Kinetics of F3
Fig. No.19: Higuchi Model of F3
Fig. No.20: Hixson Crowell Model of F3
y = 7.6283x + 28.876
R² = 0.883
020 40 60 80 100
0 5 10
%
C
D
R
TIME(hr)
ZERO ORDER RELEASE MODEL
y = -0.0798x + 1.87
R² = 0.899
0 0.5 1 1.5 2 2.5
0 5 10
L
O
G
%
CU
M
U
L
A
T
IV
E
D
R
U
G
R
E
M
A
IN
IN
G
TIME(hr)
FIRST ORDER RELEASE MODEL
y = 26.226x + 11.978
R² = 0.9717
0 20 40 60 80 100
0 1 2 3
%
C
D
R
TIME 1/2
HIGUCHI MODEL
y = -0.1158x +
4.4011
R² = 0.889
01 2 3 4 5
0 5 10
%(C
U
M
U
L
A
T
IV
E
DR
U
G
R
E
M
A
IN
IN
G
)
1/
3
TIME (hr)
3314
Fig. No 21: Korsmeyer Peppas Model of F3
Fig. No. 22: Comparison of stability studies of in vitro drug release of Ketoprofen floating microspheres
EVALUATION OF SOLID DISPERSION OF KETOPROFEN
Determination of Yield: The % yield of solid dispersion of Ketoprofen was found to be 80.2 ± 0.1%. (Mean ± S.D)*
*Reading is an average of 3 determinations.
Determination of Solubility
The solubility of solid dispersion of Ke-toprofen in phosphate buffer pH 7.2 was found to be 1.71 ± 0.01 mg/ml.(Mean ± S.D)* *Reading is an average of 3 determinations.
Drug Content
The drug content of solid dispersion of Ketoprofen was found to be 89.2 ± 0.1%. (Mean ± S.D)*
*Reading is an average of 3 determinations.
In Vitro Drug Release
Solid dispersion of Ketoprofen showed better in vitro drug release compared to Ketoprofen. The results are given in Table No.4. It is graphically represented in Fig. No.7.
EVALUATION OF FLOATING MICROSPHERES
Micromeritic Properties a. Particle Size
Particle sizes of 7 formulations were de-termined and reported in Table No. 5. The mi-croscopic view of floating microspheres of Ketoprofen is given in Fig. No.8. It is graph-ically represented in Fig. No.9. The particle size was affected by increase in ethyl cellulose concentration. The particle size increased as the ethyl cellulose concentration increased. This increased the viscosity of polymer which in turn decreased stirring efficiency. The pol-ymer rapidly precipitated leading to hardening and thus avoiding particle size reduction dur-ing solvent evaporation.
b. Bulk Density, Tapped Density, Compressibility Index, Hausner’s Ratio and Angle of Repose
The results are given in Table No. 6. All the results showed good flow property.
SLOPE= 1.1427 0
0.5 1 1.5 2 2.5
-0.5 0 0.5 1
L
O
G
%CD
R
LOG TIME
KORSMEYER PEPPAS MODEL
0 20 40 60 80 100
0 5 10
%
C
U
M
U
LA
TI
V
E
D
R
U
G
R
EL
EA
SE
TIME (hr)
Comparison of stability studies of in vitro drug release of Ketoprofen floating microspheres
initial month
third month
3315
Percentage yield, In Vitro Buoyancy, Drug Entrapment Efficiency
The results are shown in Table No. 7. The yield of floating microspheres decreased as the concentration of ethyl cellulose in-creased. It is graphically represented in Fig. No.10. As the concentration of the polymer increased, viscosity of the solution increased affecting the stirring speed and resulting in decreased percentage yield. In vitro buoyancy was decreased as the ethyl cellulose concentra-tion increased. Top view of in vitro buoyancy of floating microspheres of Ketoprofen is giv-en in Fig. No.11. It is graphically represgiv-ented in Fig. No.12. As the polymer concentration increased, the density of the floating micro-spheres increased resulting in decreased in vitro buoyancy The drug entrapment efficien-cy of 7 formulations was determined.The drug entrapment efficiency increased as the ethyl cellulose concentration increased due to in-crease in viscosity of the solution.
SEM
SEM revealed the morphology of the floating microspheres. It was found that the floating microspheres were spherical in shape. SEM of Ketoprofen floating microspheres is given in Fig. No. 13.
In Vitro Drug Release Studies
In vitro drug release decreased as the ethyl cellulose concentration increased be-cause increased density of the polymer matrix at higher concentrations resulted in an in-creased diffusional path length. This might be resulted in decrease of overall drug release from the polymer matrix. The results are given in Table No.8. In vitro dissolution studies us-ing paddle is given in Fig. No.14. It is graph-ically represented in Fig. No.15. Based on in vitro drug release studies the best formulation was selected as F3. It is shown in Fig. No. 16.
KINETIC MODELLING OF DISSOLU-TION PROFILES
1. Zero and First Order Kinetics: The re-lease kinetics data indicates that the rere-lease of drug best fits to first order release kinetics be-cause R2 values are higher in case of first order kinetics. Zero order is graphically represented in Fig. No. 17 and First order in Fig. No. 18.
3. Hixson Crowell Model and Higuchi Mod-el: The R2 values best fits to Higuchi model. Hence the formulations follow diffusion. Hi-guchi model is graphically represented in Fig. No. 19 and Hixson Crowell in Fig. No.20.
5. Korsmeyer Peppas Model
The drug release behavior was found to be super case II transport which indi-cated that in addition to diffusion other release mechanism including matrix erosion and pol-ymer relaxation is involved. It is graphically represented in Fig. No. 21. When the formula-tion is exposed to gastrointestinal fluids, the surface of the formulation is wetted and hy-drophilic polymer hydrated to form a gel layer around the drug, this will lead to relaxation and swelling of the polymer contributing dif-fusion mechanism. This phenomenon may also result in initial burst release due to the pres-ence of drug in the solid dispersion contrib-uting to erosion of matrix. The regression co-efficient values and release exponent values are given in Table No.9.
STABILITY STUDIES
The optimized formulation F3 was sub-jected to stability study. Initial third and sixth month studies were done and results are given in Table No. 10 and 11. The change in yield, drug entrapment efficiency, in vitro buoyancy
and in vitro drug release was determined. In vitro drug release studies at initial third and
sixth month are graphically represented in Fig. No. 22. No significant change in yield, drug
entrapment efficiency, in vitro buoyancy and in vitro drug release was observed. Thus the
formulation was found to be stable.
CONCLUSION
3316
ACKNOWLEDGEMENT
The authors hereby acknowledge the support given by Nazareth College of Pharmacy, Othera, Thiruvalla.
.
REFERENCES
1. https://enWikipedia.org/wiki/Arthritis (Last accessed on 2016 February10th) 2. https://www.n/m.gov/medlineplus/rhe
umatoid arthritis.html (Last accessed on 2016 February 10th)
3. Patel MM. An Epidemiological sur-vey of Arthritis in the population of North Gujarat, India. Int J Pharma Sci Res.2011; 2(2): 325-30.
4. Kumar KPS, Bhowmik D, Srivastava S, Paswan S, Dutta A.S. Sustained re-lease drug delivery system potential. Pharma Innovation.2012; 1(2): 48-60. 5. Patil K, Patil P, Patil J, Pawar S. A basic approach on sustained release drug delivery system. Am J Pharm Tech Res.2012; 2(5): 214-31.
6. AppaRao B, Shivalingam RM, Reddy KVY, Rao S, Rajesh K, Sunitha N. Formulation and evaluation of Ace-clofenac solid dispersions for dissolu-tion rate enhancement. Int J Pharma Sci Drug Res.2010; 2(2): 146-50. 7. Cai Z, Lei X, Lin Z, Zhao J, Wu
F,Yang Z, et al. Preparation and eval-uation of sustained release solid dis-persions co-loading gastrodin with borneol as an oral brain targeting en-hancer. Act Pharm Sin B.2014; 4(1): 86-93.
8. Habeeb P, Madhavan N, Gladis K, Anitha Y, Mohammed S, Raghunath P. Formulation and evaluation of sol-id dispersion tablets of Aceclofenac using Kollidon 30. Int J Bio-pharm.2013; 4(1): 10-17.
9. Jigar V, Puja V, Jayavadan P. For-mulation and evaluation of solid dis-persions of Rofecoxib for improve-ment of dissolution profile. Afr J Pharm Pharmacol.2011; 5(5): 577-81.
10. Available from:
https://Shodhganga.inflibnet.ac.in/bits tream (Last accessed on 2016 January 4th)
11. Dutta P, Sruti J, Patra NC and Rao BEM. Floating Microspheres: Recent trends in the development of gastro retentive floating drug delivery sys-tem. Int J Pharm Sci Nanotech.2011; 4(1): 1296-306.
12. https://www.webmed.comdigestive-disorders/pictures(Last accessed on 2016 January 11th )
13. Lachmann L, Liebermann HA, Kiang JL.The Theory and Practice of Indus-trial Pharmacy. 3rd edition. Mum-bai:Varghese Publishing House; 1998. 430-40.
14. https://en.wikipedia.org/wiki/melting point(Last accessed on 2016 March 3rd)
15. https://wikipedia.org/wiki melting point ( Last accessed on 2016 March 4th)
16. https://Shodhganga.ac.in/bitstream/10 603/9423/12/12chapter (Last ac-cessed on 2016 March 7th)
17. Available from:
https://www.Niu.edu/ANALYTICAL LAB/FTIR/samplepreparation (Last accessed on 2016 March 7th)
18. Verma N, Deshwal S. Design and in vitro evaluation of transdermal patch-es containing Ketoprofen. World J Pharma Res. 2014; 3(3): 3930- 44. 19. Gupta MM, Patel MG, Patel NS,
Madhulika K. Enhancement of disso-lution rate of preparing solid disper-sion using different methods. Int J Pharm Pharma Sci.2011; 3(3): 204-06.
20. More DS, Sontakke BS. Solubility ehancement of Gliclazide by solid dispersion method. Asian J Pharma Clinical Res.2013; 6(5): 91-98. 21. Habeeb P, Madhavan N, Gladis K,
Anitha Y, Mohammed S, Raghunath P. Formulation, optimization and evaluation of solid dispersion tablets of Aceclofenac using Kollidon 30. Int J Biopharm. 2013; 4(1): 10-17. 22. Srivastava AK, Ridhurkar DN,
3317 23. Akhand K, Bhowmik M, Pandey KG,
Joshi A, Dubey B. Design and char-acterization of floating microparticles of a cyclooxygenase inhibitor for ar-thritis related disorders. J Drug De-livery Therap. 2013; 3(6): 6-13. 24. CVS Subrahmanyan. Text book of
Physical Pharmaceutics. 2nd edi-tion.Delhi: Vallabh Prakashan; 2000.195-228 p.
25. Kalam MA, Humayun M, Parvez N, Yadav S, Garg A, Amin S et al. Re-lease Kinetics of modified pharma-ceutical dosage forms: A review. Continental J Pharma Sci. 2007; 1: 30-35.
26. Panwar MS, Tanwar YS. Evaluation of stability of Diltiazem Hydrochlo-ride floating microspheres at normal and Accelerated Conditions. J Pharm Biomed Sci. 2015; 5(1):