Organized by C.O.E.T, Akola. Available Online at www.ijpret.com
1
INTERNATIONAL JOURNAL OF PURE AND
APPLIED RESEARCH IN ENGINEERING AND
TECHNOLOGY
A PATH FOR HORIZING YOUR INNOVATIVE WORK
ANSYS SIMULATION MODELLING ANDANALYSIS FOR EFFICIENT
VENTILATION DESIGNING.
DR. S. K. DESHMUKH
1, DR. ABHINANDAN R. GUPTA
2 1. Principal, C.O.E.T.A, Akola.2. Faculty C.O.E.T, Akola
Accepted Date: 05/09/2017; Published Date: 10/10/2017
Abstract:
No doubt the increased population is creating acute stress for resources and energy. This growth in population is also leading to increase in demand and thus creating huge gape in demand supply relation. To fulfil this gap there is constant exploitation of non-renewable resources, creating scarcity of resources. Construction industry is one such major sector which consumes approximately 40 % of total energy. However, while considering construction industry, major emphasis is given to reduce energy consumption at time of construction, while neglecting the energy consumption done for the whole life time of structure. This energy which is required to structure after construction process is called as operational energy and is one of the key factor which is responsible for global energy consumption and resource depletion. This operation energy of the building is considered for study in this paper, the energy consumption effect for thermal comfort in building is studied for various ventilation schemes or cases. Analysis is done by IS code method as well as simulation for velocity particle flow path is achieved by application of software Ansys Fluent Flotran 3. From the analysis done for various cases and modelling , the importance of successful planning and designing is highlighted for making efficient utilization of natural ventilation system and reduction in artificial or mechanical ventilation system , thus resulting major amount of structures operational energy.Keywords:
Resource depletion, exploitation; life cycle time; operation energy, efficient natural ventilation; artificial or mechanical ventilation systemCorresponding Author: DR. S. K. DESHMUKH
Co Author: - DR. ABHINANDAN R. GUPTA
Access Online On:
www.ijpret.com
How to Cite This Article:
S. K. Deshmukh, IJPRET, 2017; Volume 6 (2): 1-15
PAPER-QR CODE
SPECIAL ISSUE FOR
INTERNATIONAL LEVEL CONFERENCE
"ADVANCES IN SCIENCE,
Organized by C.O.E.T, Akola. Available Online at www.ijpret.com
2
INTRODUCTIONVentilation of the building is required to supply fresh air for respiration of occupants, to dilute inside air to prevent vitiation by body odours and to remove any products of combustion or other contaminants in air and to provide such thermal environments as will assist in the maintenance of heat balance of the body in order to prevent discomfort and injury to health of the occupants. IS 3362- 1977 and National Building Code of India highlights some of the important criteria’s and clauses for consideration of opening area , sill level height , outside obstruction , wind velocity , desirable wind velocity and minimum wind velocity required. Depending upon the purpose of the room, the Air charge per unit and wind velocity required are specified. For successful planning and designing, all this aspects needs to be considered. However, it has been found that huge change in indoor velocity is marked with change in location, size and shape of opening, even though the total opening area is kept constant. The flow of particle inside the room under air velocity action is dynamic and subjected to various uncertainties for which factors like room temperature, direction of wind, location of openings are responsible. In absence of proper provision or designing of ventilation, the need for mechanical or artificial ventilation is required to full fill comfort wind speed and thermal comfort within the room area.
Literature Review
A healthy building can be defined which having sound designing and planning for heat, ventilation and air is conditioning. The improper design of illumination or ventilation leads to poor indoor air quality and may lead to serious health problem of habitants. John D. Spengler (1) studied the various rules and regulations that are to be followed for having good HVAC system. The IAQ factor needed and the present ventilation system is also specified. Further the study was done for changing construction material used and its effect in indoor air quality, emissions from surfaces and its potential harmfulness.
It is essential to quantify the Embodied Energy of House, depending upon the geographical location, material used and purpose of building the value of EEV changes. The value of EEV is very high as they are required in large quantities in the building construction. Embodied Energy value matrix is the total energy required in manufacturing of the material (sourcing, processing, transportation, handling, wastage. Thus when the type of material changes total EEV also changes. This evaluation of EEV is done for green building material by D.Bansal (2).
Building envelop insulation is another approach for sustainability in housing is suggested by H. Agrawal (3). Building across the globe consumes 60 to 70 % of energy and building envelops contributes 75% of energy consumption out of it for heating and cooling effect .This huge amount of energy can be saved by insulating this envelops with provision of roof insulation, Brick bat coba , Tar felt membrane , mud Phuska technique , wall insulation techniques like double brick wall with cavity etc.
Organized by C.O.E.T, Akola. Available Online at www.ijpret.com
3
B.W.Olesen,(7) conducted study of various International codes and found that the development of codes should be done on the basis of classes. Critical issues such as adaptation, effect of increased air velocity, humidity, type of indoor pollutant sources etc. are still being discussed, but in general the standards does not include this. It is nevertheless important to take into account people’s clothing related to regional traditions and season. And thus , there exist to revise codes and specifications considering all this aspects for proper IOQO.Boccia,et.al (8) compared the experimental and numerical results for the natural ventilation and energy efficient design of window with the name ventilated illuminating wall , the prototype with 1:1 scale model , consisting of precast removable window and room was tested for its feasibility. The internal, external temperature, external and indoor wind speed were checked with simulated model made in fluent/Airpak. The numerical analysis considers steady state condition however, the simulation model benefited with dynamic mode consideration too.
Alexander Kayne(9) carried out research work on computations fluid dynamics modeling of flows in buildings , as it has become matter of concern from last few decades. In 2009, buildings wee the second largest energy consuming sector in U.S, using upto 33.9% and 77.8% of electrical energy consumption. Thus, the research work was carried out to calculate indoor velocity using computation fluid dynamics method considering normal, forced mixed convection in 2D cases and 3D enclosures using simulation in FLUENT software.
Similar work is done by A. Peri. Et,al.(10) with considering the importance of air temperature, air flow, velocity in hospital ward so as to avoid infection and contamination due to improper ventilation designing. The simulation of various models with air flow and boundary parameter were designed and with concept of moving wall the thermal, air velocity pattern and graphs are obtained using CFD FLUENT simulation techniques so as to find most efficient ventilation design.
Aspects and considerations
Determination method and criteria’s:-
Ventilation is expressed as m3/h per m2 of floor area. This unit clearly reflects the parameters included in findings. Normally the Rate of Ventilation ‘Q’ is represented as product of Coefficient of effectiveness ‘K’ , Opening area ‘A’ in m2and outdoor wind speed ‘V’ in m/h. Thus, Q = K.A.V.
The another way of analysing and measuring ventilation is Air change per Hour , which can be defined as the amount of air passing into or out of a building or room in terms of the number of building volume or room volume exchanged. Various factors responsible for finding out indoor wind velocity are outer and inner temperature , humidity , material of walls and roofing , stack effect, dilution area etc.
Recommended values for Air change per hour for some of the important rooms are specified below:-
Living Room – 3-6 Bed Room – 2-4
Dinning and Kitchens – 8 Bathroom – 6-10 etc.
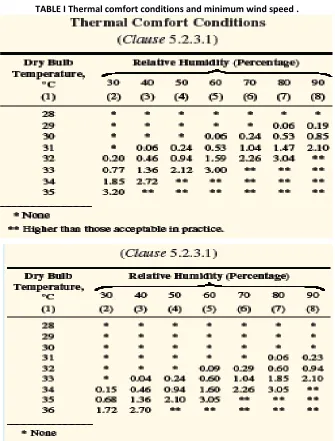
Another important aspect is thermal comfort within room in terms of wind velocity.
Is is dependent on outside temperature and relative humidity. IS code specifies to limits for consideration. One is minimum required and another is desirable values.
Organized by C.O.E.T, Akola. Available Online at www.ijpret.com
4
TABLE I Thermal comfort conditions and minimum wind speed .Source : (National Building Code -2005).
Location under consideration :-
Thus to deign efficient natural ventilation system to mitigate requirement of mechanical ventilation system the use of Ansys Fluent flotran is done for simulating of various cases.
Initially considering the IS 33621977 clauses the requirement of opening size is calculated considering the various parameters of Akola city for fixing values of constant like temperature, humidity, wind speed etc.
Organized by C.O.E.T, Akola. Available Online at www.ijpret.com
5
INDIA METEOROLOGICAL DEPARTMENTNWP MODELS BASED DISTRICT LEVEL WEATHER PREDICTION ISSUED ON: 19-11-2014
DISTRICT : AKOLA STATE : MAHARASHTRA PARAMETERS ENSEMBLE FCST
DAY-1 DAY-2 DAY-3 DAY-4 DAY-5 20/11 21/11 22/11 23/11 24/11 --- --- --- ---
Rainfall (mm) 0 0 0 0 0
Max Temperature ( deg C) 31 31 31 31 31
Min Temperature ( deg C) 18 16 16 16 17
Total cloud cover (octa) 1 3 3 2 2
Max Relative Humidity (%) 36 38 37 38 44
Min Relative Humidity (%) 22 19 18 18 21
Wind speed (kmph) 007 003 003 005 007
Wind direction (deg) 78 111 174 133 112
Mean Wind Speed in Kilometres per Hour (AKOLA)
Jan. Feb. Mar. Apr. May June July Aug. Sept. Oct. Nov. Dec. Annual
1 2 3 4 5 6 7 8 9 10 11 12 13
4.5 5.1 6.0 7.4 12.1 12.7 11.4 10.5 8.2 4.3 4.2 4.0 7.5
Case consideration.
The room of inner size 3.6x 4.5 x 3.1 m. is considered for study. Thus the volume will be = 50.22cum.
Floor Area = 16.2 sqm.
1. As per IS Aircharge /Hr required is minimum 3 and good is 5 .
If wind velocity taken is for Akola region on average is 4.2 Km/Hr.= 0.9282 m/sec. Air charge = Q/V , thus if air charge of 5 is required then,
5= Q/50.22
Q= 251.1cum for required air charge. But Rate of flow Q = Area x velocity 251.1= A x 4.2 x 1000
Or Area required A = 251.1/ (4.2 x 1000) = 0.059 sq m = 0.06 sq m.
2. For warm weather consideration :
Average temperature is 32 oc , Relative Humidity is less then 40 , however as per clause 5.1.1 of IS 3362 -1977 for hot dried region like Akola the stack effect can be neglected as the humidity in air content is less maximum time .
3. Desirable wind speed calculations: Actual outdoor velocity = 4.2 Km/Hr.
= 0.9282 m/sec.
Indoor velocity desirable for 32oc temperature is 0.46 m/sec.
Organized by C.O.E.T, Akola. Available Online at www.ijpret.com
6
From graph fig. 2 of IS 3362,Area of opening / floor area = 5.4/16.2 x 100 = 33%. Thus, average indoor velocity = 35 % of outdoor
= 0.35 x 0.9282 = 0.324 m/sec. This is less then desirable,
To overcome this either mechanical ventilation can be adopted or the size of openings can be changed to cover up this by natural ventilation system only.
With sustainable approach the mechanical ventilation provision is omitted and thus changing geometry of openings.
Revised size of opening:
1.2 x 1.5 sqm window, 2 in numbers for inlet and same for outlet. Thus total area is 7.2 sqm.
7.2/ 16.2 * 100 = 45 %.
= 0.45 * 0.9282 = 0.43 m/sec.
Since wind velocity does not remains constant thus this value is acceptable and will satisfy thermal comfort.
Further the effect of geometry that is location of openings (Inlet & Outlet ) is tested for indoor velocity and circulation path of particles by creating simulations of various cases.
V. SIMULATION FOR VARIOUS CASES.
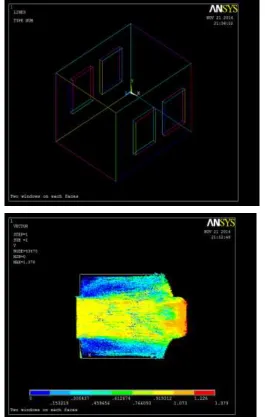
The simulation for various cases are performed on Ansys Flotran 3 Dimensional analysis is done with fluid as AIR SI, for set of domain and parameters value considered , the observations are made.
Domain considerations for simulation process: Outdoor temperature: 32 oc
Pressure : 1 atm Fluid : AIR SI
Type of flow : case dependent Boundary conditions:
Inlet velocity : 0.9282m/ sec Outlet pressure : 0 defined
Alignment of opening : perpendicular to wind flow direction Wall surface property: 0 velocity.
Organized by C.O.E.T, Akola. Available Online at www.ijpret.com
8
Case 2: Parallel opening on wall face 4.5 x 3.1, in direction normal to wind flow (Windward Inlet & lee ward outlet) of size 1.2 x 1.5 m size, two on both faces.Organized by C.O.E.T, Akola. Available Online at www.ijpret.com
9
Case 3: Two inlet and one outlet of total area equal and on opposite walls .Organized by C.O.E.T, Akola. Available Online at www.ijpret.com
10
Case 4: Two inlet and one outlet of total area equal and on adjacent walls .
Fig4 : Simulated model for finding Velocity particle flow path and magnitude for case 4
Case 5: inlet and outlet window of same size and on same wall .
Organized by C.O.E.T, Akola. Available Online at www.ijpret.com
11
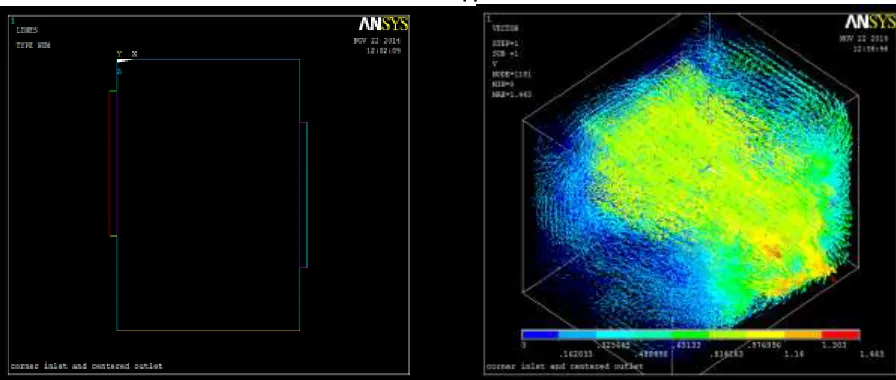
Case 6: Inlet in corner and outlet window centered on opposite wall.Fig6 : Simulated model for finding Velocity particle flow path and magnitude for case 6
Case 7: Single Inlet and 2 outlets on different walls.
Organized by C.O.E.T, Akola. Available Online at www.ijpret.com
12
Case 8: Single Inlet and a outlets on adjacent walls.1) 2)
Fig8 : Simulated model for finding Velocity particle flow path and magnitude for case 8
Case 9: Single Inlet and a outlets on adjacent away wall.
Organized by C.O.E.T, Akola. Available Online at www.ijpret.com
13
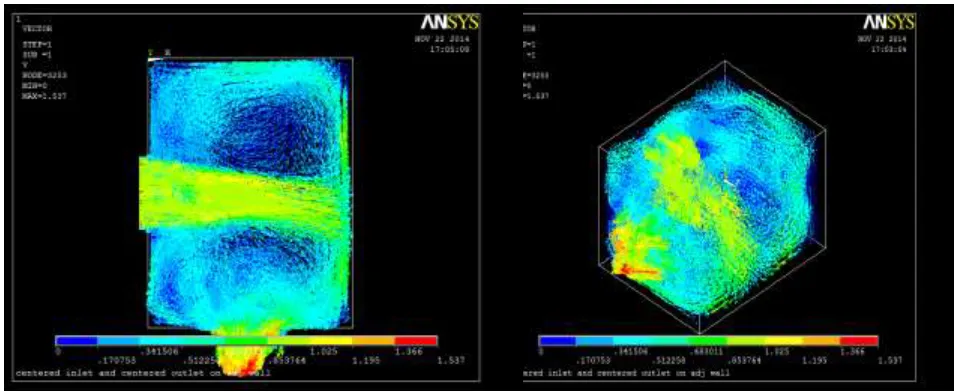
Case 10: Centered inlet and centered outlet on adjacent wall.Fig 10: Simulated model for finding Velocity particle flow path and magnitude for case 10
Observation and remark.
From the various simulation models , analysis done on Ansys Fluent Flotran and calculations done by IS code methods , various observations were made on the inlet velocity , outlet velocity of wind in room , pressure difference and values developed in the room and the result is compared with the desired values as specified in Indian Standard code of practice . This deviations are represented in form of positive value (more than required ) and negative values ( deficient room condition ) in tabulated form as shown below. Various remarks are made on the basis of these values for case s considered and suggestions are made for further practical application while designing building.
TABLE III Observation table.
Case no.
Inlet/outlet arrangement Inlet Velocity Outlet Velocity (m/sec) Indoor prominent Deviation with required Min. indoor Max. indoor
(m/sec) velocity Pressure Pressure
1 Single inlet and single
outlet on opposite walls
0.9282 0.917 0.71 0.25 -0.01 0.436
2 Two inlets and two outlets
on opposite walls
0.9282 0.919 0.91 0.45 0 0.343
3 Two inlet and one outlet of
total area equal and on opposite walls
0.9282 0.834 0.83 0.37 -0.56 0.109
4 Two inlet and one outlet of
total area equal and on adjacent walls
0.9282 0.86 0.28 -0.18 -0.42 0.351
5 Inlet and outlet window of
same size and on same
Organized by C.O.E.T, Akola. Available Online at www.ijpret.com
14
wall.6 Inlet in corner and outlet
window centered on
opposite wall.
0.9282 0.81,0.97 0.405 -0.055 0 0.335
7 Single Inlet and 2 outlets on
different walls.
0.9282 0.71 0.62 0.16 0 0.884
8 Single Inlet and a outlets on
adjacent walls.
0.9282 0.62 0.305 -0.155 0.144 0.624
9 Single Inlet and a outlets on
adjacent away wall
0.9282 0.33 0.116 -0.344 0.87 0.923
10 Centred inlet and centred
outlet on adjacent wall
0.9282 0.34 0.255 -0.205 -0.102 1.46
When the observation is made for various cases it can be seen that the location of windows opposite to each other provide good ventilation in the room with excess value of velocity 0.25 m/sec more than required as in case 1. Similarly when the openings are provided in form of two parts , it increases the wind particle flow in the room and thus the velocity value is also almost double than required, such case may provide sufficient ventilation however, more wind velocity creates disturbance for occupants in the room as in case 2. With the provision of two inlets the amount of fresh air flow is evenly distributed in the room but providing one outlet window creates high pressure zone near outlet of warm air as in case3. When the provision of windows is made on adjacent walls like in case 4, 8 and 10, the circulation of wind does not take effectively in the room area and thus creates deficiencies in required indoor wind velocity. Such cases should be avoided if no boundary constraints are there. Worst ventilation case is developed in the case when single inlet on adjacent walls are provided and that too away from each other , as in case 9 .Such geometrical planning leads to deficient ventilation in the room area promoting need for mechanical or artificial ventilation system. Along with that it is also studies that the density of indoor air decreases due to inner temperature effect making it warm. Due to low density value, these quanta of air moves towards upward direction near roof and creates warm zone near upper zone. Thus provision of outlet for wind should be located at higher level as compared to inlet level.
Conclusions
On the basis of survey work done for tropical region middle class family , it has been found that the electric consumption of approximately 238 K watt / annum is done in 1BKH housing system with further segregation of consumption only for thermal comfort in the room is approximately 67% , which shows consumption of energy for fan , air-conditioned , cooling systems for 17 to 18 hours out o 24 hours .This clearly highlights the consumption of operational energy for cooling or thermal effect in day time too. This huge amount of energy can be saved to 50 % reduction with effective provision and planning of natural ventilation in the building. The study done in this paper reflects the effect of windows location and sizes on rooms thermal parameters. Even the effect of faulty provision of locations of doors and windows are shown, computed and analyzed. More emphasis should be given to promote natural ventilation system in the rooms so as to mitigate the high energy consumption made for thermal cooling effect in the house. Per capita consumption of house hold operational energy can re reduced from 45Kwatt to 20 KWatt/ per capita/per annum , which hold good contribution in overall reduction in demand of energy and thus sparing resources from unwanted exploitation.
Organized by C.O.E.T, Akola. Available Online at www.ijpret.com
15
References1. Johan D.Spengler ,2000 , ‘Indoor Air Quality Factors In Desgning A Healty Building’ ,Annual Review Of Energy And The Environment , 25,pp567-600.
2. D.Bansal , 2012 ,‘Green Building Material –Quantification Of Embodied Energy Of Houses’ ,Role Of Infrastructure For Sustainable Development , IIT Roorkee National Convention Proceedings, .pp 230-236.
3. Himanshu Agrawal , 2010 ,‘ Building Envelops Insulation : A Key To Energy Saving And Sustainable Development ‘ , New Building Material & Construction World, pp 212-220.
4. Y.P.Kajale , 2012 , ‘Prefab Building Technology For Sustainable Development : A Concrete Approach In India’ , Role Of Infrastructure For Sustainable Development , IIT Roorkee National Convention Proceedings .pp 94-109. 5. J.S.Chauhan , 2012 ,‘Sustainable Development In Building Materials ‘, Role Of Infrastructure For Sustainable Development , IIT Roorkee National Convention Proceedings, .pp 161-168.
6. K.D.Sadhale ,K.A. Sahakari & N.Dias , 2012 , ‘Use Of Precaste Technology For Low Cost Housing’ ,Role Of Infrastructure For Sustainable Development , IIT Roorkee National Convention Proceedings, .pp 190-199.
7. Bjame W. Olesen , 2007, ‘International Standards For The Indoor Environment. Where Are We And Do They Apply World Wide?’ , International Centre For Indoor Environment And Energy, DTU, Denmark.
8. O.Boccia,F.Chella,P.Zazzini , 2011 , ‘Ventilated Illuminating Wall : Natural Ventilation Numerical Analysis And Comparison With Experimental Results.’ Low-Energy Architecture (LEA)- World Renewable Energy Congress Sweden ,pp 8-13.
9. Alexander Kayne , 2012, ‘Computational Fluid Dynamics (CFD) Modeling Of Mixed Convection Flows In Building Enclosures.’ , Dissertation Report, Washington University.