R E S E A R C H
Open Access
Identifying EGFR mutation-induced drug
resistance based on alpha shape model
analysis of the dynamics
Lichun Ma
*, Bin Zou and Hong Yan
Abstract
Background:Epidermal growth factor receptor (EGFR) mutation-induced drug resistance is a difficult problem in lung cancer treatment. Studying the molecular mechanisms of drug resistance can help to develop corresponding treatment strategies and benefit new drug design.
Methods:In this study, Rosetta was employed to model the EGFR mutant structures. Then Amber was carried out to conduct molecular dynamics (MD) simulation. Afterwards, we used Computational Geometry Algorithms Library (CGAL) to compute the alpha shape model of the mutants.
Results:We analyzed the EGFR mutation-induced drug resistance based on the motion trajectories obtained from MD simulation. We computed alpha shape model of all the trajectory frames for each mutation type. Solid angle was used to characterize the curvature of the atoms at the drug binding site. We measured the knob level of the drug binding pocket of each mutant from two ways and analyzed its relationship with the drug response level. Results show that 90 % of the mutants can be grouped correctly by setting a certain knob level threshold.
Conclusions:There is a strong correlation between the geometric properties of the drug binding pocket of the EGFR mutants and the corresponding drug responses, which can be used to predict the response of a new EGFR mutant to a drug molecule.
Keywords:Epidermal growth factor receptor (EGFR), Non-small-cell lung cancer (NSCLC), Gefitinib, Drug binding site, Molecular dynamics, Alpha shape modeling, Solid angle
Background
Lung cancer is the leading cause of cancer deaths
world-wide [1–3]. Non-small-cell lung carcinoma (NSCLC) is
the most common lung cancer type, accounting for over 80 % of all the lung cancer cases [4, 5]. Epidermal growth factor receptor (EGFR) is found to overexpress in about 60 % of NSCLC patients, making it a target of
many treatment strategies [6–8]. EGFR, also called
HER1 or ErbB-1, is a member of the ErbB family, which also contains HER2 (ErbB-2), HER3 (ErbB-3) and HER4 (ErbB-4) [9, 10]. It is a functional protein that can be ac-tivated through binding with cognate ligands, such as epidermal growth factor [11]. On ligand binding, EGFR can form a homodimer (EGFR-EGFR) or heterodimers
(dimerization with other family members), leading to the phosphorylation of specific residues at the intracellular tyrosine kinase (TK) domain. These phosphorylated residues act as docking sites for downstream proteins, triggering the downstream pathways that modulate cel-lular proliferation and survival [12, 13]. However, aber-rant EGFR signaling, sometimes caused by mutations at the EGFR TK domain, can lead to tumor growth and
progression in the lung [14–16]. Gefitinib is a commonly
used drug to target the EGFR TK domain to block the
ac-tivation of EGFR and its downstream signaling [17–22].
Nevertheless, after a period of treatment, drug resistance occurs usually due to a second mutation (e.g. T790M) or the activating of other receptor tyrosine kinases (e.g. c-Met) [23–26].
A lot of research has focused on drug resistance
mech-anisms in lung cancer [27–30]. Computational methods
* Correspondence:[email protected]
Department of Electronic Engineering, City University of Hong Kong, 83 Tat Chee Avenue, Kowloon, Hong Kong
are successfully applied in these studies, benefiting from their advantages of low cost, easy implementation and
capacity of processing large datasets [31–33]. Zhu et al.
employed support vector machine based classifiers to correlate the collected features (clinicopathologic features and immunomarkers) and the overall survival of NSCLC patients [34]. Wang et al. used the personal features of 168 NSCLC patients coupled with EGFR mutant-drug binding free energy features to build a classification model to predict the drug response levels, and obtained a best testing accuracy of 95.83 % [35].
To decode the EGFR mutation-induced drug resistance, it is very important to analyze the interaction between the EGFR mutants and a drug molecule. The geometric prop-erties of the drug binding pocket can affect the binding af-finity of two molecules. Intuitively, a concave shape may have a higher binding affinity with a drug molecule than a convex shape because of structural complementary char-acteristics. In addition, a shape with a low convex degree could bind more tightly on a drug molecule relative to a shape with high convex degree. Therefore, different from other studies which focused on personal features, energy features as well as immunomarkers, we use the geometric properties of the drug binding pocket of the EGFR mu-tants to identify the drug resistance mechanisms. Com-pared with the EGFR-drug binding free energy used by Wang et al. [35], which shows the overall binding affinity, the geometric features can provide specific structural in-formation of each atom at the drug binding pocket. These structural information offers clues on how to modify the drug structure and the spatial relations of its atoms with EGFR to overcome the resistance problem.
In this work, we study the EGFR mutation-induced drug resistance by analyzing structural properties of the mutants in a dynamic form, based on the motion trajec-tories obtained from molecular dynamics (MD) simulation. The clinical data of EGFR mutation type and the drug response of patients were collected from Queen Mary Hospital in Hong Kong. We employed Rosetta to model the EGFR mutants based on the crystal struc-ture of wild-type (WT) EGFR and the mutant se-quences [36]. Then Amber [37] was used to conduct MD simulation to show the dynamic evolution of the EGFR mutant-drug system. We extracted the trajectory frames of each mutant and computed the alpha shape model [38, 39] of each frame, in order to describe the mutant with geometric models. Solid angle [33, 40] was evaluated to characterize the curvature properties of the atoms at the drug binding site. Finally, we com-puted the knob level of the drug binding pocket of each mutant and analyzed its relationship with the drug response level. Results show that 90 % of the mu-tants can be grouped correctly by setting a certain knob level threshold.
Methods
Clinical data and ethics statement
The clinical data of NSCLC patients were collected from Queen Mary Hospital in Hong Kong. This study was ap-proved by Institutional Review Board of the University of Hong Kong/Hospital Authority Hong Kong West Cluster. Specifically, there are 137 patients belonging to 30 EGFR mutation types. The mutation type of each pa-tient was obtained through an EGFR mutation test, in which the mutations of the EGFR gene were detected by analyzing the DNA of the tumor sample. All the patients in our dataset took the tyrosine kinase inhibitor gefitinib in the treatments. The potency of the drug was
mea-sured by drug response level (RL), which was obtained
by evaluating the selected target lesions of the patients, based on measurement methods such as computed tom-ography (CT) scan, magnetic resonance imaging (MRI) and chest X-ray. According to the changes of the target lesions, theRLcan be categorized into four levels,complete response (RL= 1), partial response (RL= 2), stable disease
(RL= 3) andprogressive disease(RL= 4).Complete response
indicates that all the target lesions have disappeared.Partial responsemeans that at least a 30 % decrease of the target lesions is measured compared with the sum of the longest diameters (LDs) of the target lesions before treatment.
Stable diseaseandprogressive diseasetake the smallest sum of the LDs as reference.Stable diseasedonates that no suffi-cient decrease or increase is noted, while at least a 20 % in-crease is measured inprogressive disease. For simplicity, we
can combine thecomplete responseandpartial responseto
a drugResponsegroup, while the other two are categorized
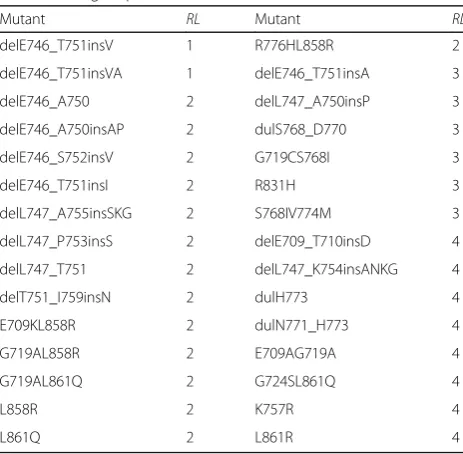
into a No-response group. Table 1 shows the RL of each
mutant, derived by the median RL value of the patients
Table 1Drug response of the mutants
Mutant RL Mutant RL
delE746_T751insV 1 R776HL858R 2
delE746_T751insVA 1 delE746_T751insA 3
delE746_A750 2 delL747_A750insP 3
delE746_A750insAP 2 dulS768_D770 3
delE746_S752insV 2 G719CS768I 3
delE746_T751insI 2 R831H 3
delL747_A755insSKG 2 S768IV774M 3
delL747_P753insS 2 delE709_T710insD 4
delL747_T751 2 delL747_K754insANKG 4
delT751_I759insN 2 dulH773 4
E709KL858R 2 dulN771_H773 4
G719AL858R 2 E709AG719A 4
G719AL861Q 2 G724SL861Q 4
L858R 2 K757R 4
harboring this EGFR mutation type. These EGFR mutations
as well as their corresponding RLs were used for further
analysis in our study.
Modeling of EGFR mutants
Only several EGFR mutant crystal structures are available from the Protein Data Bank (PDB) [41], due to the cost and complexity in structure determination by experi-ments. We adopted the released mutant structures from PDB, such as L858R (PDB: 2ITZ), while modeled most of them using Rosetta [36]. We carried out Rosetta
high-resolution ddg_monomer (HRDM) protocol and
comparative modeling (CM) protocol to generate the EGFR mutants based on the crystal structure of WT
EGFR (PDB: 2ITY) [42, 43]. Rosetta ddg_monomerwas
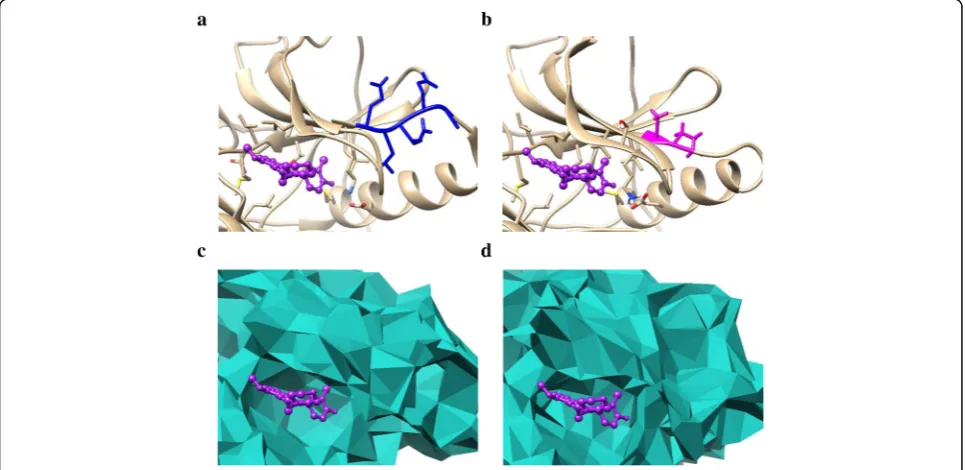
applied to predict the point mutation, such as L861Q and G719C_S768I. Other mutation types such as delE746_A750 (deletion), dulN771_H773 (duplication) and delE746_A750insAP (modification) were modeled by using the CM protocol. We further refined the pre-dicted mutant structures using Amber [37], where 1000 steps of minimization were conducted to optimize the structures. Figures 1a and b show the comparison of the WT EGFR and the mutant delE746_A750insAP modeled using Rosetta.
Molecular dynamics (MD) simulation
MD simulation can be used to study the interaction of molecules for a fixed period of time, and record the movements as trajectories which are determined by
solving Newton’s equations of motion. We employed
Amber 12 [37] to conduct MD simulation to the EGFR mutant-drug complex. The complex was obtained by aligning the predicted mutant structure to the WT
EGFR and appending drug molecule to it. Amberff99SB
force field is adopted to describe the forces between parti-cles in the simulation. As the simulation was performed in a solvent environment, we solvated the complex into a periodic TIP3P water box, where molecules exit one side of the box will wrap to the other side. Then we conducted a series of steps (minimization, heating, density equilibra-tion, and constant pressure equilibration) to equilibrate the system. At the environment of desired temperature, density and pressure, the production MD simulation was performed for 2 ns. We saved the motion trajectories every 10 ps and a total of 200 trajectory frames were col-lected for each mutant-drug complex.
Alpha shape modeling and solid angle calculation
After the motion trajectories of each mutant were obtained, we carried out alpha shape modeling for each trajectory frame, in order to show the surface geometric properties of the mutant structure. The alpha shape [38, 39] can provide effective approximation of the original shape of a molecule with a computational geometric model. We employed Computational Geometry Algorithms Library (CGAL) [44] to generate the weighted alpha shape models of the EGFR mutants. Figures 1c and d show the alpha shape models of the drug binding pocket of WT EGFR and the mutant delE746_A750insAP, respectively.
a b
c d
1 50 100 150 200
0 20 40 60
Statistics of convex (SA > 0) and concave (SA < 0) atoms
Frame
Number of atoms
Convex (delL747_T751) Concave (delL747_T751) Convex (delE709_T710insD) Concave (delE709_T710insD)
1 50 100 150 200
0 20 40 60
Statistics of convex (SA > 0.5) and concave (SA < −0.5) atoms
Frame
Number of atoms
Convex (delL747_T751) Concave (delL747_T751) Convex (delE709_T710insD) Concave (delE709_T710insD)
Fig. 2aandbshow the solid angle values at the drug binding site of the first trajectory frame of the mutants delE709_T710insD and delL747_T751, respectively. The dark dashed lines indicate the position of 0.candddemonstrate the number of convex and concave atoms with different solid angle value thresholds at the drug binding site of the two mutants
a b
c d
e f
1 50 100 150 200
0.2 0.4 0.6 0.8
Convex degree comparison
Frame
Average convex degree
delE746_T751insVA L861R
1 50 100 150 200
0.2 0.4 0.6 0.8
Convex degree comparison
Frame
Average convex degree
delL747_P753insS L861R
1 50 100 150 200
0.2 0.4 0.6 0.8
Convex degree comparison
Frame
Average convex degree
delE746_T751insVA dulN771_H773
1 50 100 150 200
0.2 0.4 0.6 0.8
Convex degree comparison
Frame
Average convex degree
delL747_P753insS dulN771_H773
1 50 100 150 200
0.2 0.4 0.6 0.8
Convex degree comparison
Frame
Average convex degree
delE746_T751insVA G724S_L861Q
1 50 100 150 200
0.2 0.4 0.6 0.8
Convex degree comparison
Frame
Average convex degree
delL747_P753insS G724S_L861Q
Then we used solid angle to characterize the geometric properties of each atom at the drug binding site. Solid angle describes the curvature by providing a value (in the range of [−1, 1]) to show the concave or convex properties of each surface atom. If the solid angle value falls in [−1, 0), the shape is defined as a concave one while a convex shape is obtained if the value is in (0, 1]. The detailed def-inition of solid angle can be found in [33, 40].
Results and Discussion
Based on the motion trajectories obtained from MD simulation, we carried out alpha shape modeling for all the 30 EGFR mutants. A total of 200 trajectory frames were collected in the production MD simulation process. Thus, the alpha shape model was built for 200 times for
each mutant. Then we used solid angle to characterize the atoms at the drug binding site. In this study, the drug binding site of a mutant structure was defined as the amino acid residues at the drug binding site of the WT EGFR. Specifically, a total of 14 residues of 102 atoms are involved at the drug binding site of the WT EGFR. A few mutations locate just at the drug binding site, such as G719A_L858R, while the majority of mutations do not.
We computed the solid angles of all the atoms at the drug binding site, and the values of those who were not at the surface of the drug binding site were set to zero. Figures 2a and b show the solid angle values at the first
trajectory frame of the mutants delL747_T751 (RL= 2)
and delE709_T710insD (RL= 4). According to theRLsof
the two mutants, they are classified to the drugResponse
and No-response group, respectively. As shown in the two figures, the number of convex atoms of the mutant delE709_T710insD is more than that of delL747_T751. Then we counted the number of convex and concave atoms for all the 200 trajectory frames of the two mutants respectively, and even made a further step to calculate the number of atoms with SA (solid angle
value) > 0.5 or SA <− 0.5. Figures 2c and d indicate
that the concave indexes of the two mutants are mixed together while the convex ones are clearly separated. Consequently, we only consider the convex-related char-acteristics of the mutants in the following studies.
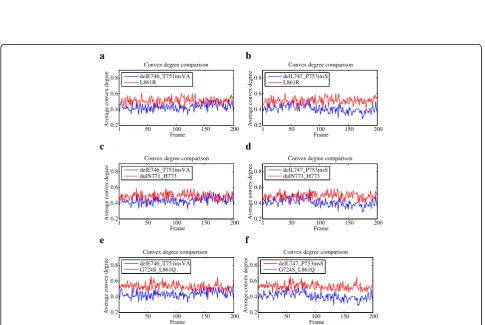
First, we computed the average convex degree of the drug binding site for all the motion trajectory frames of each mutant. For a specific trajectory frame, the average convex degree was calculated as the sum of all the solid angle values of convex atoms at the drug binding site di-vided by the total number of convex atoms in this area. Figure 3 shows the comparison of average convex degree
of the drugResponsemutants delE746_T751insVA (RL= 1)
and delL747_P753insS (RL= 2), and the No-response
ones L861R (RL= 4), dulN771_H773 (RL= 4) and
G724S_L861Q (RL= 4). Although the two groups of
mu-tants cannot be separated perfectly, the average convex
degree of delE746_T751insVA and delL747_P753insS are generally lower than that of L861R, dulN771_H773 and G724S_L861Q.
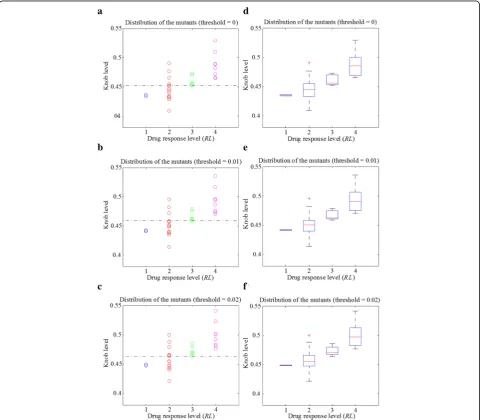
Then we defined knob level, the mean of the average convex degrees for the 200 trajectory frames, to characterize the drug binding site of each mutant. The solid angle values of some atoms are very close to zero (Figs. 2a and b), making a large difference on the average convex degree of each trajectory frame. Therefore, we set a solid angle value threshold to avoid their influence. Afterwards, we explored the relationship between knob level and drug response level of the 30 mutants. The re-sults are shown in Fig. 4, with solid angle value thresh-old setting to 0, 0.01 and 0.02 respectively. Figures 4a to c are the scatter plots of the mutants. When the
threshold equals to 0.01, the mutants of the Response
and No-response groups can be separated with only 3
errors (3 mutants belonging toRL= 2 are wrongly
cate-gorized). Figures 4d to f shows the corresponding box plots of Figs. 4a to c, respectively. As shown in these figures, the median knob level values (bands inside the boxes) of the four drug response level groups are clearly separated. In addition, the main bodies (boxes) of the
two groups (Response andNo-response) of mutants are
a b
c d
e f
1 10 20 30
0 5 10 15 20
25 Statistics of convex atoms (SA > 0)
Mutant
Number of convex atoms
RL = 1 RL = 2 RL = 3 RL = 4
1 10 20 30
0 2 4 6
8 Statistics of convex atoms (SA > 0.7)
Mutant
Number of convex atoms
RL = 1 RL = 2 RL = 3 RL = 4
at different knob levels, when the threshold equals to 0.01 or 0.02.
Besides the aforementioned definition of knob level, we alternatively computed the mean of the solid angle value of each atom at the drug binding site from the 200 trajectory frames. In this way, an average drug binding site of each mutant was obtained. Thus, we used the average convex degree of this drug binding site as the knob level to describe the mutant. Figures 5a to d show the comparison of the solid angle values of the atoms at
the average binding site of the drug Response mutants
delE746_T751insV (RL= 1) and delE746_A750 (RL= 2),
and theNo-responseones delL747_K754insANKG (RL=
4) and S768I_V774M (RL= 3). Although there is not
much difference between the total number of convex
atoms of theResponseandNo-responsegroups, the solid
angle values of convex atoms in the No-response group
are generally greater than that of the Response group.
We also counted the number of convex atoms (SA > 0) and the number of atoms with SA > 0.7 at the average drug binding site of each mutant (Figs. 5e and f ). The number of convex atoms of the 30 mutants is irregular for different response level groups. However, the number
of atoms with SA > 0.7 of theNo-responsegroup is equal
to or more than that of theResponsegroup.
Afterwards, we used the average convex degree (the sum of all the solid angle values of convex atoms at the average drug binding site divided by the total number of convex atoms in this area) to characterize the knob level of the average drug binding site of each mutant. Similarly,
some solid angle values are close to zero, and we set a solid angle value threshold to remove their influence. The relationship between knob level and drug response level of the mutants are shown in Fig. 6. When the solid angle value threshold equals to 0.01 or 0.02, only three mutants
of the two groups (ResponseandNo-response groups) are
wrongly distinguished by setting a certain knob level boundary (dark dashed lines in Figs. 6b and c), showing an accuracy of 90 % (27/30). In addition, the main bodies of the two groups of mutants are in different knob level ranges.
Conclusions
In this study, we analyzed the motion trajectories of the EGFR mutants obtained from MD simulation. The EGFR mutant structures were generated using Rosetta. Amber was employed to carry out MD simulation of the EGFR mutant-drug system. The motion trajectories were col-lected every 10 ps and a total of 200 frames were obtained for each mutant. Then we computed alpha shape model of each trajectory frame and characterized the curvature of the atoms at the drug binding site using the solid angle. In one aspect, we calculated the average convex degree at the drug binding site of each trajectory frame, and ob-tained the knob level of a mutant by computing the mean value of the convex degrees of the 200 frames. On the other hand, we calculated the mean of the solid angle value of each atom at the drug binding site from the 200 trajectory frames. In this way, an average drug binding site could be obtained, and the average convex degree of this binding site was calculated to measure the knob level of a mutant. Finally, we analyzed the relationship between the knob level of the drug binding site and the drug response level of the mutants. Results show that 90 % of the mu-tants can be grouped correctly by setting a certain knob level threshold.
To validate our model, we can compare the predicted response with the clinically obtained drug response of the EGFR mutants collected from literature. Meanwhile, the newly collected clinical data provide resources to refine our model to make further prediction more ac-curately. For example, L858R_T790M is a well-known mutant which is resistant to gefitinib. Then we can compute its alpha shape model and derive the knob level of the drug binding pocket in the aforementioned two ways. As the best grouping accuracy is achieved when the solid angle threshold equals to 0.01 for both the two way situations (Figs. 4b and b). We set the threshold to 0.01, and obtained the knob level of 0.5298 and 0.4964 with the two approaches, respect-ively. According to knob level thresholds of the drug
Responsemutants and theNo-responseones in Figs. 4b and b, the mutant of L858R_T790M can be categorized
to theNo-responsegroup, which is consistent with our
knowledge.
By using the obtained relationships between knob level and drug response level of the EGFR mutants, we can have a general classification of a new EGFR mutant before measuring the drug response from clinical evaluation. We can model the 3D structure as well as the alpha shape of a new EGFR mutant to derive the knob level of the drug binding pocket. According to the obtained knob level
threshold of the drugResponseandNo-responsegroups,
we are able to predict the drug response of the new mutant. The results can be used for clinical guidance and can benefit the patients with a more effective therapy.
Acknowledgements
We thank Dr. Victor H.F. Lee and Dr. Maria P. Wong for providing the clinical data used in this study. We also acknowledge the support of Hong Kong Research Grants Council (CityU 11200715).
Funding
This work was supported by the Hong Kong Research Grants Council (CityU 11200715).
Availability of data and materials
The EGFR mutation types used in this work and the corresponding drug responses are shown in Table 1.
Authors’contributions
L.M. carried out the molecular dynamics simulations, performed structural analysis, and drafted the manuscript. B.Z. participated in the design of the study as well as the analysis of the results. H.Y. initiated the project, participated in the design of the study, and helped draft the manuscript. All authors read and approved the final manuscript.
Competing interests
The authors declare that they have no competing interests.
Consent for publication Not applicable.
Ethics approval and consent to participate
This study was approved by Institutional Review Board of the University of Hong Kong/Hospital Authority Hong Kong West Cluster.
Received: 24 May 2016 Accepted: 1 September 2016
References
1. Lynch TJ, Bell DW, Sordella R, Gurubhagavatula S, Okimoto RA, Brannigan BW, et al. Activating mutations in the epidermal growth factor receptor underlying responsiveness of non-small-cell lung cancer to gefitinib. New Engl J Med. 2004;350:2129–39.
2. Paez JG, Jänne PA, Lee JC, Tracy S, Greulich H, Gabriel S, et al. EGFR mutations in lung cancer: correlation with clinical response to gefitinib therapy. Sci. 2004;304:1497–500.
3. Jemal A, Bray F, Center MM, Ferlay J, Ward E, et al. Global cancer statistics. CA Cancer J Clin. 2011;61:69–90.
4. Hanna N, Shepherd FA, Fossella FV, Pereira JR, De Marinis F, von Pawel J, et al. Randomized phase III trial of pemetrexed versus docetaxel in patients with non-small-cell lung cancer previously treated with chemotherapy. J Clin Oncol. 2004;22:1589–97.
6. Gazdar A. Activating and resistance mutations of EGFR in non-small-cell lung cancer: role in clinical response to EGFR tyrosine kinase inhibitors. Oncog. 2009;28:S24–31.
7. Sharma SV, Bell DW, Settleman J, Haber DA. Epidermal growth factor receptor mutations in lung cancer. Nat Rev Cancer. 2007;7:169–81. 8. Normanno N, De Luca A, Bianco C, Strizzi L, Mancino M, Maiello MR, et al.
Epidermal growth factor receptor (EGFR) signaling in cancer. Gene. 2006;366:2–16. 9. Solca F, Dahl G, Zoephel A, Bader G, Sanderson M, Klein C, et al. Target
binding properties and cellular activity of afatinib (BIBW 2992), an irreversible ErbB family blocker. J Pharmacol Exp Ther. 2012;343:342–50.
10. Tebbutt N, Pedersen MW, Johns TG. Targeting the ERBB family in cancer: couples therapy. Nat Rev Cancer. 2013;13:663–73.
11. Zhang Y, Wang L, Zhang M, Jin M, Bai C, Wang X. Potential mechanism of interleukin‐8 production from lung cancer cells: An involvement of EGF-EGFR-PI3K-Akt-Erk pathway. J Cell Physiol. 2012;227:35–43. 12. Rikova K, Guo A, Zeng Q, Possemato A, Yu J, Haack H, et al. Global survey of
phosphotyrosine signaling identifies oncogenic kinases in lung cancer. Cell. 2007;131:1190–203.
13. Bar J, Onn A. Overcoming molecular mechanisms of resistance to first-generation epidermal growth factor receptor tyrosine kinase inhibitors. Clin Lung Cancer. 2012;13:267–79.
14. Kari C, Chan TO, de Quadros MR, Rodeck U. Targeting the Epidermal Growth Factor Receptor in Cancer Apoptosis Takes Center Stage. Cancer Res. 2003;63:1–5.
15. Ono M, Kuwano M. Molecular mechanisms of epidermal growth factor receptor (EGFR) activation and response to gefitinib and other EGFR-targeting drugs. Clin Cancer Res. 2006;12:7242–51.
16. Hirata A, Ogawa SI, Kometani T, Kuwano T, Naito S, Kuwano M, Ono M. ZD1839 (Iressa) induces antiangiogenic effects through inhibition of epidermal growth factor receptor tyrosine kinase. Cancer Res. 2002;62:2554–60. 17. Sordella R, Bell DW, Haber DA, Settleman J. Gefitinib-sensitizing EGFR mutations
in lung cancer activate anti-apoptotic pathways. Sci. 2004;305:1163–7. 18. Maemondo M, Inoue A, Kobayashi K, Sugawara S, Oizumi S, Isobe H, et al.
Gefitinib or chemotherapy for non-small-cell lung cancer with mutated EGFR. New Engl J Med. 2010;362:2380–8.
19. Sequist LV, Martins RG, Spigel D, Grunberg SM, Spira A, Jänne PA, et al. First-line gefitinib in patients with advanced non-small-cell lung cancer harboring somatic EGFR mutations. J Clin Oncol. 2008;26:2442–9. 20. Han SW, Kim TY, Hwang PG, Jeong S, Kim J, Choi IS, et al. Predictive and
prognostic impact of epidermal growth factor receptor mutation in non-small-cell lung cancer patients treated with gefitinib. J Clin Oncol. 2005;23:2493–501.
21. Mitsudomi T, Morita S, Yatabe Y, Negoro S, Okamoto I, Tsurutani J, et al. Gefitinib versus cisplatin plus docetaxel in patients with non-small-cell lung cancer harbouring mutations of the epidermal growth factor receptor (WJTOG3405): an open label, randomised phase 3 trial. Lancet Oncol. 2010;11:121–8.
22. Kris MG, Natale RB, Herbst RS, Lynch Jr TJ, Prager D, Belani CP, et al. Efficacy of gefitinib, an inhibitor of the epidermal growth factor receptor tyrosine kinase, in symptomatic patients with non-small cell lung cancer: a randomized trial. Jama. 2003;290:2149–58.
23. Pao W, Miller VA, Politi KA, Ricly G, Somwar R, Zakowski MF, et al. Acquired resistance of lung adenocarcinomas to gefitinib or erlotinib is associated with a second mutation in the EGFR kinase domain. PLoS Med. 2005;2:225. 24. Kobayashi S, Boggon TJ, Dayaram T, Jänne PA, Kocher O, Meyerson M, et al.
EGFR mutation and resistance of non-small-cell lung cancer to gefitinib. New Engl J Med. 2005;352:786–92.
25. Bean J, Brennan C, Shih JY, Riely G, Viale A, Wang L, et al. MET amplification occurs with or without T790M mutations in EGFR mutant lung tumors with acquired resistance to gefitinib or erlotinib. Proc Natl Acad Sci. 2007;104:20932–7.
26. Engelman JA, Zejnullahu K, Mitsudomi T, Song Y, Hyland C, Park JO, et al. MET amplification leads to gefitinib resistance in lung cancer by activating ERBB3 signaling. Sci. 2007;316:1039–43.
27. Bell DW, Gore I, Okimoto RA, Godin-Heymann N, Sordella R, Mulloy R, et al. Inherited susceptibility to lung cancer may be associated with the T790M drug resistance mutation in EGFR. Nat Genet. 2005;37:1315–6.
28. Regales L, Gong Y, Shen R, de Stanchina E, Vivanco I, Goel A, et al. Dual targeting of EGFR can overcome a major drug resistance mutation in mouse models of EGFR mutant lung cancer. J Clin Investig. 2009;119:3000.
29. Gottesman MM. Mechanisms of cancer drug resistance. Annual Rev Med. 2002;53:615–27.
30. Ozben T. Mechanisms and strategies to overcome multiple drug resistance in cancer. FEBS Lett. 2006;580:2903–9.
31. Cao ZW, Han LY, Zheng CJ, Ji ZL, Chen X, Lin HH, Chen YZ. Computer prediction of drug resistance mutations in proteins. Drug Discov Today. 2005;10:521–9.
32. Hao G, Yang G, Zhan C. Structure-based methods for predicting target mutation-induced drug resistance and rational drug design to overcome the problem. Drug Discov Today. 2012;17:1121–6.
33. Ma L, Wang DD, Huang Y, Wong MP, Lee VH, Yan H. Decoding the EGFR mutation-induced drug resistance in lung cancer treatment by local surface geometric properties. Comput Biol and Med. 2015;63:293–300.
34. Zhu Z, Sun B, Ma Y, Shao J, Long H, Zhang X, et al. Three immunomarker support vector machines-based prognostic classifiers for stage IB non-small-cell lung cancer. J Clin Oncol. 2009;27:1091–9.
35. Wang DD, Zhou W, Yan H, Wong M, Lee V. Personalized prediction of EGFR mutation-induced drug resistance in lung cancer. Sci Rep. 2013;3:1–8. 36. Leaver-Fay A, Tyka M, Lewis SM, Lange OF, Thompson J, Jacak R, et al.
ROSETTA3: an object-oriented software suite for the simulation and design of macromolecules. Methods Enzymol. 2011;487:545–74.
37. Case D, Darden T, Cheatham III TE, Simmerling C, Wang J, Duke R, et al. AMBER 12. San Francisco: University of California; 2012.
38. Edelsbrunner H, Mücke EP. Three-dimensional alpha shapes. ACM Trans Gr (TOG). 1994;13:43–72.
39. Edelsbrunner H, Weighted alpha shapes. University of Illinois at Urbana-Champaign, Department of Computer Science. 1992.
40. Zhou W, Yan H, Hao Q. Analysis of surface structures of hydrogen bonding in protein-ligand interactions using the alpha shape model. Chem Phys Lett. 2012;545:125–31.
41. The Protein Data Bank. [http://www.rcsb.org]. Accessed 23 Dec 2015. 42. Kellogg EH, Leaver-Fay A, Baker D. Role of conformational sampling in
computing mutation-induced changes in protein structure and stability. Proteins Struct Funct Bioinform. 2011;79:830–8.
43. Martí-Renom MA, Stuart AC, Fiser A, Sánchez R, Melo F,Šali A. Comparative protein structure modeling of genes and genomes. Annual Rev Biophys Biomol Struct. 2000;29:291–325.
44. Computational Geometry Algorithms Library. [https://www.cgal.org/]. Accessed 29 Dec 2015.
• We accept pre-submission inquiries
• Our selector tool helps you to find the most relevant journal • We provide round the clock customer support
• Convenient online submission • Thorough peer review
• Inclusion in PubMed and all major indexing services • Maximum visibility for your research
Submit your manuscript at www.biomedcentral.com/submit