TRANS Asian Research Journals
http://www.tarj.in 15
P u b l i s h e d b y : T R A N S A s i a n R e s e a r c h J o u r n a l s
AJMR:
A s i a n J o u r n a l o f
M u l t i d i m e n s i o n a l
R e s e a r c h
( A D o u b l e B l i n d R e f e r e e d & R e v i e we d I n t e r n a t i o n a l J o u r n a l )
CUSTOMER PERCEPTION AND BEHAVIOR TOWARDS CARNATION:
A STUDY WITH SPECIAL REFERENCE TO JALANDHAR CITY
Rohan Sharma*; Pratibha Dhand**
*Assistant Professor,
Innocent Hearts Group of Institutions, **Innocent Hearts Group of Institutions.
ABSTRACT
The study focuses on the perception of customers towards carnation. A sample of 50 customers was taken from Jalandhar city. The data was analyzed by applying t-test. The results indicated that overall customers were not satisfied with the service provided by carnation, but they happy with schemes run by carnation such as free coupons, reminders etc.
KEYWORDS: Carnation, Perception, Satisfaction, Service.
_________________________________________________________________________
INTRODUCTION
TRANS Asian Research Journals
http://www.tarj.in 16
buyer from groups such as family, peers and society in general. Customer behaviour study is based on different things such as on consumer buying behaviour, in which buyer plays three different roles namely consumer, spender and purchaser. This study has shown that consumer behaviour is quite difficult to predict, even for experts in the field. Companies use different marketing techniques to satisfy customers need and wants. No doubt, consumer behaviour keeps on changing with change of time and experience.
REVIEW OF LITERATURE
Mandeep Kaur and Sandhu (2006) focus on some important features of cars and considered that the most of the respondents focus on the safety and comfort factor, majority of the customer demand for luxury feature at low price. So the manufacturers must design the product giving maximum importance to these factors. Chidambaram and Alfread (2007) study examine the customer bahaviour regarding the pre purchase behaviour of car, they focused on different factors but as per the customer more importance is fuel efficiency than other factors. They believe that the brand name tells them something about product quality, utility, technology and they prefer to purchase the passenger cars which offer high fuel efficiency, good quality, technology, durability and reasonable price. Satya Sundaram (2008) analyzed the competition makes the automobile manufacturer to launch at least one new model or a variant of the model every year. The study also reveals that diesel cars are becoming popular in India. Clement Sudhakar and Venkatapathy (2009) studied the influence of friends group play an important role in purchase of car in Coimbatore District. It was also found that the influence of friends is higher for the purchase of small sized and midsized cars. Brown et al (2010) analyzed the consumer’s showing positive attitude towards European, Japanese and the US cars. The brand name is more important for customers in that, the buyer behaviour in Namakkal in Tamil Nadu is sought to be analyzed here. The scope and the area of the study are unique in nature.
OBJECTIVES
The purpose of this research was to study the behavior of consumers and their perception towards carnation. Hence, the study aimed at the following objectives.
1. To know the overall satisfaction level of customers towards carnation
2. To know the customers perception towards carnation
METHODOLOGY
SAMPLE
The present research was conducted on a sample of 50 customers from Jalandhar District, Punjab, and samples were randomly collected. The age of the customers vary from 25-52 years.
PROCEDURE
TRANS Asian Research Journals
http://www.tarj.in 17
that respondents would fill the same within 15-20 minutes. Cronbach’s Alpha was used to make sure the internal reliability of the instrument, the value of alpha should lie between 0 and 1. In our case, the value of Cronbach’s Alpha comes to 0.511. The reliability and validity was found to be within the acceptable norms.
RESULT AND DISCUSSION
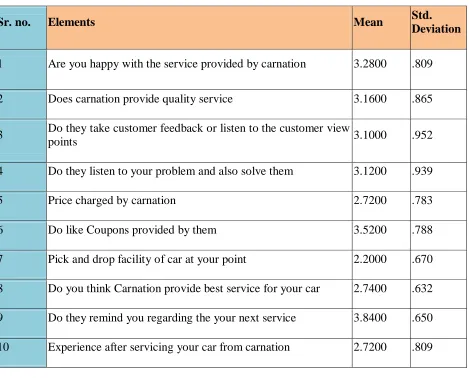
TABLE 1: SHOWS THE MEAN VALUE AND STANDARD DEVIATION
Sr. no. Elements Mean Std.
Deviation
1 Are you happy with the service provided by carnation 3.2800 .809
2 Does carnation provide quality service 3.1600 .865
3 Do they take customer feedback or listen to the customer view
points 3.1000 .952
4 Do they listen to your problem and also solve them 3.1200 .939
5 Price charged by carnation 2.7200 .783
6 Do like Coupons provided by them 3.5200 .788
7 Pick and drop facility of car at your point 2.2000 .670
8 Do you think Carnation provide best service for your car 2.7400 .632
9 Do they remind you regarding the your next service 3.8400 .650
10 Experience after servicing your car from carnation 2.7200 .809
TRANS Asian Research Journals
http://www.tarj.in 18
service for your car having the mean value 2.74 and standard deviation of .632. Do they remind you regarding your next service showing the mean value 3.84 and standard deviation of .650 Overall experience from carnation having the mean value 2.72 and standard deviation of .809.
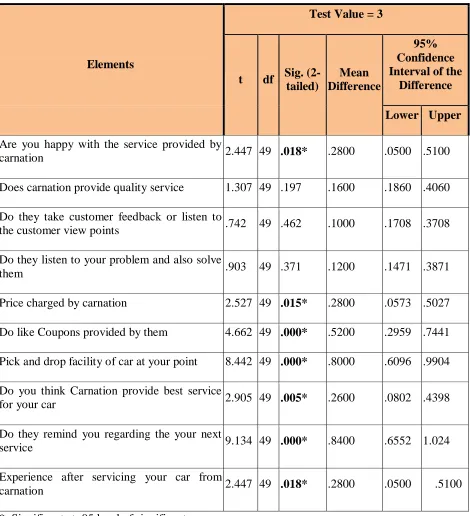
TABLE 2: SHOW THE ONE-SAMPLE TEST
Test Value = 3
Elements
t df Sig. (2-tailed)
Mean Difference
95% Confidence Interval of the
Difference
Lower Upper
Are you happy with the service provided by
carnation 2.447 49 .018* .2800 .0500 .5100
Does carnation provide quality service 1.307 49 .197 .1600 .1860 .4060
Do they take customer feedback or listen to
the customer view points .742 49 .462 .1000 .1708 .3708
Do they listen to your problem and also solve
them .903 49 .371 .1200 .1471 .3871
Price charged by carnation 2.527 49 .015* .2800 .0573 .5027
Do like Coupons provided by them 4.662 49 .000* .5200 .2959 .7441
Pick and drop facility of car at your point 8.442 49 .000* .8000 .6096 .9904
Do you think Carnation provide best service
for your car 2.905 49 .005* .2600 .0802 .4398
Do they remind you regarding the your next
service 9.134 49 .000* .8400 .6552 1.024
Experience after servicing your car from
carnation 2.447 49 .018* .2800 .0500 .5100
TRANS Asian Research Journals
http://www.tarj.in 19
The table 2 explain about the one sample t test in which various elements has been taken into consideration such as are you happy with the service provided by carnation showing the t value of 2.447 having the significant difference .018 ≤.05. The Price charged by carnation showing the significant difference and having the t value of 2.527 (.015≤.05). Do like Coupons provided by them having the significant difference with t value 4.62 (.000≤.05). Pick and drop facility of car at your point having the significant difference with t value 8.44(.000≤.05). Do you think Carnation provide best service for your car showing the significant difference with t value 2.90 (.005≤.05). Do they remind you regarding your next service showing the significant difference with t value 9.13 (.000≤.05). Experience after servicing your car from carnation showing the significant difference with t value 2.44 (.018≤ .05)
TABLE 3: SHOWS THE MEAN VALUE ON THE BASIS OF GENDER
Sr.
no Elements Male Female t
Sig. (2-tailed)
1 Are you happy with the service provided by carnation
3.350 3.000 1.217 .673
2 Does carnation provide quality service 3.250 2.800 1.834 .204
3 Do they take customer feedback or listen to the customer view points
3.125 3.000 0.414 .428
4 Do they listen to your problem and also solve them
3.175 2.900 1.145 .023*
5 Price charged by carnation 2.825 2.300 2.630 .096
6 Do like Coupons provided by them 3.700 2.800 2.921 .033*
7 Pick and drop facility of car at your point 2.250 2.000 2.130 .002*
8 Do you think Carnation provide best service for your car
2.800 2.500 1.533 .940
9 Do they remind you regarding the your next service
3.900 3.600 1.540 .540
10 Experience after servicing your car from carnation
2.825 2.300 2.588 .049*
*: Significant at .05 level of significant
TRANS Asian Research Journals
http://www.tarj.in 20
significant difference in male and female having the mean value of 3.70 and 2.80, having the t value 2.92 (.033≤ .05). Pick and drop facility of car at your point showing the significant difference in male and female having the mean value of 2.25 and 2.00, having the t value 2.13 (.002≤ .05). Experience after servicing your car from carnation showing the significant difference in male and female having the mean value of 2.82 and 2.30, having the t value 2.58 (.049≤ .05).
CONCLUSION
The results prove that customers are not satisfied with service provided by carnation. Their expectations are quite high when compared with whatever service is delivered by carnation to them. The analysis also prove that customers prefer carnation services in some cases such as free coupons by carnation which gives extra benefits to the customers at the time of car servicing, reminder of next service by making phone calls, but overall satisfaction level is not so high. With this customers also feel that carnation should go for two-wheeler servicing also.
REFERENCE
Belch, G.E., & Belch, M.A. (2007): “Advertising and Promotion: An Integrated Marketing Communications Perspective” Seventh Edition. New York: McGrawHill, p. 12-18.
Brown J., C. Dvid Light & Gregory M. Gazda (2010): “Attitude towards European, Japanese and US cars”, European Journal of Marketing, Vol. 21 No.5, p.91 – 100.
Chidambaram & Alfread (2007): “A Study on Brand Preference of Passenger Car with Reference to Coimbatore City”, Indian Journal of Marketing, Vol.34, No.9, p.30-39.
Clement Sudhakar J., & Venkatapathy R.(2009): “A Study on Automobile Purchase – Peer Influence in Decision Making”, Indian Journal of Marketing, Vol.35, No.6, p.16-24.
Engel, James F., Kollat, David T., Blackwell & Rodger D. (1968): “Consumer Behavior” 1st ed. New York: Holt, Rinehart and Winston, p. 23-29.
Kuester, Sabine (2012): “Strategic Marketing & Marketing in Specific Industry Contexts” University of Mannheim, p. 110-119.
Mandeep Kaur & Sandhu, H.S (2006): “A Study on Factors Influencing Buying Behaviour of Passenger Car Market”, Paradigm, Vol. 8, No.2, p.69-77.