Vol.9 (2019) No. 6
ISSN: 2088-5334
Implementing a Web-based Application for Analysis and Evaluation of
Heart Rate Variability Using Serverless Architecture
Mitko M. Gospodinov
#, Evgeniya Gospodinova
* #Scientific and Engineering Union, 5, Nish str. Veliko Tarnovo, 5000, Bulgaria E-mail: [email protected]
*
Institute of Robotics, Akad. G. Bonchev str. block 2, Sofia, 1113, Bulgaria E-mail: [email protected]
Abstract— This article is devoted to the development of a web-based application for analysis and evaluation of Heart Rate Variability (HRV) using serverless architecture. Advancements in information algorithms and computing technologies have been playing an increasingly important role in cardiology, as continuous monitoring of patients’ health can be vital to their well-being. One physiological parameter that can be easily measured and that can provide indispensable insight into the state of the human body is the HRV. HRV analysis can assess not only the physiological state of the body but also provide the capability to monitor its dynamics and predict future diseases. As the research in the sphere of cardiology is constantly growing there is a multitude of new ways to assess the physiological state of patients and provide an early indicator to pathological conditions. Therefore, there is a need to bring these advances to a growing number of end-users (health-care professionals and patients) in the shortest possible time. To address this problem, this study proposes the development of a web-based application for analysis and evaluation of HRV by applying linear and nonlinear mathematical methods. The application is created using a serverless architectural approach, which allows for fast development time, as there is no need to manage server infrastructure, and for automatic scaling to dynamically match the number of requests. The developer can instead focus on implementing the logic for the HRV analysis algorithms and deliver new improvements at a faster rate. The proposed web application can be accessed by any device that is connected to the Internet and is optimized to handle both an intermittent and a consistent volume of requests. The algorithms implemented in the web application have been validated by examining two groups of subjects (young adults and older adults) using linear and non-linear models. The obtained results from the two groups can be compared with a set of reference values (only for the linear methods)and an assessment can be made whether each studied parameter is within the normal range or outside it (its value is too high or too low). To aid the assessment for HRV, the results obtained by the linear and nonlinear analysis are presented using a set of both graphs and tables.
Keywords—web-based application; serverless architecture, heart rate variability; time-domain analysis; frequency-domain analysis; nonlinear analysis.
I. INTRODUCTION
Increasingly, the attention of specialists is attracted by non-invasive methods for the examination of patients based on the principle of tracking different body system indicators [1]. The heart rate of the body is one of the most accessible physiological parameters, and it reflects the processes of vegetative regulation in the cardiovascular system. The dynamic characteristics of the heart rhythm make it possible to assess the severity of the changes in the patient's cardiovascular system when their health condition changes [2], [3]. The change in heart rate is the earliest prognostic sign of many diseases [4].
Analyzing the interval durations between adjacent heartbeats reveals the heart rate variability (HRV), which has proven to be an informative, non-invasive method for
quantitative assessment of the cardiovascular activity [5]. Mathematical analysis of HRV, using linear and nonlinear mathematical models, can indicate the functional state of the patient's organism. For example, the occurrence of pathological conditions in the body of the patient could be indicated by a sharp decrease in HRV. Currently, HRV is used in various areas of medicine for disease risk stratification and for clinical diagnosis, most prominently, of patients with cardiovascular disease.
the body's functional abilities under normal conditions, which enable it to provide early detection of anomalies, which in the absence of the necessary preventative procedures can gradually become serious diseases [3]-[5].
The great interest in HRV and its active study has led to the need for standardizing the terminology [6]; developing optimal methods for measuring HRV; describing the HRV parameters; characterizing HRV in normal and pathological conditions. The introduction of this standard has allowed HRV analysis to become a rapidly evolving cardiological field, in which the possibilities of modern information technologies and mathematical methods for analysis and assessment of the patients' healthy cardiac status can be fully realized.
Developed applications for HRV analysis can be divided into two main groups: desktop applications and web-based applications. Over the past two decades, desktop-based applications for the analysis of HRV have been used extensively. According to specialized scientific sources, the leading software developments for the analysis of HRV are as follows: Kubios HRV software [7], Codesna system [8], SinusCor system [9] and others. To this list can be added research systems such as: gHRV [10], and RHRV [11], and the research and development done by the HeartMath Institute [12] on analyzing the interaction between the heart and the brain. With the use of new technologies such as cloud computing, the Internet of Things is becoming more and more prominent in the field of HRV analysis [13]-[18]. Utilizing web-based intelligent systems in cardiology enables centralized storage and processing of cardiac information outside the hospital. These systems allow for remote monitoring of patients to be done, as the patients can submit the data from their cardiac measurements from any device that has internet access. Moreover, these web applications can be beneficial to the diagnosis and prognosis of cardiovascular diseases when examining large-scale cardiac data (24, 48 or 72-hour long Holter records) because they can perform the analysis and evaluation much faster and more efficiently.
The goals of this article are: creating a serverless web-based application for analysis and evaluation of HRV; investigating of two types of HRV signals, corresponding to healthy subjects (young adults and older adults), using linear and nonlinear mathematical methods.
II. MATERIALS AND METHOD
A. Motivation to Create the Serverless Web Application
This article expands on the trend of developing web applications for HRV analysis by presenting and implementing a new model for building web applications, namely the serverless model. While desktop applications are of great use for research purposes, they can become cumbersome when they need to be used by health care professionals to assess patients. Desktop applications need to be installed separately on each device and manually updated which might become a problem when a user does not install an important upgrade in a timely manner. Moreover, these applications can only be accessed from a specific physical location, so there is a usability constraint to the application and to any reports that the application can produce.
Performance-wise desktop applications are limited to the hardware specifications that the device they are run on has. If the device has a small amount of computational power, any analysis can take a long time. It can be seen why the technological trend for remote monitoring of patients is to construct web-based applications and systems that utilize cloud computing.
Traditionally web-applications have been built and hosted on dedicated servers. In a typical web-application client requests would be sent to a server where the application is hosted, the server would process the request and send back a response. Additionally, there would be a database service running on one or more servers that handle the storage needs of the application. In order to improve redundancy and distribute traffic, a load balancer could also be used as part of the architecture. Its role would be to detect if any of the servers, where the application is hosted, has gone down and rerouted the requests away from it; it can also distribute requests evenly between several servers.
All the servers could either be part of a private cloud environment which means that they are owned by the organization managing them or they are leased from a cloud provider. In both cases the management of the server architecture falls on the application developers and the costs associated with such a deployment can be substantial. Moreover, a major drawback of having dedicated servers for an application is that if there are not a lot of user requests that need to be processed, then the servers would not be fully utilized.
In [13] the architecture used for the proposed application relies on containers running on cloud computing instances. Containerisation of services allows for better utilization of computing power which in turn means that the computing instances can scale up and down more seamlessly and that there is less server idle time. However, the management of the architecture on which the containers are run is still left to the developers of the application. While containers provide for applications that maximally utilize server resources, they do not scale by default. New containers can be brought up very quickly. However, they are limited to the computing power available. That is why the underlying computing instances need to be designed to scale up or down depending on demand.
stateless compute containers. These containers are triggered by an event and managed by a third-party cloud provider.
By design, the serverless functions scale automatically. That means that any new user requests would generate new instances of the serverless functions and once the task has completed the example would terminate on its own. This model allows for any traffic pattern to be handled by default at a little cost. If the traffic pattern of the application is very inconsistent – hours with no requests followed by a rapid increase in user traffic – then with the automatic scaling each new request would generate a new serverless function instance. This means there is no idle time, and all new user requests are handled without damaging the user experience [25].
On the other hand, if the application needs to process just a few requests every hour, then in traditional architecture, the hosting server would be running idle most of the time. Conversely, serverless functions would just be running for the duration in which the function can finish execution. Serverless is very cost-efficient as the provider charges only for time an individual request takes to be completed. This means that when the application is not receiving any requests there are absolutely no costs incurred – a major benefit to traditional cloud computing. Because the serverless cloud providers can fully utilize its server architecture to have very little idle time, they can pass those cost savings to their users [26].
Serverless architecture allows developers to create and run programs and services without bothering with the complex management processes involved in operating a huge server framework. This means that developers can create systems to be used in cardiology or other spheres of health care at a more rapid pace, to bring technological advances as fast as possible to the end-users (patients and health-care professionals).
B. Implementation of the Web Application in the created serverless Architecture
The proposed web-application has been developed using serverless services from Amazon Web Services (AWS). However, the architecture principals can easily be ported to other cloud providers such as Microsoft Azure or Google Cloud [27].
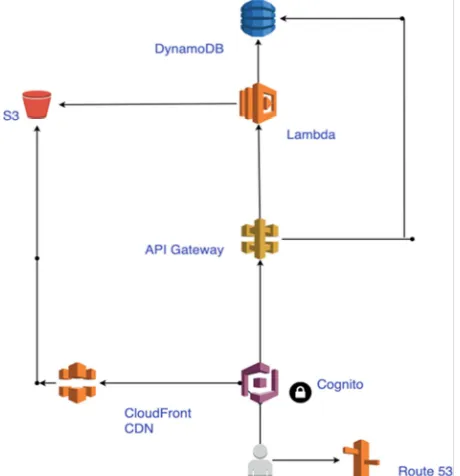
As can be seen in Fig.1 the application is secured using AWS Cognito. It is a service that allows the management of new and existing users and it scales automatically to handle any number of users. Requests to the front-end of the application are processed through CloudFront CDN. CloudFront is a content delivery network that works by caching content on many edge locations around the world. If the application is hosted in a different continent to the user trying to access it, then CloudFront can cache the content at an edge location that is very close to said user, and thus decrease the time needed for the content to be loaded. This can ultimately hugely improve the user’s experience.
Simple Storage Service (S3) is an AWS object storage service that is a data storage architecture that manages data as discrete objects in a flat address space without any hierarchy of directories. S3 is used in the proposed application to store files such as the RR-interval information of patients or the graphs produced by the mathematical
methods used for HRV analysis. These files are stored in S3 after the serverless function has executed the code implementing the linear and non-linear methods.
The front-end of the application is created using VueJS – a reactive JavaScript framework that provides the capability for web-application development. Compared to other JavaScript frameworks Vue is very small (around 20KB) and it can scale quite well, as functionality can be broken down into simple components, which can be continuously reused. The application is developed using NuxtJS which is a framework running on top of VueJS and which allows for static site generation. What that means is that the web application can be hosted on an Amazon S3 as a static site and at an extremely low cost, which depending on the size of the application could be zero.
Even though the web application is hosted as a static site, its content is not static. By using API gateway, the application can execute REST API calls which can either fetch information directly from the backend database or trigger a serverless function that can execute the logic associated to the specific request. The backend of the application consists of DynamoDB, which is a serverless NoSQL database. DynamoDB is an example of a BaaS – the database is fully managed by AWS, so the developer only needs to handle what information is saved or retrieved from it. A NoSQL database was chosen for the demands of this application, in order to provide a scalable solution that can handle large volumes of structured data in the form of the output results from the HRV analysis.
analyze the file for the respective patient and the value outputs for the corresponding mathematical method will be stored in DynamoDB, whereas the graphs will be sent to S3 storage [28], [29].
The web application allows for users to upload files with RR information (obtained from digital ECG records) acquired using Holter or electrocardiographic devices and then view them at different time scales, as that can be dynamically adjusted by the user. After the file has been uploaded to the S3 storage location, it can be analyzed and the output can be observed from the Analysis page of the application. Using Cognito, access to the information of patients can be restricted only to the health-care professionals working with them or to the patients themselves.
C. Methods for HRV analysis
The developed serverless web-based application performs HRV analysis and evaluation by applying linear and nonlinear methods. The methods and parameters used to analyze HRV in the proposed application are shown in Table I. The linear methods (Time-Domain and Frequency-Domain analysis) are used for the direct evaluation of HRV [3].
The time-domain analysis is used very commonly in cardiac practice because it has good diagnostic properties. The essential components of this analysis are the statistical and geometric measurements both of which can be used to quantify and evaluate HRV. Compared to statistical computations, the geometric ones are less influenced by the quality of the data studied. However, geometric measurements are less accurate than their counterparts [2], [3].
Frequency domain parameters are based on spectral analysis, which provides the distribution of each of the many frequencies present in the RR intervals [3], [5]. Studies show that the frequency domain is composed of three discrete components: Very Low Frequency (VLF; 0.00 - 0.04 Hz), Low Frequency (LF; 0.04 - 0.15 Hz), and High Frequency (HF; 0.15-0.40 Hz) [3]. The Power Spectral Density methods are combined into two classes: non-parametric and parametric. In the developed web application, the following were used: Fast Fourier Transform (FFT), representative of nonparametric methods, and AutoRegressive (AR), representative of parametric methods [2].
Through Time-Domain and Frequency-Domain analysis, objective information about the condition of the cardiovascular system can be obtained. The quantitative dimensions of the studied parameters in these analyses have significant clinical application because the boundaries of norm-pathology are well established [6].
The statistical, geometric, and spectral characteristics of the RR intervals have been thoroughly studied and are used by physicians to evaluate patients with cardiovascular disease. At the same time, in recent years, non-linear mathematical methods of analysis are actively introduced that describe the "chaotic" dynamics of the RR series [2].
As the mechanisms behind aperiodic changes in cardiac rhythm have not yet been fully explained, these methods are
not standardized, and they are now under investigation. Estimation of the degree of fractality is important in the study of RR signals to obtain information about long-range dependence and to predict their behavior. The fractality of the RR time series is related to the irregularity on the one hand and the repeatability over a wide range of time scales on the other. The RR intervals are usually nonlinear and non-stationary time series, with much of the information encoded in the dynamics of their fluctuations. These fluctuations have an internal structure with fractal (self-similar) properties which can be observed at different time intervals; therefore, the fluctuations can be measured with fractal and multifractal exponents. Fractal processes can be characterized by their fractal dimension or their Hurst parameter as those parameters reflect the degree of self-similarity of the methods. The value of the Hurst exponent is in the range of 0.5 and 1.0 if the process under examination is fractal [30]. The processes having fractal properties are divided into 2 groups: monofractal and multifractal. Monofractal processes are characterized by only one value of the Hurst exponent and they have one fractal dimension, while the multifractal processes are characterized by a spectrum of Hurst exponentials or with a spectrum of fractal dimensions.
Fractal methods such as DFA (Detrended Fluctuation Analysis) [3], [32], rescaled range plot (R/S) [30] and MFDFA (MultiFractal Detrended Fluctuation Analysis) [31], [33] have been used in the developed web application for nonlinear HRV analysis.
Another non-linear method for analyzing HRV used by the web application is the Poincaré method. It is a geometric method in which each RR interval is represented as a function of the previous interval [3]. Visual analysis of HRV, based on the Poincaré plot, provides important information on the physiological state of patients. It allows physicians to view the RR intervals of the entire ECG record immediately and quickly detect cardiovascular disorders if any [5].
The web application also uses Approximate Entropy and Sample Entropy as nonlinear methods for analyzing HRV. These methods determine the degree of irregularity of the RR time series. The low entropy values are characteristic of regular time series, while higher values are inherent in stochastic data [1].
D. Data
1)Subject variables: The RR signals studied correspond
to healthy subjects, which are divided into two groups: 20 young adults (20-30 years) and 20 older adults (70-80 years). The RR time series of subjects studied consists of about 100 000 data points and is extracted from a 24- hour Holter recording of subjects in the supine position.
2)Statistical analysis: It was performed using an unpaired
TABLEI
SUMMARY OF THE HRVPARAMETERS
Parameters Units Description
Ti
m
e-D
o
m
a
in
A
n
a
ly
si
s
Statistical measurement
MeanRR ms Mean RR intervals
SDNN ms Standard deviation of normal RR intervals
SDANN ms Standard deviation of sequential 5-minute normal RR intervals NN50 number Number of successive normal RR interval pairs that differ more
than 50 ms
pNN50 % NN50 divided by the total number of RR intervals
RMSSD ms Square root of the mean squared differences between
successive RR intervals
MeanHR bpm Mean heart rate
SDHR bpm Standard deviation of instantaneous heart rate values Geometrical measurement
HRVTi number The integral of the RR interval histogram divided by the height of the histogram
TINN ms Baseline width of the RR interval histogram
F
re
q
u
en
cy
-D
o
m
a
in
A
n
a
ly
si
s
FFT/AR spectrum
Absolute power ms2 Absolute powers of VLF, LF and HF bands Relative power % Relative powers of VLF, LF and HF bands
Normalized power
n.u. Powers of LF and HF bands in normalized bands
LF/HF - Ratio between LF and HF band powers
N
o
n
li
n
ea
r
A
n
a
ly
si
s
Poincaré plot
SD1 ms Standard deviation 1 (Short term variability)
SD2 ms Standard deviation 2 (Long term variability)
SD1/SD2 - Ratio between SD1 and SD2
R/S plot
Hurst exponent - Index of long-range dependence DFA
Alpha 1 - Short-range scaling exponent
Alpha 2 - Long-range scaling exponent
MFDFA Multifractal
spectrum
- Multifractal spectrum= Alphamax- Alphamin
Entropy Approximate
entropy
- A measure of signal complexity
Sample entropy - A measure of signal complexity
III.RESULTS AND DISCUSSION
The results of this work are presented in the following 2 subsections: creating a web-based application for analysis and evaluation of HRV using linear and nonlinear methods; investigation of 2 groups of healthy subjects (young adults and older adults).
A. Serverless Web-based Application for Analysis and Evaluation of HRV
The developed serverless web-based application for analysis and evaluation of HRV consists of the following functionalities:
1)HRV analysis using linear methods: The application
performs Time-Domain and Frequency-Domain analysis, following the instructions of the standard [6].
2)HRV analysis using non-linear methods: The
application performs Poincaré plot, DFA, MFDFA, R/S plot, Approximate entropy, Sample entropy.
3)Evaluation of the results: The obtained results of the
linear analysis were evaluated by comparing with the
reference values of the parameters studied, following the instructions of a standard [6].
4)Generation of protocol: As a result of the studies
performed, a protocol is generated that includes tabular and graphical information. The protocols can be saved in text file format or as a PDF.
5)Database with images and records: Possibility to
compare the obtained graphical results with the available ones in the created database with images for different groups of patients with cardiovascular diseases and healthy subjects.
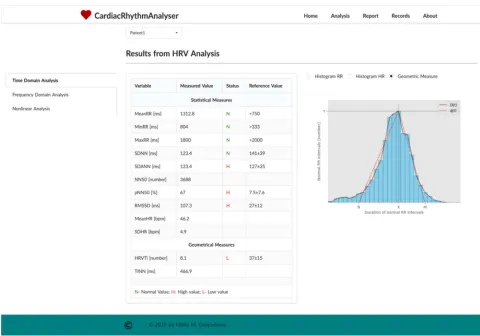
Analysis) by pressing the corresponding button. By default, the results of the Time-Domain analysis are displayed (Fig. 2).
The results of the HRV analysis have been presented in two ways:
1)Table view: The results for the studied parameters can
be seen alongside the respective reference values according to the standard in [6]. If the results are within the specified interval of the reference values, then the status field gets the value N (Normal). If the result is lower than the minimum reference value, then the status is set to L (Low) and if it is higher than the maximum reference value, then the status is set to H (High).
2)Graph view: On the right of the table we can see
graphical results. Depending on the button pressed, the web-based application offers the ability to display 3 types of graphics: the histogram of the RR intervals, the histogram of the. HR and geometric measures. Fig. 2 shows the geometric measure of the histogram of the normal RR intervals.
B. Results of the HRV analysis
It is known that the heart rate is not uniform and it is influenced by various factors such as physiological parameters (age, gender, genetic); diseases (cardiovascular, internal, psychiatric, metabolic); lifestyle factors (sporting activity, increased body weight, smoking, alcohol abuse); external factors (noise, medication). This work studies how age influences HRV.
Fig. 3 shows the RR intervals of a young adult and older adult. The graphs show that heart rate variability is higher in young adults. The values from the statistical and geometric measurements, the frequency domain parameters, and the non-linear parameters are shown in Table II. Based on the obtained results, the following conclusions can be drawn:
1)Time-Domain Analysis: Most of the parameters are
statistically significant since the p-value is less than 0.05. Therefore, the Time-Domain analysis methods can distinguish between the two studied groups of subjects.
2)Frequency-Domain Analysis: All values of the
Frequency-Domain parameters, using FFT spectrum and AR spectrum are statistically significant (p<0.05), and this analysis can distinguish between the two studied groups of subjects.
3)Nonlinear Analysis (Poincaré plot): The values of the
parameters SD1 (ellipse length), SD2 (ellipse width) and SD1/SD2 ratio of Poincaré plot are lower for the subject group of older adults compared to those of the younger subjects. The reduction of SD1 and SD2 leads to a reduction in the area of the ellipses as well as a decrease in the HRV. The Poincaré plot allows for the entire ECG record to be viewed immediately and to quickly detect cardiovascular disorders if any (Fig. 4). The shape of the point cloud provides diagnostic information [3]. The sick subject's graph takes the form of a torpedo, a fan or a complex shape (consisting of several "clouds") depending on the type of disease. The graph of the healthy subject is comet-shaped.
Fig. 3 RR time intervals for young and elderly subjects
Fig. 4 Poincare plot for young and older adults
Our study shows (Fig. 4) that the graph of a healthy young adult has a comet pattern, whereas the chart of a healthy older adult - a torpedo pattern.
4)Nonlinear Analysis (DFA method): The values of the
Alpha 1 and Alpha 2 parameters for the DFA method are in the range between 1.0 and 1.5 for the subjects of the two groups, which implies the presence of fractal behavior in these RR signals.
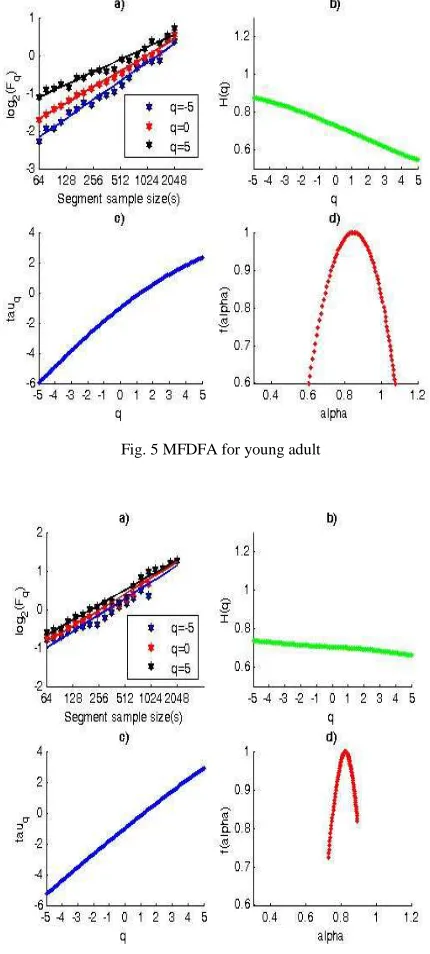
5)Nonlinear Analysis (MFDFA method): Figure 5 and
Figure 6 show the graphs of the parameters studied by MFDFA method. The graphs of the Fluctuation function log Fq (s) vs. scale for different parameter values q for healthy young adult (Fig. 5a) and healthy older adult (Fig. 6a) are straight lines, i.e., the RR times studied are invariant on the scale and therefore have fractal behavior. The slope of the fluctuation functions (Fig. 5a) is different, which is evidence of the multifractal behavior of the investigated signal. The graphs (Fig. 6a) are parallel, i.e., the slope of the fluctuation functions is constant; i.e., this signal has monofractal behavior. The Hurst parameter determines the degree of regularity and the large-scale invariance of the study process. The range of values of the Hurst parameter varies from 1.0 to 0.6 in the case of different values of the parameter q for a healthy young adult (Fig. 5b), therefore, these RR intervals have multifractal behavior. In the case of
an older adult (Fig. 6b), the Hurst parameter is almost constant at different values of the q parameter, so this signal has a monofractal behavior. The function tau (q) is a convex curve (Fig. 5c) for a healthy young adult that proves multifractal. In contrast, tau (q) is a straight line (Fig. 6c) for an older adult having monofractal behavior. The RR signal of the healthy older adult (Fig. 5d) demonstrates a wide range of scaling exponents showing that it has multifractal behavior. The signal of the older adult (Fig. 6d) shows a narrow range of scale factors, and its multifractal spectrum is 5 times smaller than that of the healthy subject. This signal is an example of a monofractal process. The multifractal spectrum of the investigated groups has statistical significance, as the value of p <0.0001. Therefore, healthy young adults can be distinguished from healthy older adults.
Fig. 5 MFDFA for young adult
TABLEII
COMPARISON OF HRVPARAMETERS BETWEEN GROUP1(YOUNG ADULTS) AND GROUP2(OLDER ADULTS) Parameters Group 1(mean ± SD) Group 2 (mean ± SD) P value
Ti
m
e-D
o
m
a
in
A
n
a
ly
si
s
Statistical measurement
Mean RR [ms] 1133.9±177.8 1066.1±65.8 0.1
SDNN [ms] 97.2±20.8 52.0±20.3 0.0001
SDANN [ms] 82.3±17.9 40.5±18.1 0.0001
NN50 [number] 187.0±255.2 2790.8±1265.6 0.0001
pNN50 [%] 3.4±5.2 40.2±20.3 0.0001
RMSSD [ms] 21.0±10.8 72.4±29.1 0.0001
Mean HR [bpm] 59.9±9.8 56.6±3.3 0.2
SDHR [bpm] 6.0±1.4 2.7±0.8 0.0001
Geometrical measurement
HRVTi [number] 19.6±1.4 14.6±1.6 0.0001
TINN [ms] 387.7±65.1 222.2±99.2 0.0001
F
re
q
u
en
cy
-D
o
m
a
in
A
n
a
ly
si
s
FFT spectrum
Power VLF [ms2] 3629.3±998.2 1759.7±1336.0 0.0001
Power LF [ms2] 1846.9±276.6 246.0±147.7 0.0001
Power HF [ms2] 1134.2±204.8 112.8±107.2 0.0001
Power VLF [%] 48.8±15.0 75.2±8.0 0.0001
Power LF [%] 29.9±9.1 19.1±5.0 0.0001
Power HF [%] 22.9±14.9 5.2±3.1 0.0001
Power LF [n.u] 51.0±6.5 80.2±7.8 0.0001
Power HF [n.u] 27.1±5.3 19.7±7.8 0.001
LF/HF ratio 1.9±0.02 4.3±1.8 0.0001
AR spectrum
Power VLF [ms2] 2116.0±848.7 844.3±763.1 0.0001
Power LF [ms2] 898.5±264.1 120.4±105.2 0.0001
Power HF [ms2] 815.7±329.7 46.8±42.2 0.0001
Power VLF [%] 47.3±13.5 81.8±8.6 0.0001
Power LF [%] 28.9±10.2 13.0±5.3 0.0001
Power HF [%] 23.8±14.7 5.2±3.2 0.0001
Power LF [n.u] 52.9±9.1 85.8±8.3 0.0001
Power HF [n.u] 26.0±7.0 35.6±6.3 0.0001
LF/HF ratio 1.9±0.05 2.5±0.58 0.0001
N
o
n
li
n
ea
r
A
n
a
ly
si
s
Poincaré plot
SD1 [ms] 30±10 20±6 0.0005
SD2 [ms] 105±24 85±16 0.004
SD1/SD2 ratio 0.32±0.13 0.25±0.11 0.07
DFA
Alpha 1 1.01±0.23 1.45±0.17 0.0001
Alpha 2 0.98±0.08 1.01±0.08 0.2
MFDFA
Multifractal spectrum 0.5±0.23 0.2±0.16 0.0001
R/S plot
Hurst exponent 0.79±0.08 0.61±0.07 0.0001
Entropy
Approximate entropy 1.57±0.18 1.19±0.25 0.0001
Sample entropy 1.53±0.18 1.04±0.25 0.0001
6)Nonlinear Analysis (R/S plot): When the Hurst
exponent is in the range between 0.5 and 1.0, the studied data have fractal behavior. The Hurst exponent value for the two studied groups is within this range. Therefore, the data exhibit fractal behavior. The Hurst exponent is higher in the young subjects, which is evidence of a higher HRV.
7)Nonlinear Analysis (Entropy): Approximate entropy
and Sample entropy values are higher for the healthy group of young adults compared to the older group of subjects. Higher values of these parameters are evidence that RR series of healthy young people have stochastic behavior.
IV.CONCLUSION
We propose a new architecture for developing web-applications and compared it to the existing ones. In a serverless model, a third-party cloud provider offers fully
managed computing and storage services to the end-user. Thus, the configuration and management of the underlying architecture falls with the cloud provider and not with the developer. The services do utilize servers. However, these servers are abstracted away from the developer. Creating a serverless web application, therefore, offers several advantages compared to traditional web applications: scalability, cost-efficiency and rapid development compared to other cloud technologies.
automated analysis of cardiac information outside the hospital.
Two groups of people were analyzed for validation of the mathematical methods used in the developing of the application. The obtained results showed that the age of the subjects studied influenced HRV, and it decreased with increasing age. This web-based application has no commercial purpose and it is aimed at researchers, doctors, medical professionals for research, or clinical use. The proposed serverless web-based application is open for future development and expansion to meet all current and future requirements of its users.
ACKNOWLEDGMENT
This research work was carried out as part of the scientific project “Investigation of the application of new mathematical methods for the analysis of cardiac data” № КP-06-N22/5, date 07.12.2018, funded by the National Science Fund of Bulgaria (BNSF).
REFERENCES.
[1] M. D. Costa, R. B. Davis, A. L. Goldberger, “Heart Rate Fragmentation: A New Approach to the Analysis or Cardiac Interbeat Internal Dynamics”, Frontiers in Psychology, 8:255, 2017.
[2] U. R. Acharya, K. P. Joseph, N. Kannathal, C. M. Lim,and J. S. Suri, “Heart rate variability: a review”, Medical & Biological Engineering & Computing, vol. 44 (12), pp. 1031–1051, 2006.
[3] G. Ernst, Heart Rate Variability, London: Springer-Verlag, 2014. [4] M. V. Kamath, M. A. Watanabe, A. R. M. Upton (Eds.), Heart Rate
Variability (HRV) Signal Analysis: Clinical Applications, 1st ed., CRC Press Taylor&Francis Group, 2016.
[5] S. Laborde, E. Mosley and J. F. Thayer, “Heart Rate Variability and Cardiac Vagal Tone in Psychophysiological Research– Recommendations for Experiment Planning, Data Analysis, and Data Reporting”, Frontiers in Psychology, 8:213, 2017.
[6] Heart Rate Variability: Standards of Measurement, Physiological
Interpretation, and Clinical Use, Task Force of the European Society of Cardiology and the North American Society for Pacing and Electrophysiology, European Heart Journal, vol. 17, pp. 354-381, 1996.
[7] (2019) M.P. Tarvainen, J. Lipponen, J.-P. Niskanen, P. O. Ranta-aho, “Kubios (ver. 3.3)”, User’s guide. [Online]. Available: https://www.kubios.com/downloads/Kubios_HRV_Users_Guide.pdf. [8] L. Mourot, “CODESNA_HRV, a new tool to assess the activity of the autonomic nevrous system from heart rate variability”, Physical Medicine and Rehabilitation Research, vol. 3(1), pp. 1-6, 2018. [9] R. Bartels, L. Neumamm, T. Pecanha, S. Carvalho,” SinusCor: an
advanced tool for heart rate variability analysis”, BioMed. Eng. OnLine, vol. 16(1), pp. 110-124, 2017.
[10] L. Rodrίguez-Liñres, M.J. Lado, X.A. Vila, A.J. Méndz, P.Guesta, “gHRV: Heart Rate Variability analysis made easy”, Computer Methods and Programs in Biomedicine, vol. 116(1), pp. 26-38, 2014. [11] C.A.G. Martínez, A.O. Quintana, X.A. Vila, M.J.L. Touriño, L.
Rodríguez-Liñares, J.M.R. Presedo, A.J.M. Penín, Heart Rate Variability Analysis with the R package RHRV, Springer International Publishing, 2017.
[12] (2019) HeartMath Institute. [Online]. Available: https://healthy-heart-meditation.com/heartmath-institute/
[13] S. Pandey, W. Voorsluys, S. Niu, A. Khandoker and R. Buyya, “An autonomic cloud environment for hosting ECG data analysis services”, Future Generation Computer Systems, vol. 28, pp. 147-154, 2012.
[14] A. Kalinichenko, S. Motorina, “Algorithms for ECG Analysis in Mobile Cardiac Monitoring Systems”, in Proc. of the 20th Conference of Open Innovations Association, pp. 112-117, April 2017.
[15] O. Barquero-Pérez, T. Quintanilla, J. Garía-Muñoz, C. Soguero-Ruiz, M.R. Wilby, M de la Rosa, M Cabañas, I. Bravo, A. García-Alberola and J. L. Rojo-Álvarez, “eLab: A Web-based Platform to Perform HRV and HRT Analysis and Store Cardiac Signals”, Computing in Cardiology, vol. 40, pp. 21-24, 2013.
[16] J. Mohammed, C. H. Lung, A. Ocneanu, A. Thakral, C. Jones and A. Adler, “Internet of Things: Remote patient monitoring using web services and cloud computing” , IEEE International Conference on Internet of Things (iThings), and IEEE Green Computing and Communications (GreenCom), and IEEE Cyber, Physical and Social Computing (CPSCom), Taipei, pp. 256-263, 2014.
[17] R. N. Kirtana and Y. V. Lokeswari, “An IoT Based Remote HRV Monitoring System for Hypertensive Patients”, International Conference on Computer, Communication, and Signal Processing (ICCCSP), Chennai, India, pp. 1-6, 2017.
[18] J. García, J. D. Trigo, A. Alesanco, P. Serrano, J. Mateo, R. S. Istepatian, “Design and evaluation of wireless decision-support system for heart rate variability study in haemodialysis follow-up procedures”, Computer Methods and Programs in Biomedicine, vol. 88(3), pp. 273-282, 2007.
[19] I. E. Akkus, R. Chen, I. Rimac, M. Stein, K. Satzke, A. Beck, P. Aditya, and V. Hilt, “SAND:Towards high-performance serverless computing”, In Proc. USENIX Annual Technical Conference, 2018, pp. 923-935.
[20] E. Oakes, L. Yang, D. Zhou, and K. Houck, T. Harter, A. C. Arpaci-Dusseau and R. H. Arpaci-Arpaci-Dusseau, “SOCK: Rapid task provisioning with serverless-optimized containers”, In Proc. USENIX Annual Technical Conference, 2018, pp. 57-69.
[21] B. Liston. 2017 (Update 2018) Resize Images on the Fly with AmazonS3, AWS Lambda, and Amazon API Gateway. [Online]. Available: https://aws.amazon.com/blogs/compute/resize-images-on-the-fly-with-amazon-s3-aws-lambda-and-amazon-api-gateway/. [22] S. Hendrickson, S. Sturdevant, T. Harter, V. Venkataramani, A. C.
Arpaci-Dusseau, and R. H. Arpaci-Dusseau, “Serverless Computation with OpenLambda,” in Proc. 8th USENIX Workshop Hot Topics Cloud Computing (HotCloud), 2016, pp. 33–39. [23] M. Roberts. (2018). Serverless Architectures. [Online]. Available:
https://martinfowler.com/articles/serverless.htm.
[24] E. Eyk, A. Iosup, S.Seif, M. Thömmes, “The SPEC Cloud Group’s Research Vision onFaaS and Serverless Architectures”, in Proceedings of the 2nd International Workshop on Serverless Computing WoSC’17, 2017.
[25] T. Taylor, “Top 8 tools to use when working with serverless computing”, TechGenix, 2018.
[26] P. Aditya, I.E. Akkus, A. Beck, R. Chen, V. Hilt, I. Rimac, K. Satzke and M. Stein, “Will Serverless Computing Revolutionize NFV?”, Proceedings of the IEEE, vol. 107, No. 4, pp. 667-678, 2019. [27] K&C Team, “Serverless Architecture for Modern Apps: Stacks
Providers&Caveats”, October 9, 2018 (Updated:April 19, 2019). [28] D. Poccia, AWS Lambda in Action, Manning Publicatios Co, 2017. [29] C. Gurturk, Building Serverless Architectures, Birmingham, UK:
Packt Publishing, 2017.
[30] M. Martinis, A. Knežević, G. Krstačić, and E. Vargović, “Changes in the Hurst exponent of heart beat intervals during physical activities”, Physical Review E, vol. 70(1), Art. No.012903, July 2004.
[31] H. Salat, R. Murcio, E. Arcaute, “Multifractal methodology”, Physica A: Statistical Mechanics and its Applications, vol. 473, pp. 467-487, May 2017.
[32] C.-K. Peng, S.V. Buldyrev, S. Havlin, M. Simons, H.E. Stanley and A.L. Goldberger. “Mosaic Organization of DNA nucleotides”, Physical Review E, vol. 49 (2), pp.1685-1689, 1994.